| Param | Original file | Final file |
|---|---|---|
| Filename | modeM0/AS1A05_094T01_9000003204_21609cztM0_level2.evt | modeM0/AS1A05_094T01_9000003204_21609cztM0_level2_quad_clean.evt |
| Size (bytes) | 293,616,000 | 67,426,560 |
| Size | 280.0 MB | 64.3 MB |
| Events in quadrant A | 2,012,762 | 444,514 |
| Events in quadrant B | 2,105,452 | 459,722 |
| Events in quadrant C | 2,043,575 | 441,147 |
| Events in quadrant D | 2,459,875 | 416,716 |
| Mode M0 | |||
|---|---|---|---|
| Quadrant | BADHDUFLAG | Total packets | Discarded packets |
| A | 0 | 8584 | 183 |
| B | 0 | 8953 | 208 |
| C | 0 | 8726 | 189 |
| D | 0 | 10173 | 209 |
| Mode M9 | |||
|---|---|---|---|
| Quadrant | BADHDUFLAG | Total packets | Discarded packets |
| A | 0 | 13 | 0 |
| B | 0 | 13 | 0 |
| C | 0 | 13 | 0 |
| D | 0 | 14 | 1 |
| Mode SS | |||
|---|---|---|---|
| Quadrant | BADHDUFLAG | Total packets | Discarded packets |
| A | 0 | 84 | 2 |
| B | 0 | 84 | 4 |
| C | 0 | 85 | 3 |
| D | 0 | 85 | 3 |
| Quadrant | Total seconds | Saturated seconds | Saturation percentage |
|---|---|---|---|
| A | 3969 | 20 | 0.503905% |
| B | 3959 | 22 | 0.555696% |
| C | 3964 | 48 | 1.210898% |
| D | 3963 | 66 | 1.665405% |
Noise dominated data is calculated using 1-second bins in cleaned event files. If a bin has >2000 counts, and if more than 50% of those come from <1% of pixels, then it is considered to be noise-dominated and hence unusable.
| Quadrant | # 1 sec bins | Bins with >0 counts | Bins with >2000 counts | High rate bins dominated by noise | Noise dominated (total time) | Noise dominated (detector-on time) | Marked lightcurve |
|---|---|---|---|---|---|---|---|
| A | 7021 | 3985 | 0 | 0 | 0.00% | 0.00% | 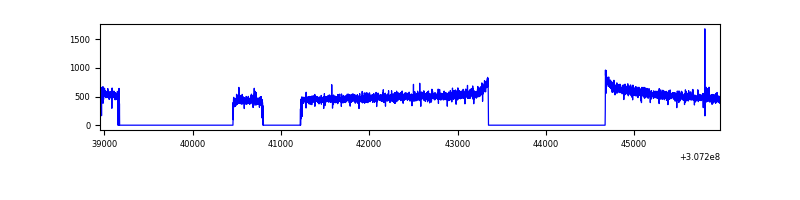 |
| B | 7024 | 3975 | 2 | 2 | 0.03% | 0.05% | 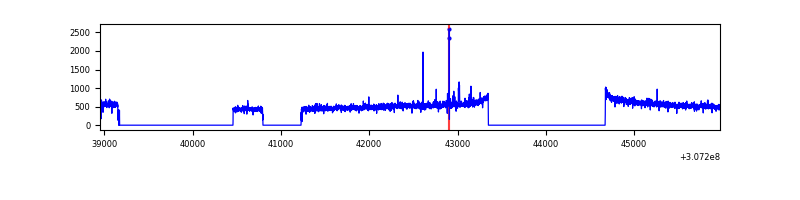 |
| C | 7023 | 3984 | 0 | 0 | 0.00% | 0.00% | 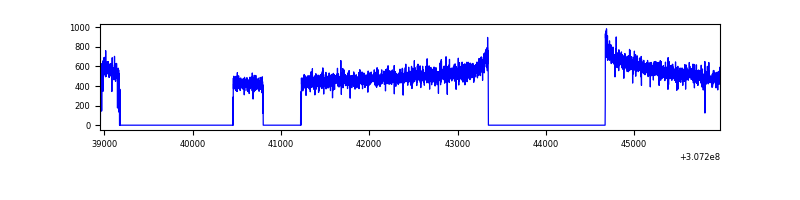 |
| D | 7018 | 3976 | 13 | 13 | 0.19% | 0.33% | 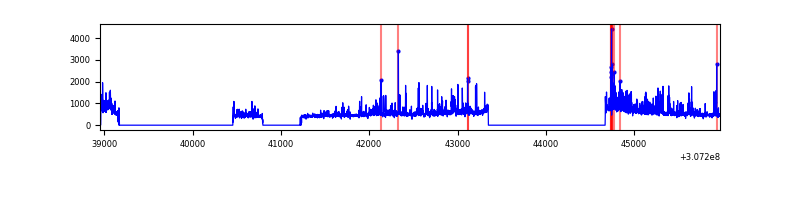 |
Top three noisy pixels from each quadrant. If the there are fewer than three noisy pixels in the level2.evt file, extra rows are filled as -1
| Pixel properties | Quadrant properties | ||||||
|---|---|---|---|---|---|---|---|
| Quadrant | DetID | PixID | Counts | Sigma | Mean | Median | Sigma |
| A | 15 | 174 | 5983 | 52.44 | 520 | 511 | 104.3 |
| A | 13 | 254 | 5097 | 43.95 | 520 | 511 | 104.3 |
| A | 0 | 226 | 4541 | 38.62 | 520 | 511 | 104.3 |
| B | 0 | 190 | 13554 | 133.43 | 523 | 511 | 97.8 |
| B | 0 | 219 | 11709 | 114.56 | 523 | 511 | 97.8 |
| B | 12 | 111 | 11413 | 111.53 | 523 | 511 | 97.8 |
| C | 14 | 238 | 80839 | 687.5 | 503 | 507 | 116.8 |
| C | 13 | 61 | 3518 | 25.77 | 503 | 507 | 116.8 |
| C | 7 | 221 | 1461 | 8.16 | 503 | 507 | 116.8 |
| D | 1 | 52 | 424961 | 3517.6 | 500 | 486 | 120.7 |
| D | 2 | 136 | 100500 | 828.81 | 500 | 486 | 120.7 |
| D | 14 | 35 | 15361 | 123.27 | 500 | 486 | 120.7 |
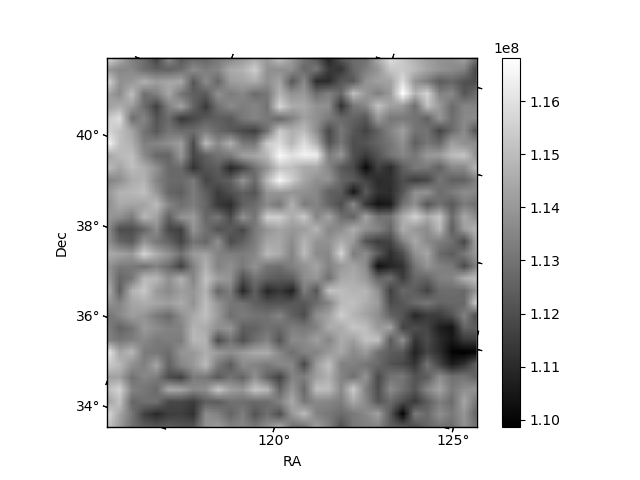
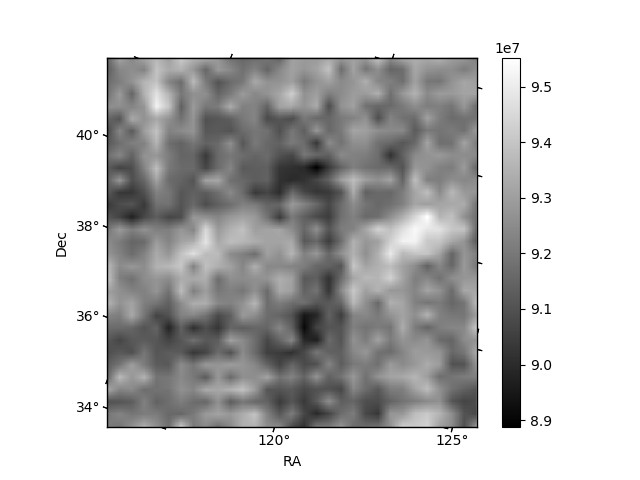
Histogram calculated using DETX and DETY for each event in the final _common_clean file
| Quadrant A | 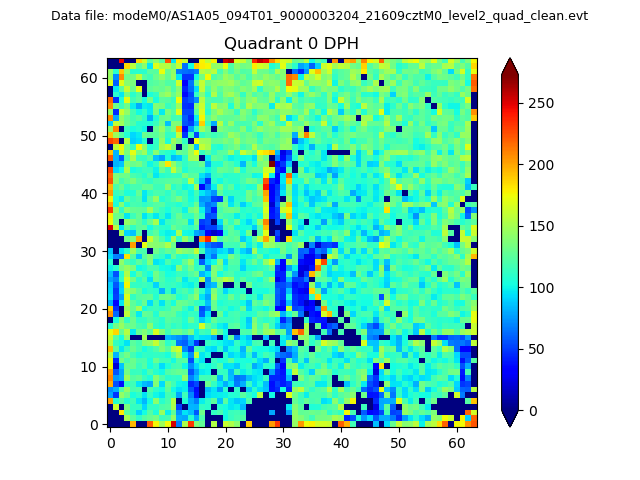 |
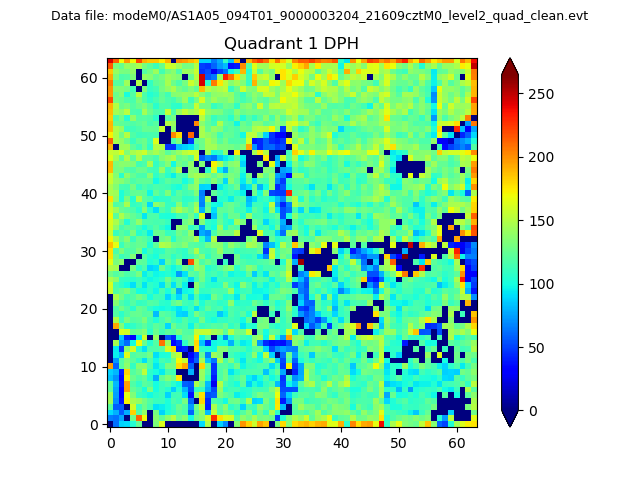 |
Quadrant B |
|---|---|---|---|
| Quadrant D |  |
 |
Quadrant C |
| Plot type | Count rate plots | Images |
|---|---|---|
| Comparison with Poisson distribution Blue bars denote a histogram of data divided into 1 sec bins. Red curve is a Poisson curve with rate = median count rate of data. |
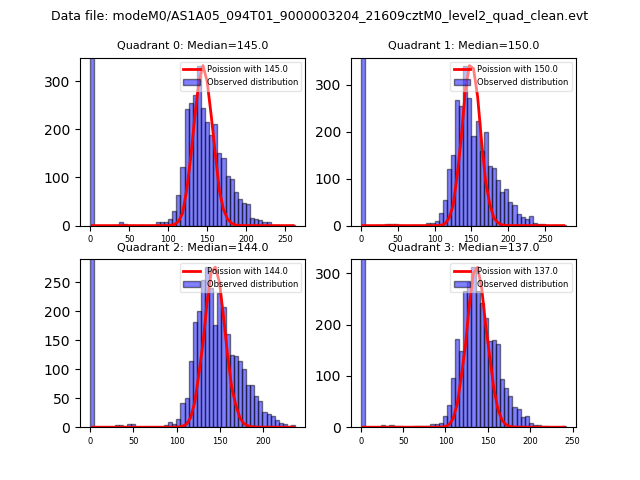 |
 |
| Quadrant-wise count rates Data is divided into 100 sec bins |
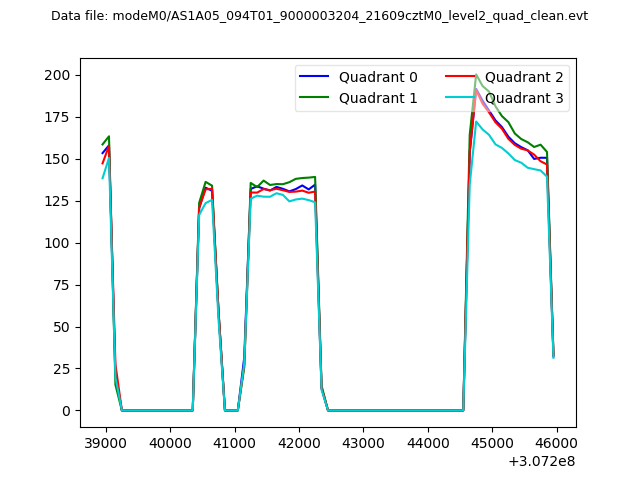 |
|
| Module-wise count rates for Quadrant A Data is divided into 100 sec bins |
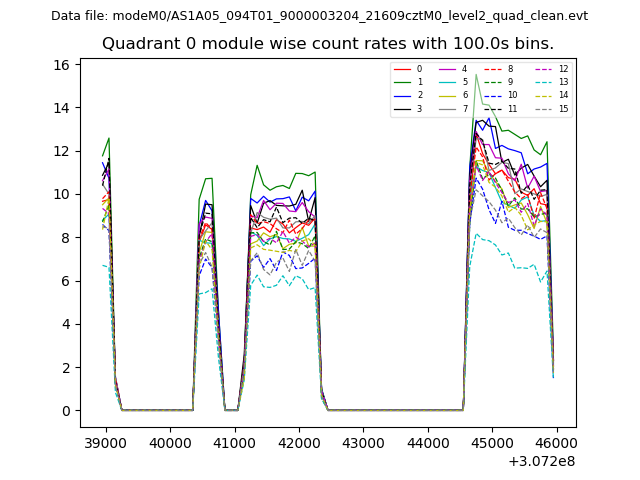 |
 |
| Module-wise count rates for Quadrant B Data is divided into 100 sec bins |
 |
 |
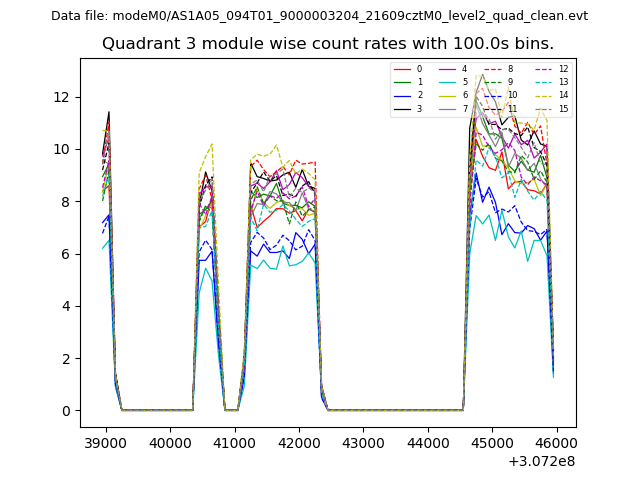
| Module-wise count rates for Quadrant C Data is divided into 100 sec bins |
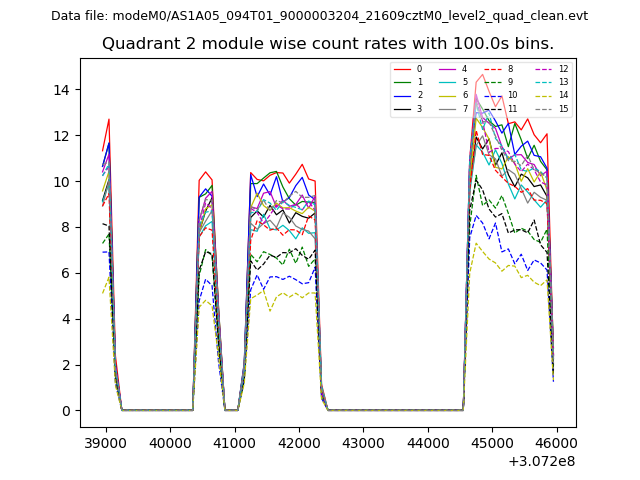 |
 |
| Module-wise count rates for Quadrant D Data is divided into 100 sec bins |
 |
 |
| Parameter | Plot |
|---|---|
| CZT HV Monitor | 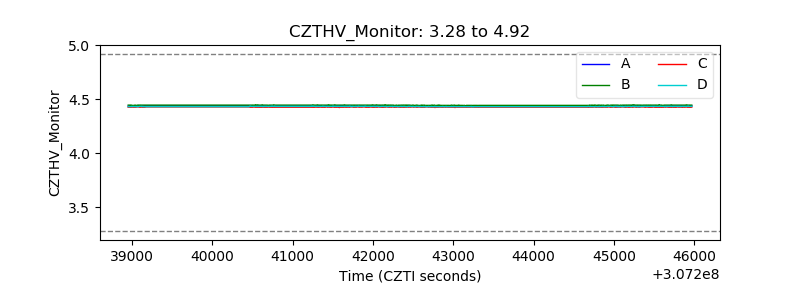 |
| D_VDD | 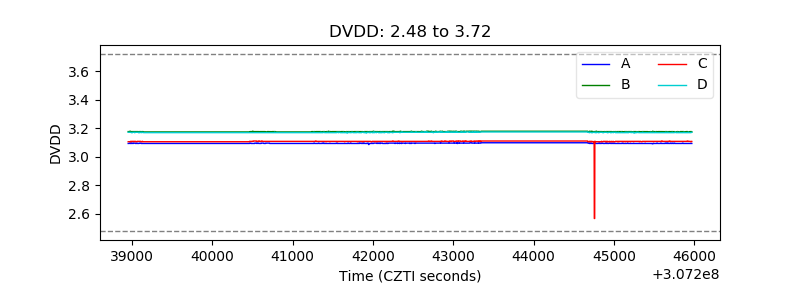 |
| Temperature 1 | 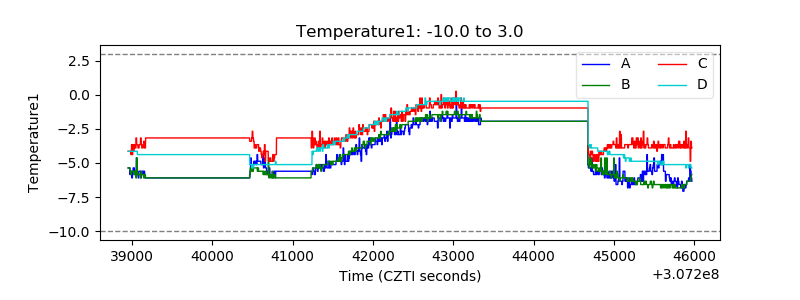 |
| Veto HV Monitor | 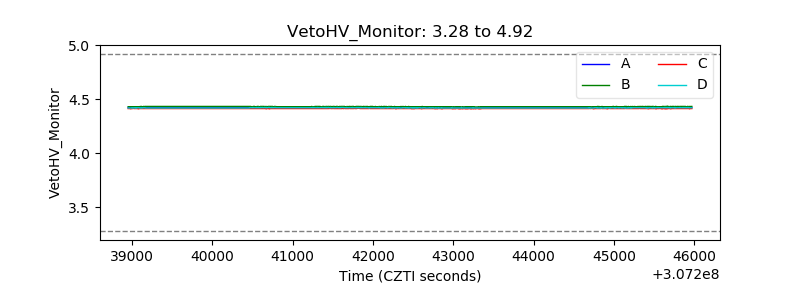 |
| Veto LLD | 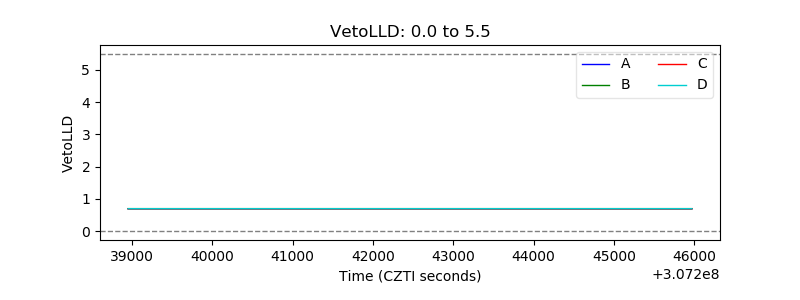 |
| Alpha Counter | 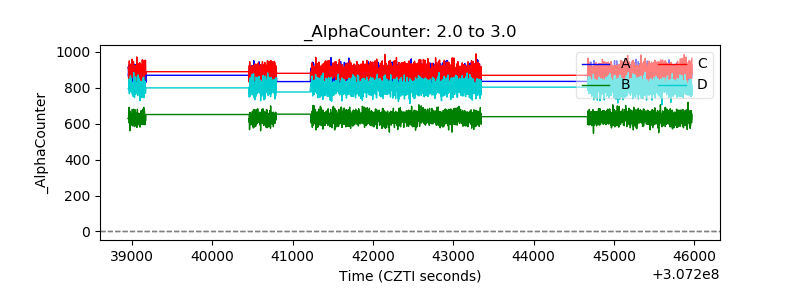 |
| _CPM_Rate | 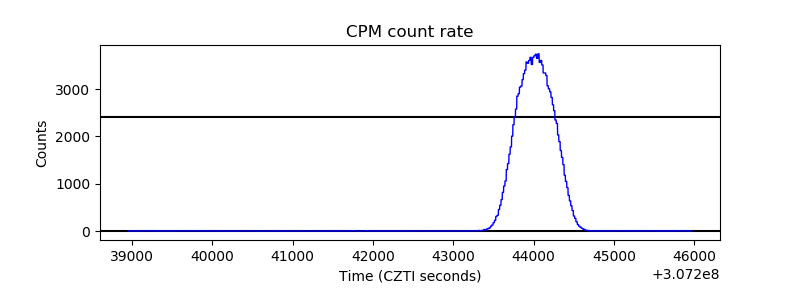 |
| CZT Counter |  |
| +2.5 Volts monitor |  |
| +5 Volts monitor | 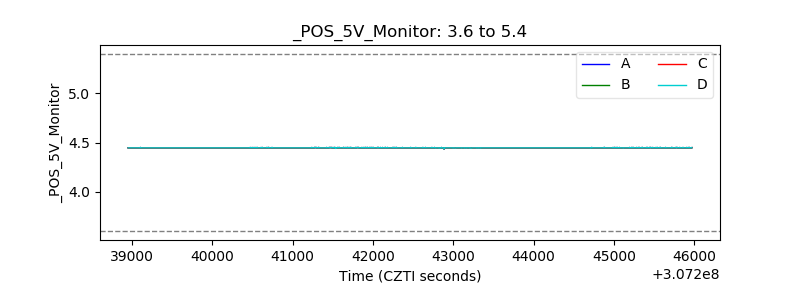 |
| _ROLL_ROT | 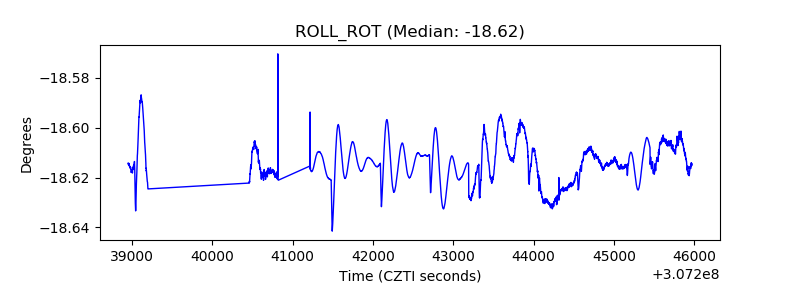 |
| _Roll_DEC | 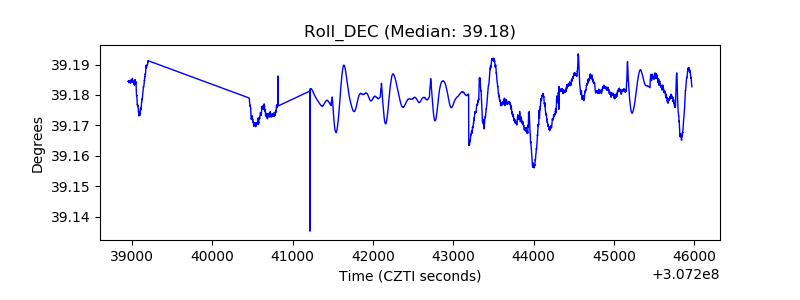 |
| _Roll_RA | 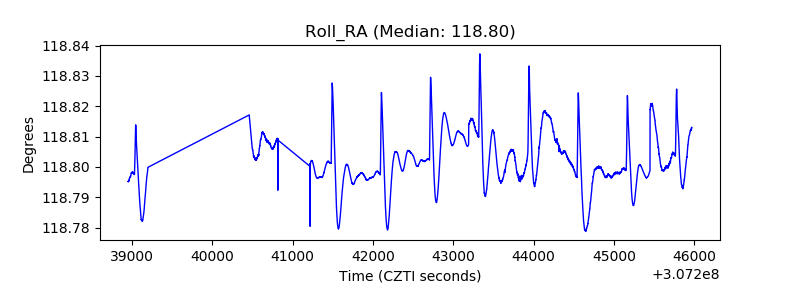 |
| Veto Counter | 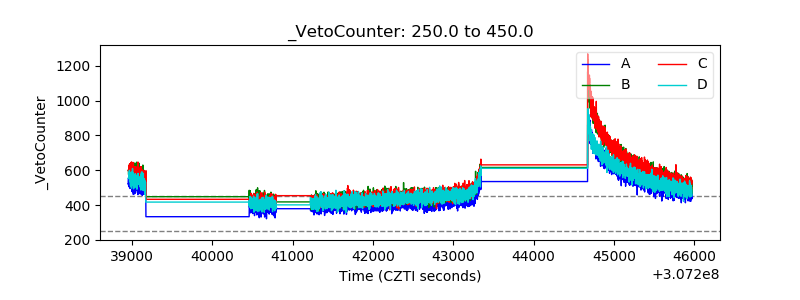 |