| Param | Original file | Final file |
|---|---|---|
| Filename | modeM0/AS1A05_094T01_9000003204_21610cztM0_level2.evt | modeM0/AS1A05_094T01_9000003204_21610cztM0_level2_quad_clean.evt |
| Size (bytes) | 761,353,920 | 184,628,160 |
| Size | 726.1 MB | 176.1 MB |
| Events in quadrant A | 5,217,480 | 1,221,162 |
| Events in quadrant B | 5,506,798 | 1,262,013 |
| Events in quadrant C | 5,293,280 | 1,214,376 |
| Events in quadrant D | 6,317,326 | 1,155,761 |
| Mode M0 | |||
|---|---|---|---|
| Quadrant | BADHDUFLAG | Total packets | Discarded packets |
| A | 0 | 22183 | 2 |
| B | 0 | 23143 | 2 |
| C | 0 | 22381 | 2 |
| D | 0 | 26008 | 2 |
| Mode M9 | |||
|---|---|---|---|
| Quadrant | BADHDUFLAG | Total packets | Discarded packets |
| A | 0 | 27 | 0 |
| B | 0 | 27 | 0 |
| C | 0 | 27 | 0 |
| D | 0 | 27 | 0 |
| Mode SS | |||
|---|---|---|---|
| Quadrant | BADHDUFLAG | Total packets | Discarded packets |
| A | 0 | 218 | 0 |
| B | 0 | 218 | 0 |
| C | 0 | 218 | 0 |
| D | 0 | 218 | 0 |
| Quadrant | Total seconds | Saturated seconds | Saturation percentage |
|---|---|---|---|
| A | 10672 | 32 | 0.299850% |
| B | 10673 | 43 | 0.402886% |
| C | 10673 | 76 | 0.712077% |
| D | 10672 | 184 | 1.724138% |
Noise dominated data is calculated using 1-second bins in cleaned event files. If a bin has >2000 counts, and if more than 50% of those come from <1% of pixels, then it is considered to be noise-dominated and hence unusable.
| Quadrant | # 1 sec bins | Bins with >0 counts | Bins with >2000 counts | High rate bins dominated by noise | Noise dominated (total time) | Noise dominated (detector-on time) | Marked lightcurve |
|---|---|---|---|---|---|---|---|
| A | 13412 | 10674 | 0 | 0 | 0.00% | 0.00% | 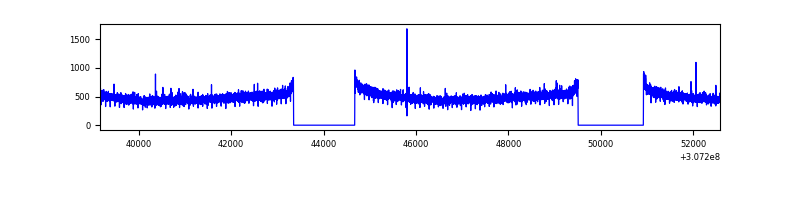 |
| B | 13413 | 10675 | 2 | 2 | 0.01% | 0.02% | 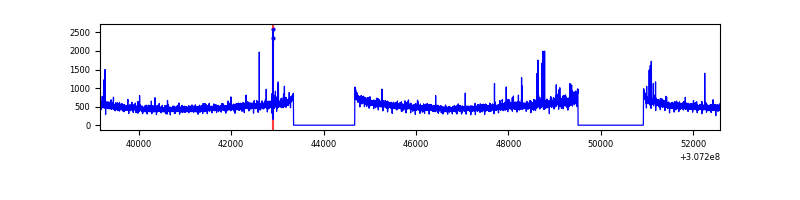 |
| C | 13413 | 10675 | 0 | 0 | 0.00% | 0.00% | 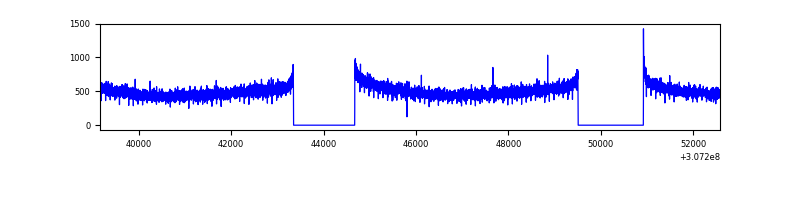 |
| D | 13412 | 10674 | 46 | 46 | 0.34% | 0.43% | 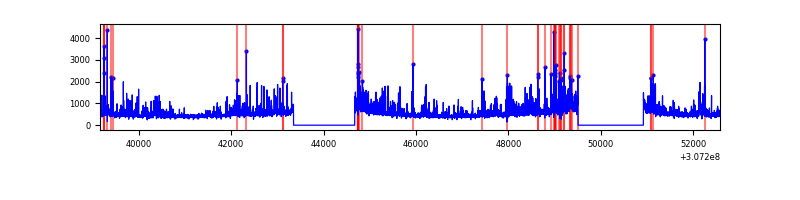 |
Top three noisy pixels from each quadrant. If the there are fewer than three noisy pixels in the level2.evt file, extra rows are filled as -1
| Pixel properties | Quadrant properties | ||||||
|---|---|---|---|---|---|---|---|
| Quadrant | DetID | PixID | Counts | Sigma | Mean | Median | Sigma |
| A | 13 | 254 | 15410 | 52.96 | 1350 | 1325 | 266.0 |
| A | 15 | 174 | 15042 | 51.58 | 1350 | 1325 | 266.0 |
| A | 0 | 226 | 11717 | 39.07 | 1350 | 1325 | 266.0 |
| B | 0 | 229 | 60275 | 238.12 | 1359 | 1332 | 247.5 |
| B | 3 | 64 | 32370 | 125.39 | 1359 | 1332 | 247.5 |
| B | 0 | 219 | 30101 | 116.22 | 1359 | 1332 | 247.5 |
| C | 14 | 238 | 210027 | 696.14 | 1303 | 1315 | 299.8 |
| C | 13 | 61 | 9379 | 26.9 | 1303 | 1315 | 299.8 |
| C | 0 | 10 | 4196 | 9.61 | 1303 | 1315 | 299.8 |
| D | 1 | 52 | 874421 | 2831.61 | 1292 | 1259 | 308.4 |
| D | 2 | 136 | 229088 | 738.83 | 1292 | 1259 | 308.4 |
| D | 14 | 35 | 122973 | 394.71 | 1292 | 1259 | 308.4 |
Histogram calculated using DETX and DETY for each event in the final _common_clean file
| Quadrant A |  |
 |
Quadrant B |
|---|---|---|---|
| Quadrant D |  |
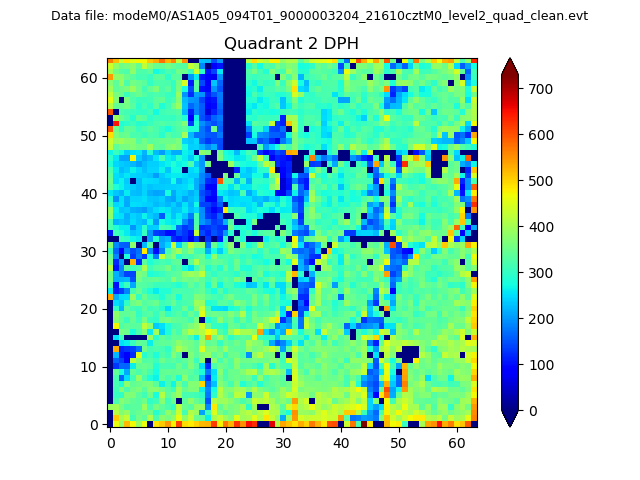 |
Quadrant C |
| Plot type | Count rate plots | Images |
|---|---|---|
| Comparison with Poisson distribution Blue bars denote a histogram of data divided into 1 sec bins. Red curve is a Poisson curve with rate = median count rate of data. |
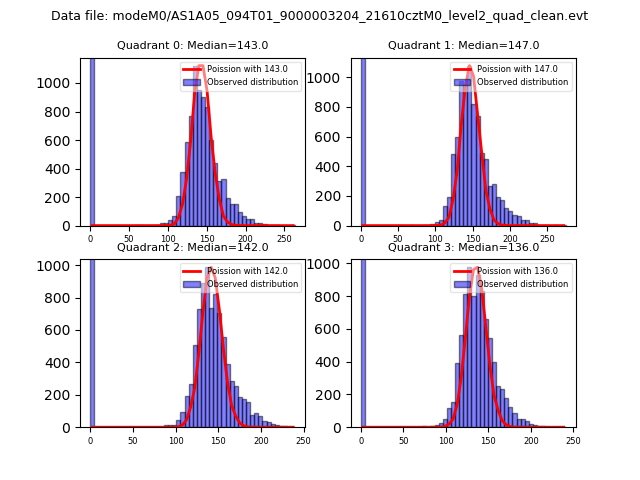 |
 |
| Quadrant-wise count rates Data is divided into 100 sec bins |
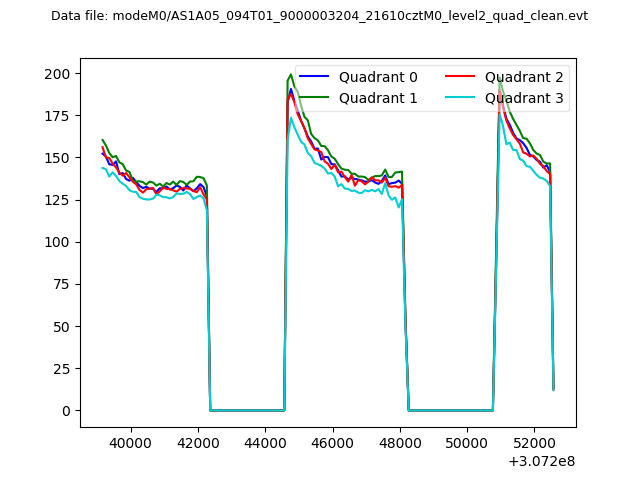 |
|
| Module-wise count rates for Quadrant A Data is divided into 100 sec bins |
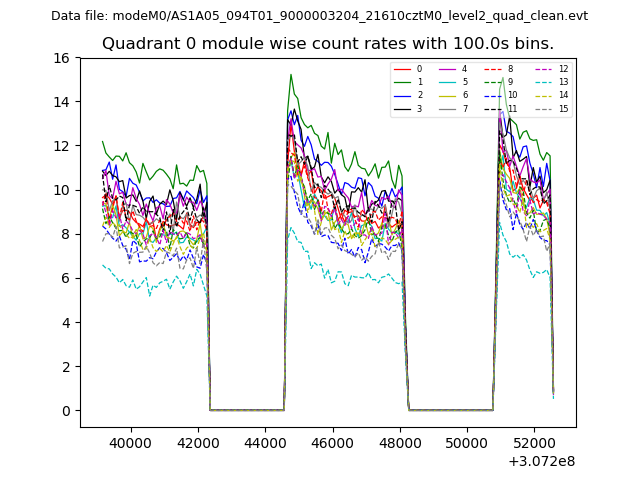 |
 |
| Module-wise count rates for Quadrant B Data is divided into 100 sec bins |
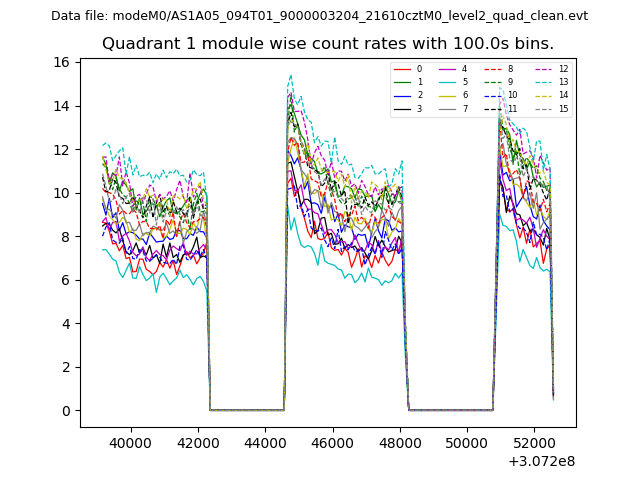 |
 |
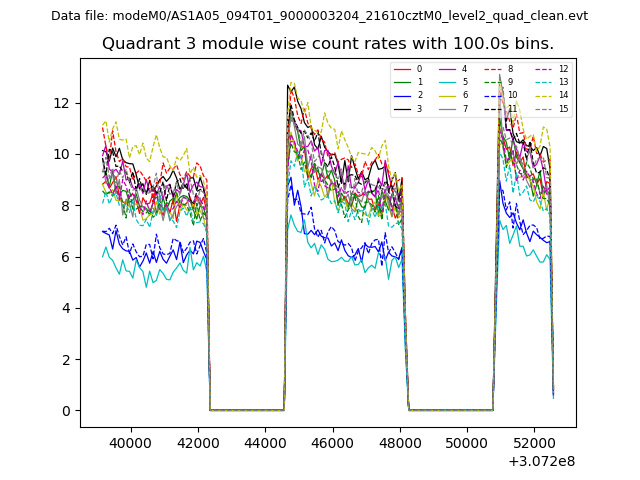
| Module-wise count rates for Quadrant C Data is divided into 100 sec bins |
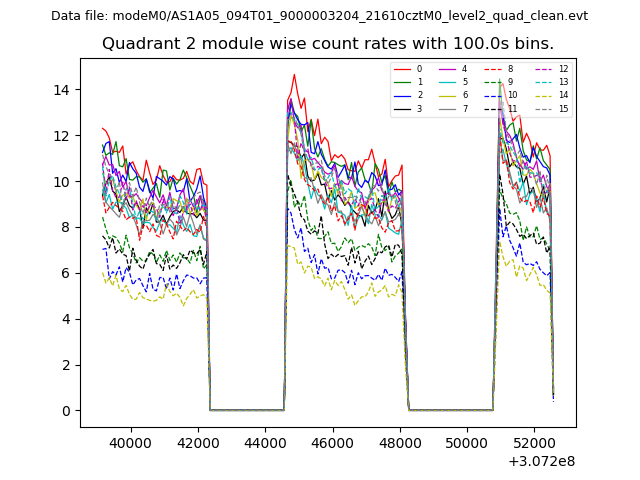 |
 |
| Module-wise count rates for Quadrant D Data is divided into 100 sec bins |
 |
 |
| Parameter | Plot |
|---|---|
| CZT HV Monitor | 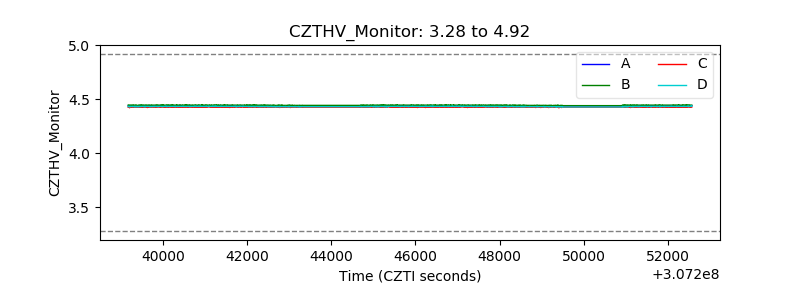 |
| D_VDD | 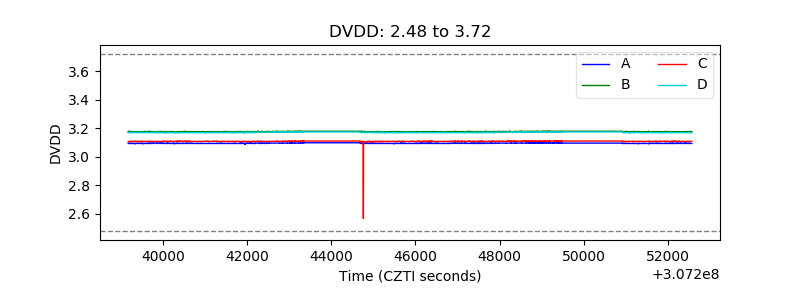 |
| Temperature 1 | 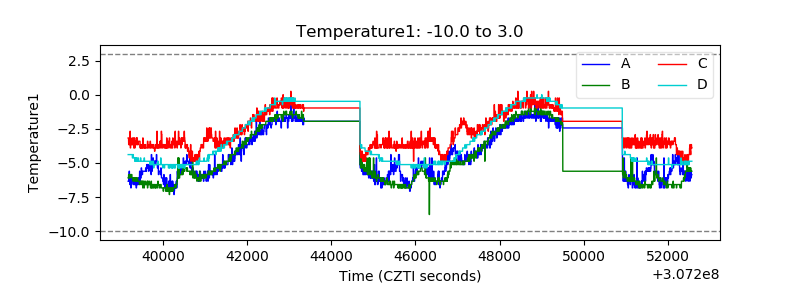 |
| Veto HV Monitor | 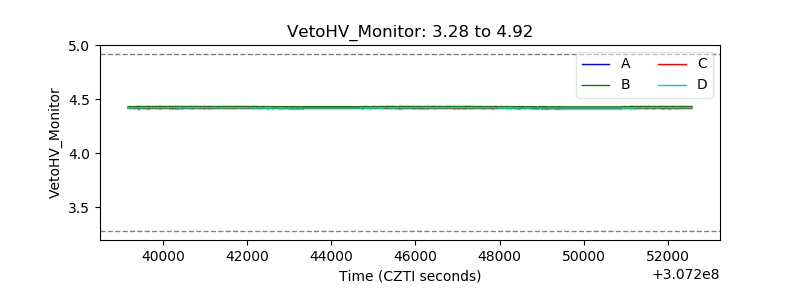 |
| Veto LLD | 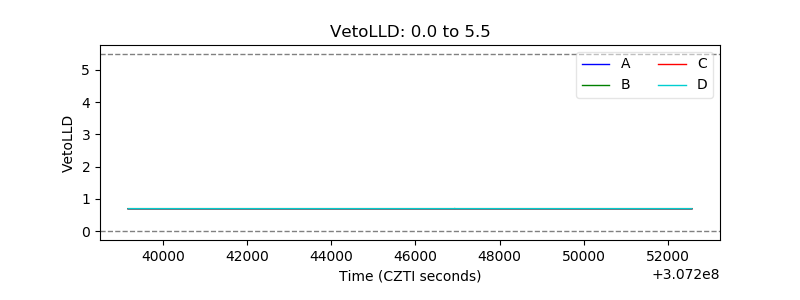 |
| Alpha Counter | 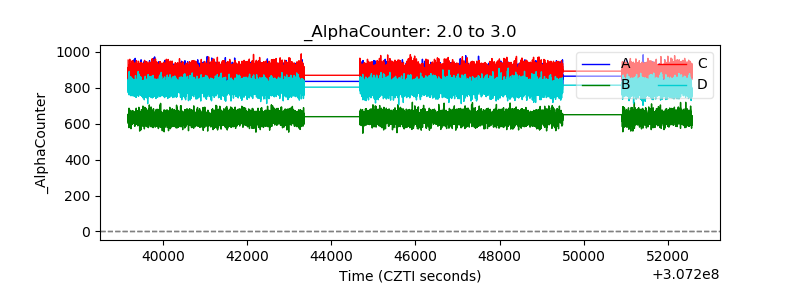 |
| _CPM_Rate | 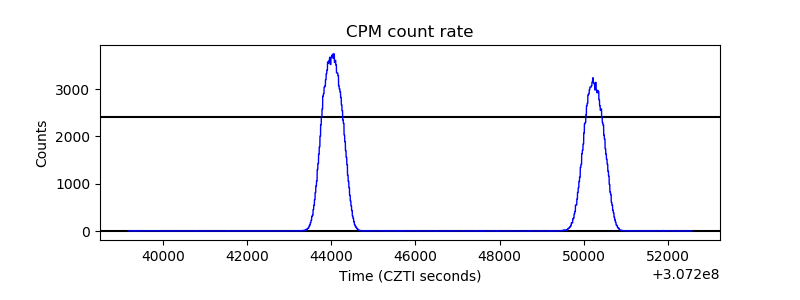 |
| CZT Counter |  |
| +2.5 Volts monitor |  |
| +5 Volts monitor | 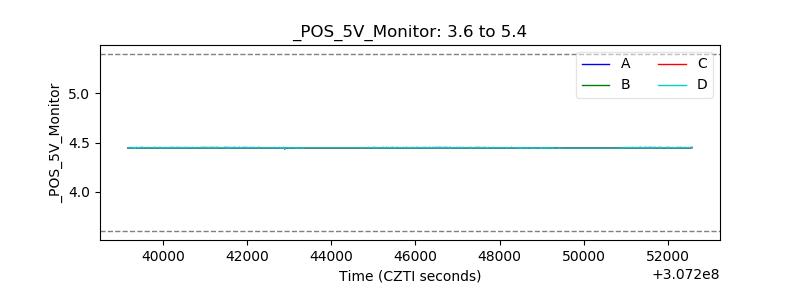 |
| _ROLL_ROT | 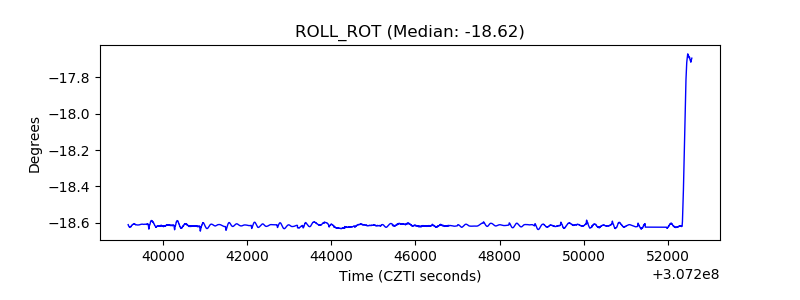 |
| _Roll_DEC | 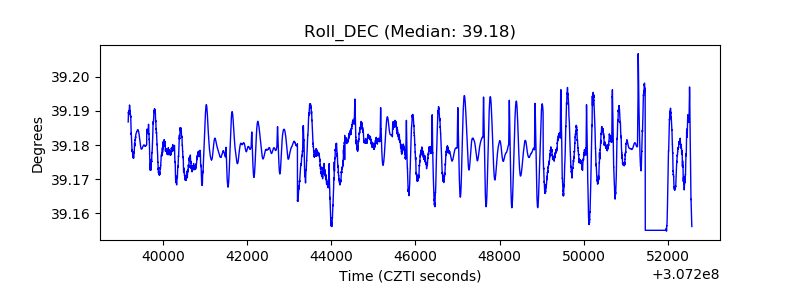 |
| _Roll_RA | 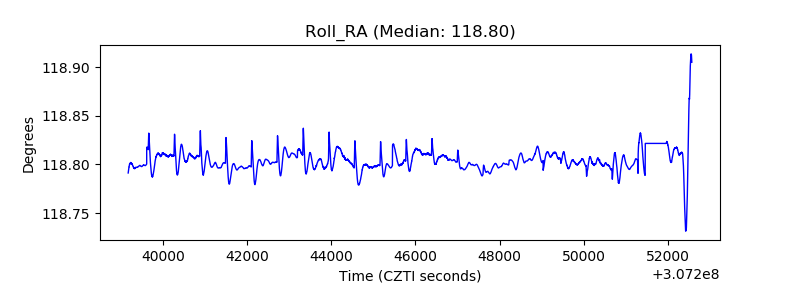 |
| Veto Counter | 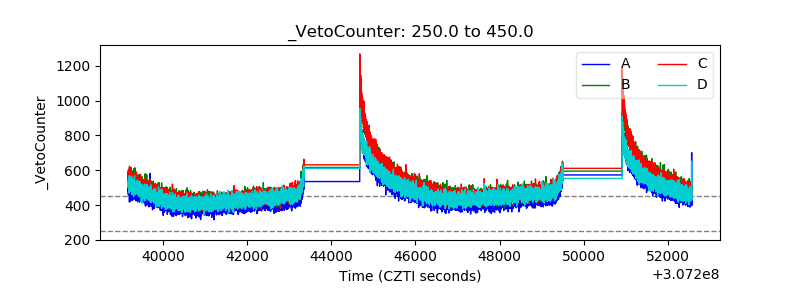 |