| Param | Original file | Final file |
|---|---|---|
| Filename | modeM0/AS1A05_094T01_9000003204_21612cztM0_level2.evt | modeM0/AS1A05_094T01_9000003204_21612cztM0_level2_quad_clean.evt |
| Size (bytes) | 777,058,560 | 142,490,880 |
| Size | 741.1 MB | 135.9 MB |
| Events in quadrant A | 5,051,494 | 914,115 |
| Events in quadrant B | 5,642,744 | 937,237 |
| Events in quadrant C | 5,076,877 | 895,656 |
| Events in quadrant D | 7,061,150 | 851,148 |
| Mode M0 | |||
|---|---|---|---|
| Quadrant | BADHDUFLAG | Total packets | Discarded packets |
| A | 0 | 21495 | 2 |
| B | 0 | 23336 | 2 |
| C | 0 | 21557 | 2 |
| D | 0 | 28103 | 2 |
| Mode M9 | |||
|---|---|---|---|
| Quadrant | BADHDUFLAG | Total packets | Discarded packets |
| A | 0 | 26 | 0 |
| B | 0 | 26 | 0 |
| C | 0 | 26 | 0 |
| D | 0 | 26 | 0 |
| Mode SS | |||
|---|---|---|---|
| Quadrant | BADHDUFLAG | Total packets | Discarded packets |
| A | 0 | 212 | 0 |
| B | 0 | 212 | 0 |
| C | 0 | 212 | 0 |
| D | 0 | 212 | 0 |
| Quadrant | Total seconds | Saturated seconds | Saturation percentage |
|---|---|---|---|
| A | 10354 | 55 | 0.531196% |
| B | 10355 | 233 | 2.250121% |
| C | 10355 | 124 | 1.197489% |
| D | 10355 | 338 | 3.264124% |
Noise dominated data is calculated using 1-second bins in cleaned event files. If a bin has >2000 counts, and if more than 50% of those come from <1% of pixels, then it is considered to be noise-dominated and hence unusable.
| Quadrant | # 1 sec bins | Bins with >0 counts | Bins with >2000 counts | High rate bins dominated by noise | Noise dominated (total time) | Noise dominated (detector-on time) | Marked lightcurve |
|---|---|---|---|---|---|---|---|
| A | 12994 | 10357 | 0 | 0 | 0.00% | 0.00% | 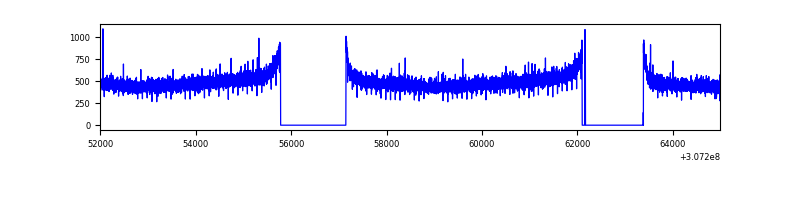 |
| B | 12995 | 10357 | 70 | 70 | 0.54% | 0.68% | 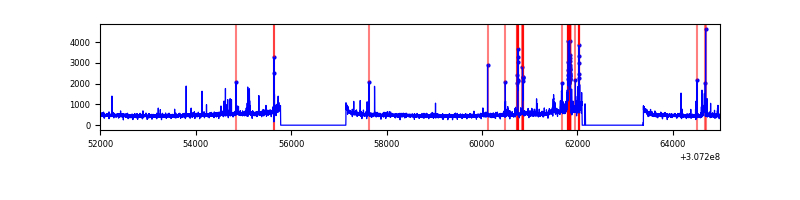 |
| C | 12995 | 10357 | 0 | 0 | 0.00% | 0.00% |  |
| D | 12995 | 10358 | 238 | 238 | 1.83% | 2.30% |  |
Top three noisy pixels from each quadrant. If the there are fewer than three noisy pixels in the level2.evt file, extra rows are filled as -1
| Pixel properties | Quadrant properties | ||||||
|---|---|---|---|---|---|---|---|
| Quadrant | DetID | PixID | Counts | Sigma | Mean | Median | Sigma |
| A | 13 | 254 | 14100 | 49.51 | 1310 | 1286 | 258.8 |
| A | 0 | 226 | 11422 | 39.16 | 1310 | 1286 | 258.8 |
| A | 3 | 137 | 10528 | 35.71 | 1310 | 1286 | 258.8 |
| B | 3 | 64 | 456895 | 1903.72 | 1300 | 1273 | 239.3 |
| B | 0 | 190 | 35470 | 142.89 | 1300 | 1273 | 239.3 |
| B | 12 | 111 | 28315 | 112.99 | 1300 | 1273 | 239.3 |
| C | 14 | 238 | 200802 | 691.29 | 1250 | 1257 | 288.7 |
| C | 13 | 61 | 8838 | 26.26 | 1250 | 1257 | 288.7 |
| C | 9 | 54 | 3305 | 7.09 | 1250 | 1257 | 288.7 |
| D | 1 | 52 | 1379607 | 4593.85 | 1247 | 1213 | 300.1 |
| D | 7 | 238 | 306193 | 1016.42 | 1247 | 1213 | 300.1 |
| D | 14 | 35 | 243372 | 807.06 | 1247 | 1213 | 300.1 |
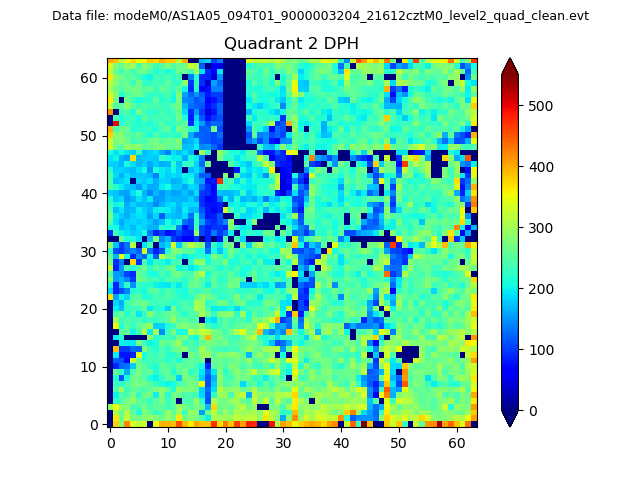
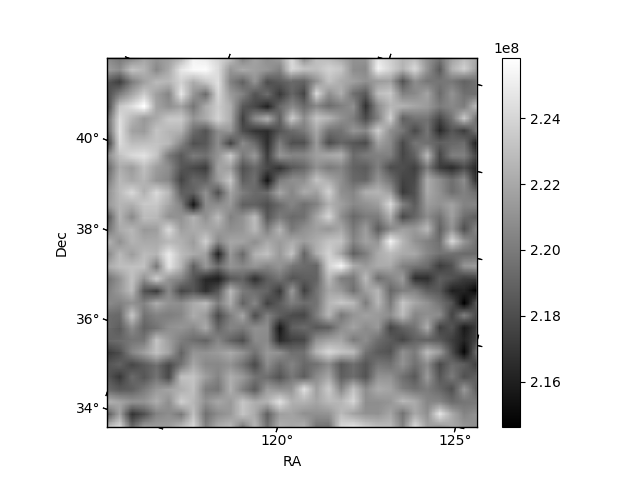
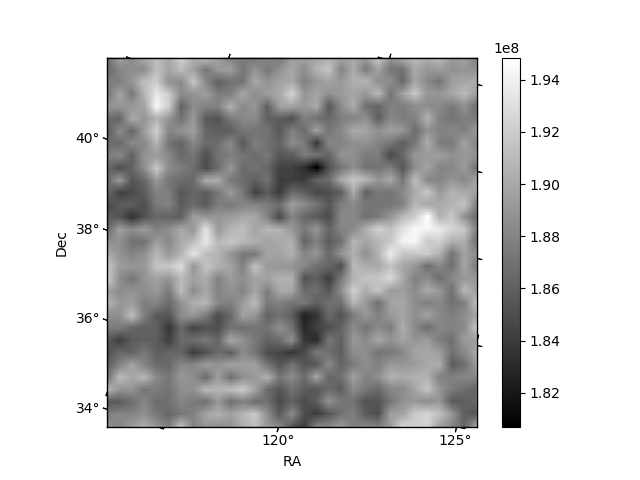
Histogram calculated using DETX and DETY for each event in the final _common_clean file
| Quadrant A | 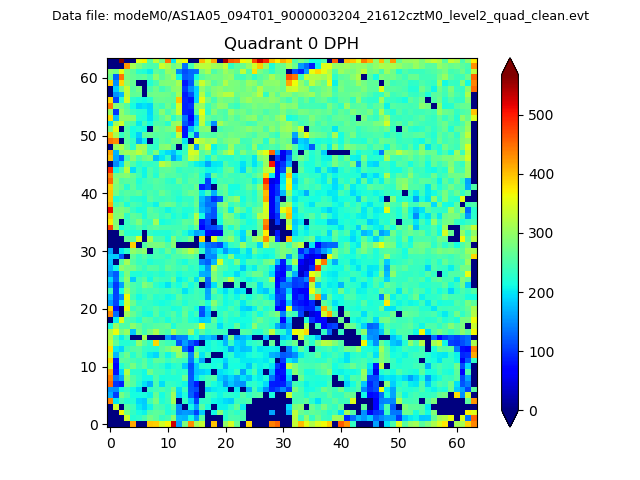 |
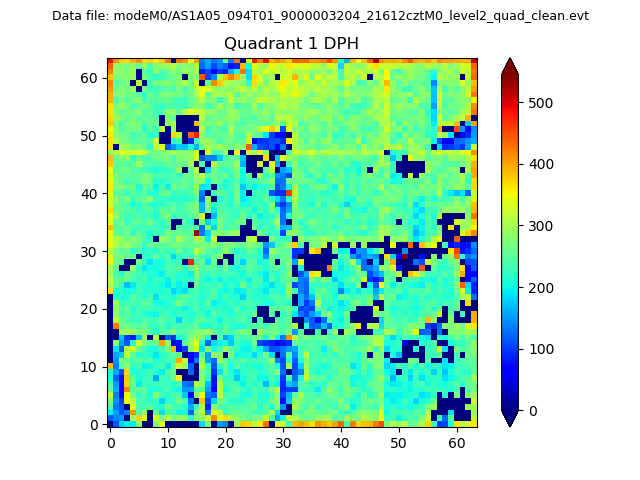 |
Quadrant B |
|---|---|---|---|
| Quadrant D | 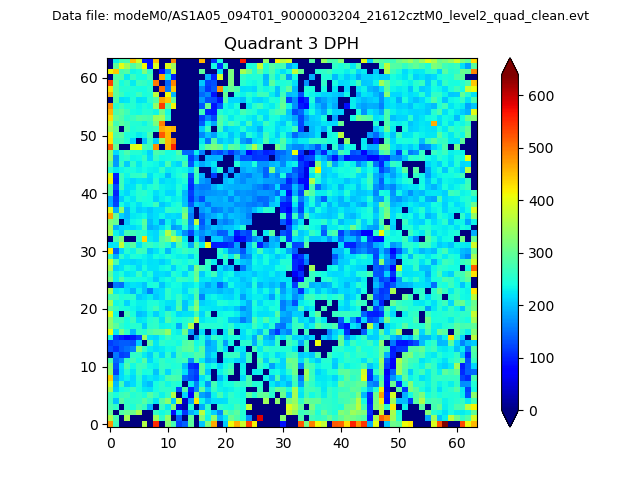 |
 |
Quadrant C |
| Plot type | Count rate plots | Images |
|---|---|---|
| Comparison with Poisson distribution Blue bars denote a histogram of data divided into 1 sec bins. Red curve is a Poisson curve with rate = median count rate of data. |
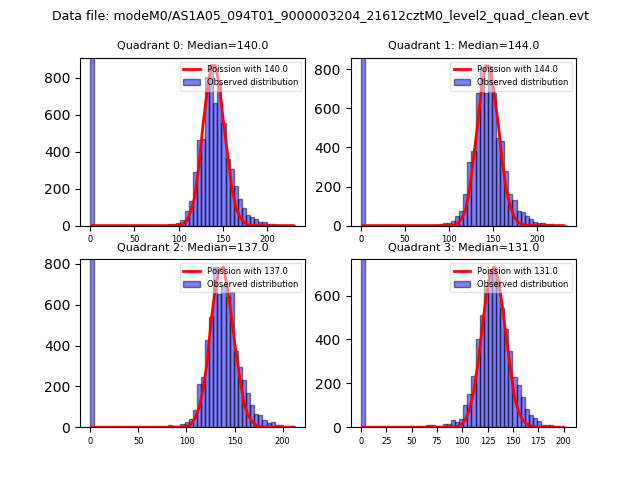 |
 |
| Quadrant-wise count rates Data is divided into 100 sec bins |
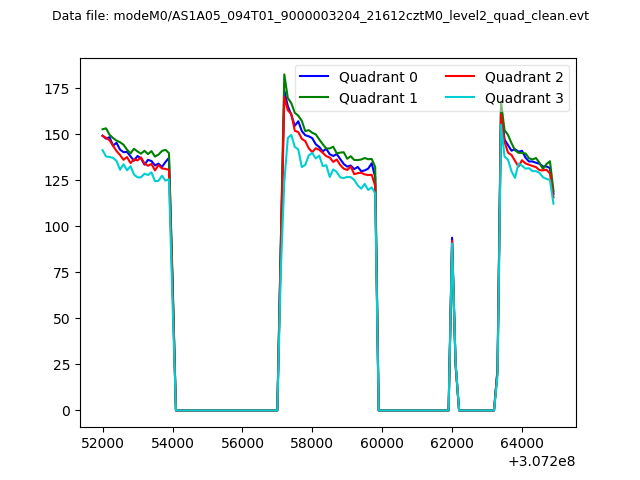 |
|
| Module-wise count rates for Quadrant A Data is divided into 100 sec bins |
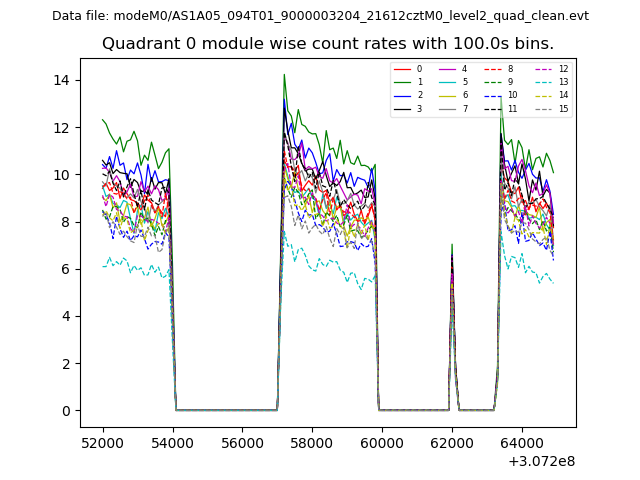 |
 |
| Module-wise count rates for Quadrant B Data is divided into 100 sec bins |
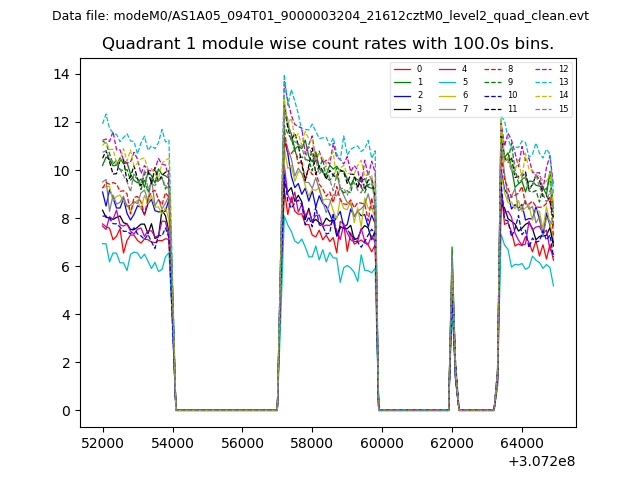 |
 |
| Module-wise count rates for Quadrant C Data is divided into 100 sec bins |
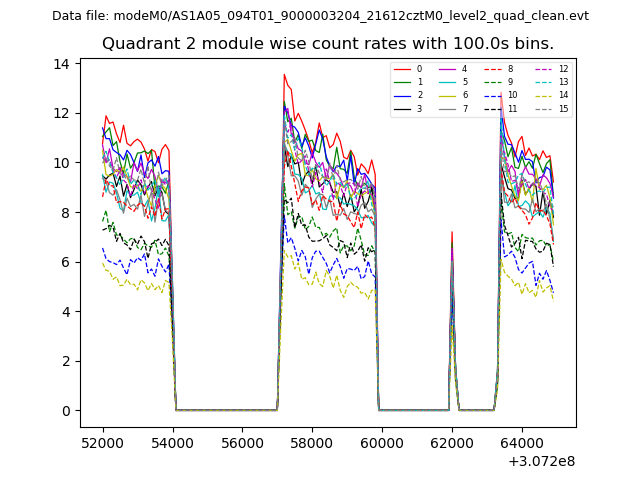 |
 |
| Module-wise count rates for Quadrant D Data is divided into 100 sec bins |
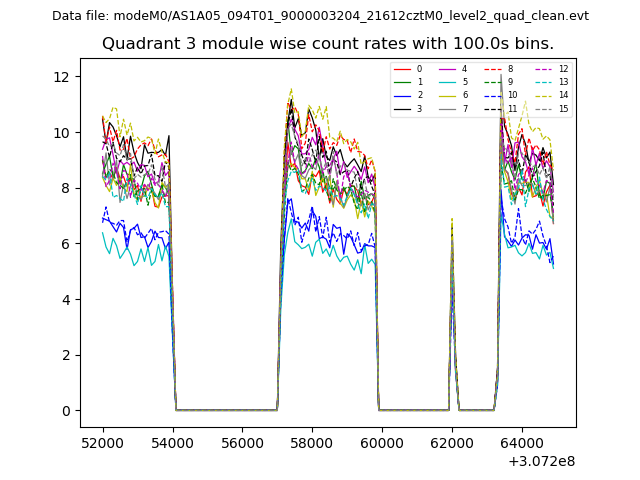 |
 |
| Parameter | Plot |
|---|---|
| CZT HV Monitor | 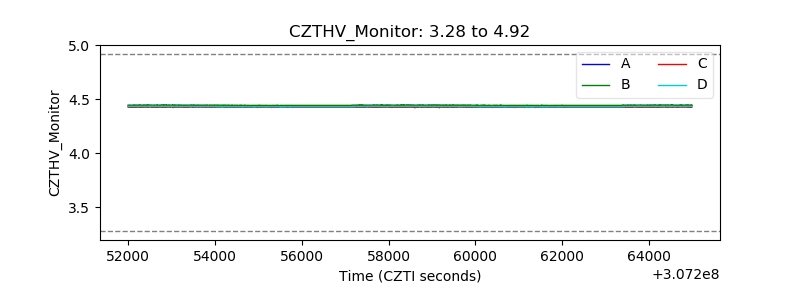 |
| D_VDD | 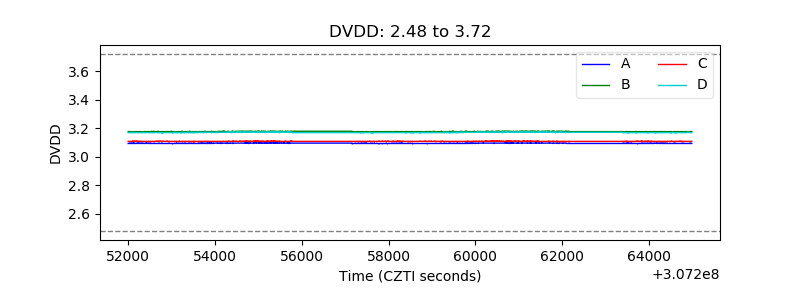 |
| Temperature 1 | 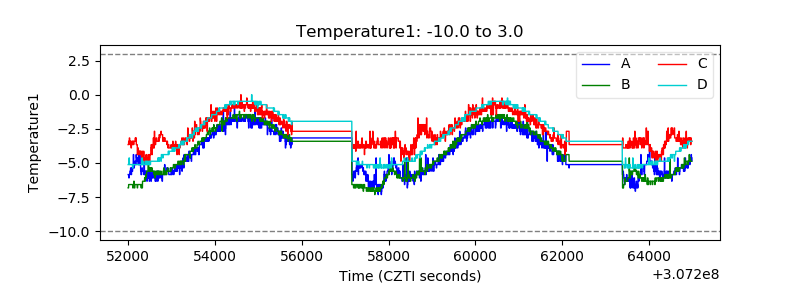 |
| Veto HV Monitor | 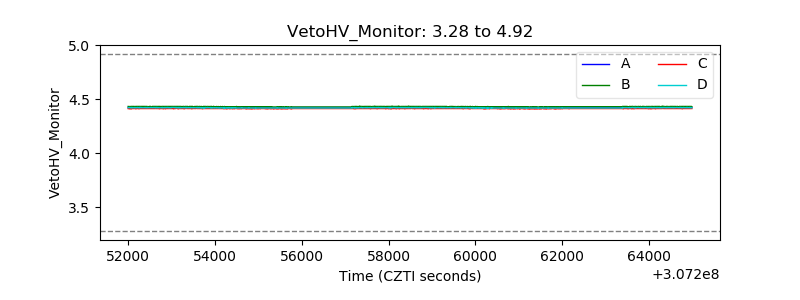 |
| Veto LLD | 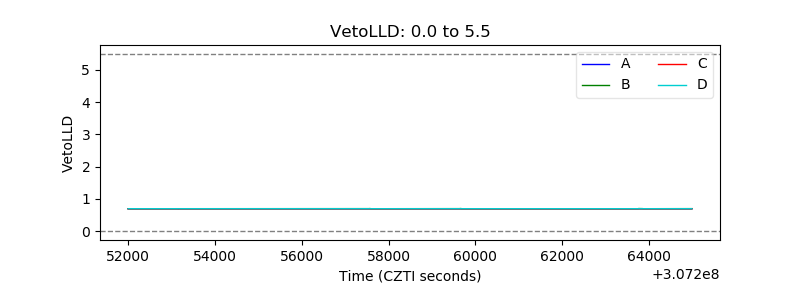 |
| Alpha Counter | 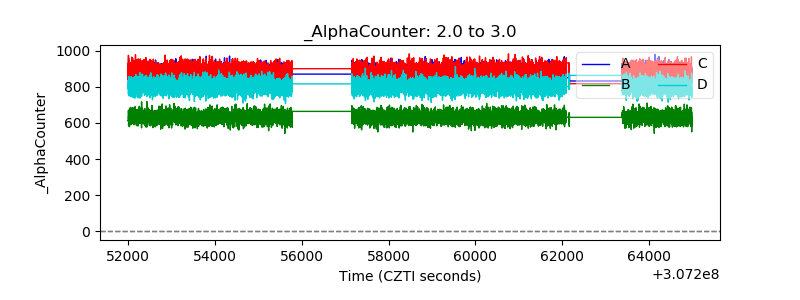 |
| _CPM_Rate | 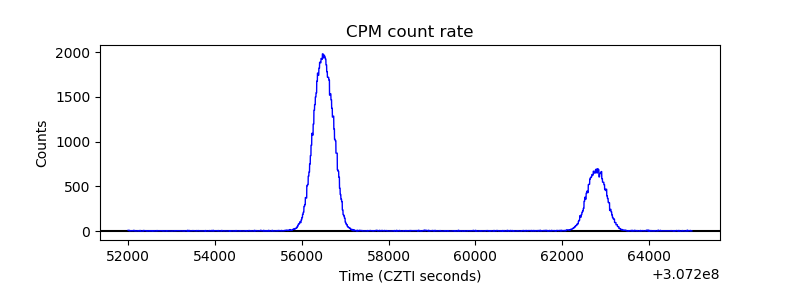 |
| CZT Counter | 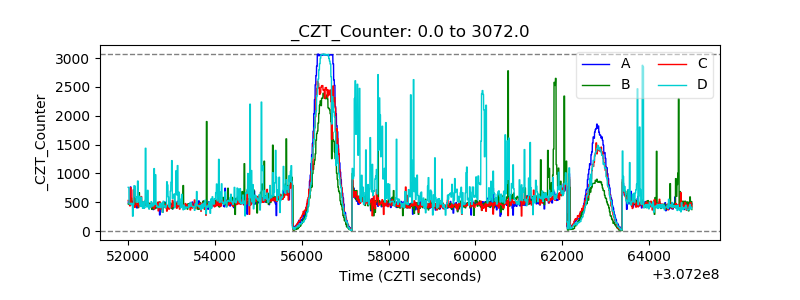 |
| +2.5 Volts monitor |  |
| +5 Volts monitor | 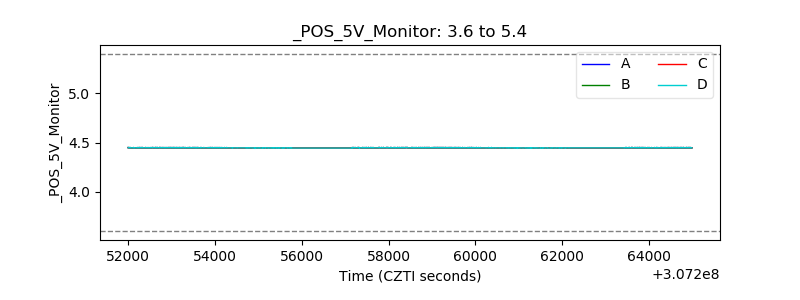 |
| _ROLL_ROT | 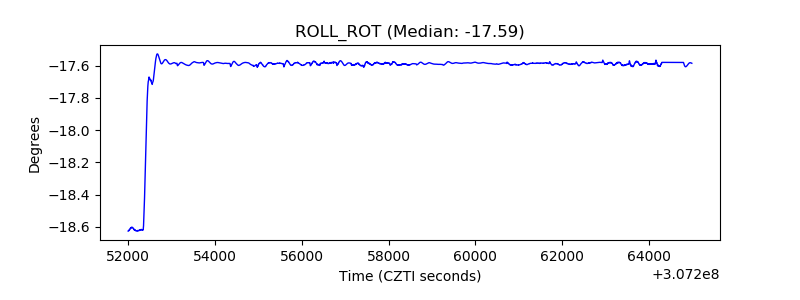 |
| _Roll_DEC | 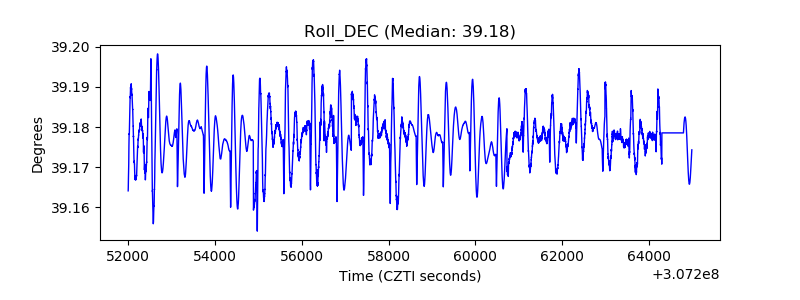 |
| _Roll_RA | 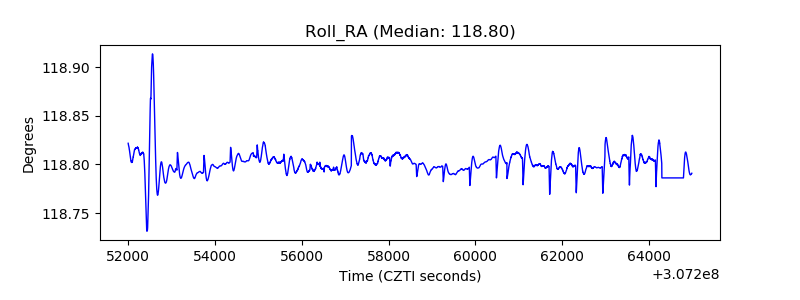 |
| Veto Counter | 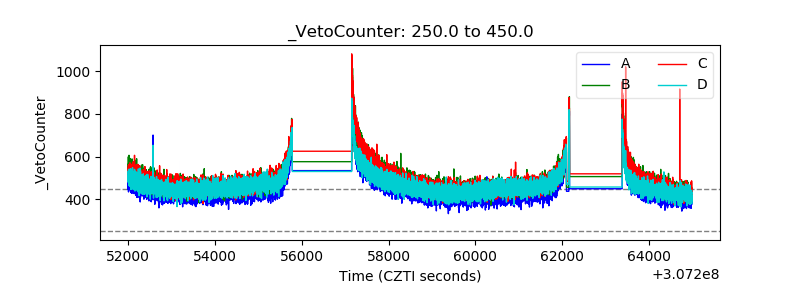 |