| Param | Original file | Final file |
|---|---|---|
| Filename | modeM0/AS1A05_094T01_9000003204_21614cztM0_level2.evt | modeM0/AS1A05_094T01_9000003204_21614cztM0_level2_quad_clean.evt |
| Size (bytes) | 471,548,160 | 95,621,760 |
| Size | 449.7 MB | 91.2 MB |
| Events in quadrant A | 3,248,613 | 610,290 |
| Events in quadrant B | 3,422,820 | 621,196 |
| Events in quadrant C | 3,247,935 | 599,214 |
| Events in quadrant D | 3,891,321 | 583,408 |
| Mode M0 | |||
|---|---|---|---|
| Quadrant | BADHDUFLAG | Total packets | Discarded packets |
| A | 0 | 14153 | 1 |
| B | 0 | 14518 | 1 |
| C | 0 | 14146 | 1 |
| D | 0 | 16221 | 1 |
| Mode M9 | |||
|---|---|---|---|
| Quadrant | BADHDUFLAG | Total packets | Discarded packets |
| A | 0 | 4 | 0 |
| B | 0 | 4 | 0 |
| C | 0 | 4 | 0 |
| D | 0 | 4 | 0 |
| Mode SS | |||
|---|---|---|---|
| Quadrant | BADHDUFLAG | Total packets | Discarded packets |
| A | 0 | 140 | 0 |
| B | 0 | 140 | 0 |
| C | 0 | 140 | 0 |
| D | 0 | 140 | 0 |
| Quadrant | Total seconds | Saturated seconds | Saturation percentage |
|---|---|---|---|
| A | 6915 | 132 | 1.908894% |
| B | 6916 | 130 | 1.879699% |
| C | 6916 | 134 | 1.937536% |
| D | 6916 | 205 | 2.964141% |
Noise dominated data is calculated using 1-second bins in cleaned event files. If a bin has >2000 counts, and if more than 50% of those come from <1% of pixels, then it is considered to be noise-dominated and hence unusable.
| Quadrant | # 1 sec bins | Bins with >0 counts | Bins with >2000 counts | High rate bins dominated by noise | Noise dominated (total time) | Noise dominated (detector-on time) | Marked lightcurve |
|---|---|---|---|---|---|---|---|
| A | 7320 | 6916 | 0 | 0 | 0.00% | 0.00% | 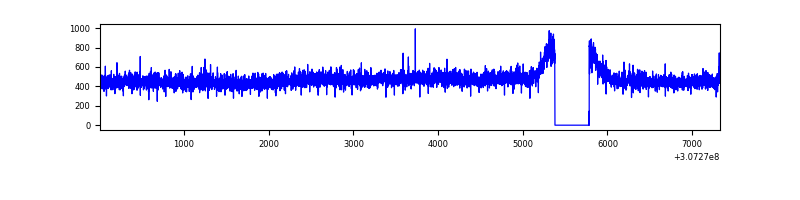 |
| B | 7321 | 6916 | 8 | 8 | 0.11% | 0.12% | 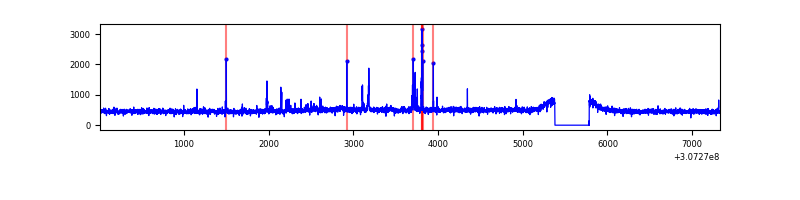 |
| C | 7321 | 6916 | 0 | 0 | 0.00% | 0.00% |  |
| D | 7321 | 6917 | 85 | 85 | 1.16% | 1.23% | 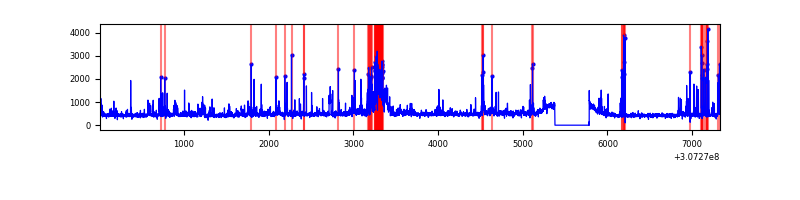 |
Top three noisy pixels from each quadrant. If the there are fewer than three noisy pixels in the level2.evt file, extra rows are filled as -1
| Pixel properties | Quadrant properties | ||||||
|---|---|---|---|---|---|---|---|
| Quadrant | DetID | PixID | Counts | Sigma | Mean | Median | Sigma |
| A | 15 | 236 | 31372 | 181.58 | 835 | 817 | 168.3 |
| A | 13 | 254 | 10406 | 56.98 | 835 | 817 | 168.3 |
| A | 0 | 226 | 7303 | 38.54 | 835 | 817 | 168.3 |
| B | 3 | 64 | 65395 | 405.84 | 830 | 809 | 159.1 |
| B | 0 | 190 | 39018 | 240.09 | 830 | 809 | 159.1 |
| B | 0 | 219 | 23099 | 140.06 | 830 | 809 | 159.1 |
| C | 14 | 238 | 123719 | 655.36 | 798 | 802 | 187.6 |
| C | 13 | 61 | 6034 | 27.89 | 798 | 802 | 187.6 |
| C | 8 | 128 | 4643 | 20.48 | 798 | 802 | 187.6 |
| D | 13 | 172 | 269840 | 1371.68 | 807 | 780 | 196.2 |
| D | 1 | 52 | 160628 | 814.91 | 807 | 780 | 196.2 |
| D | 13 | 104 | 143893 | 729.6 | 807 | 780 | 196.2 |
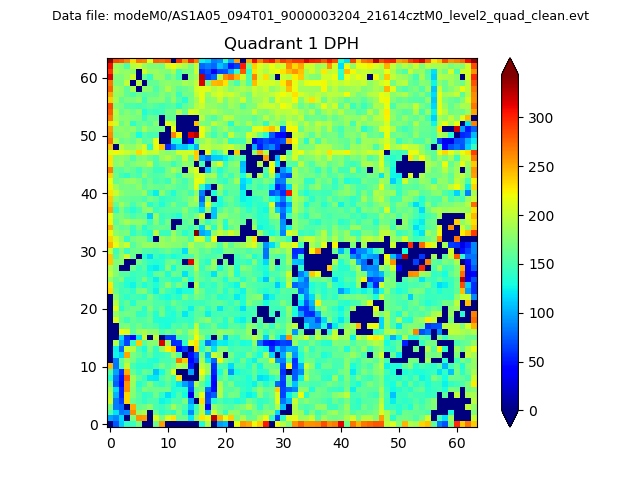
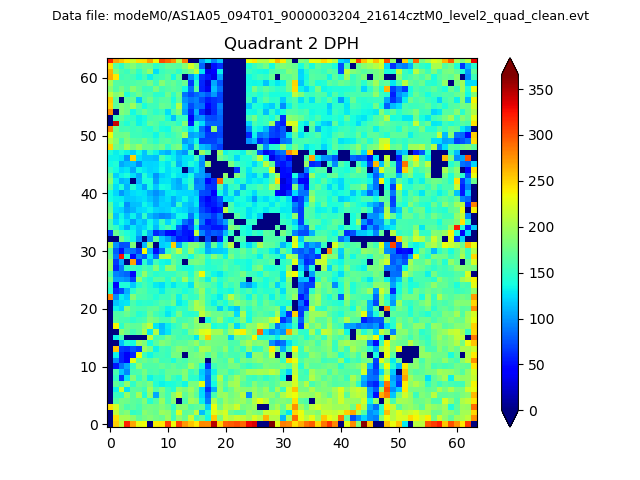
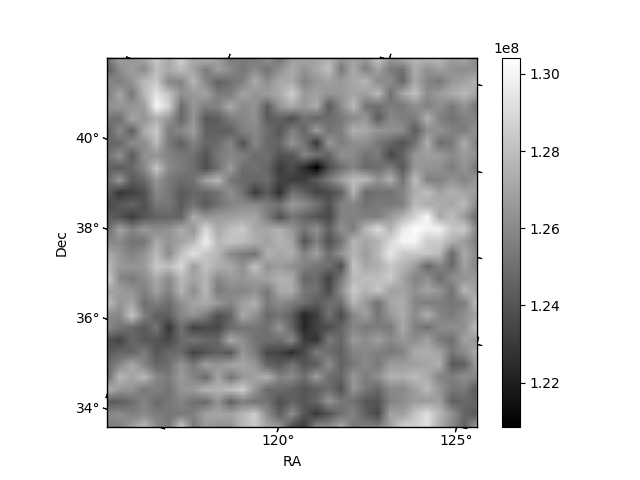
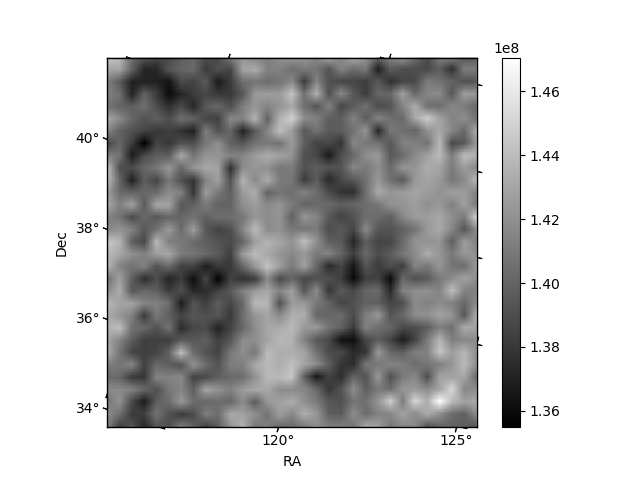
Histogram calculated using DETX and DETY for each event in the final _common_clean file
| Quadrant A | 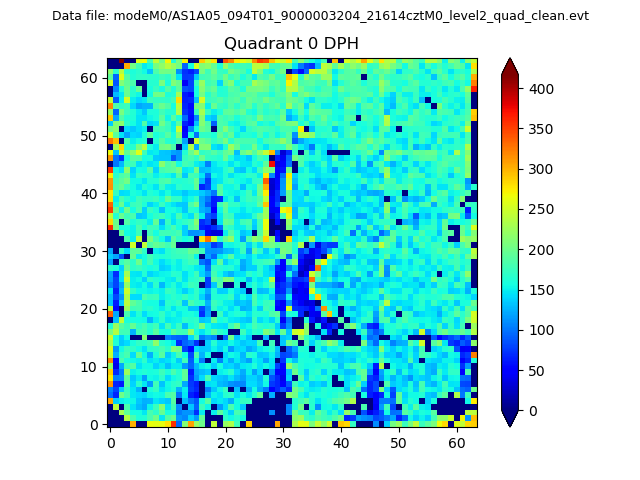 |
 |
Quadrant B |
|---|---|---|---|
| Quadrant D |  |
 |
Quadrant C |
| Plot type | Count rate plots | Images |
|---|---|---|
| Comparison with Poisson distribution Blue bars denote a histogram of data divided into 1 sec bins. Red curve is a Poisson curve with rate = median count rate of data. |
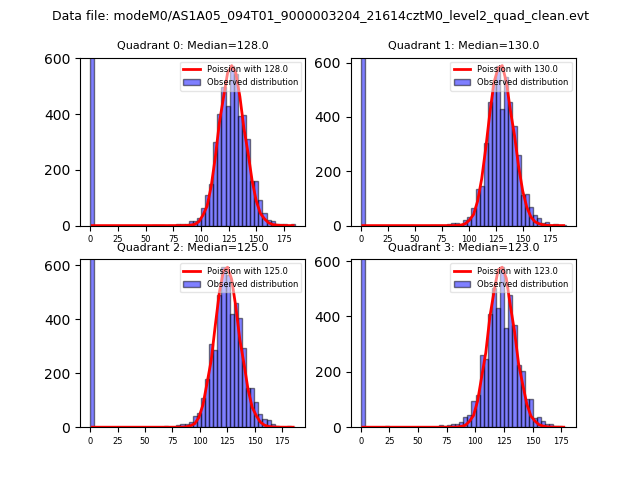 |
 |
| Quadrant-wise count rates Data is divided into 100 sec bins |
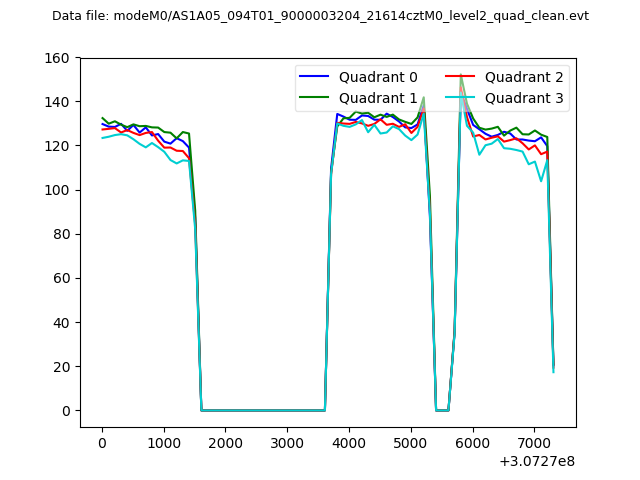 |
|
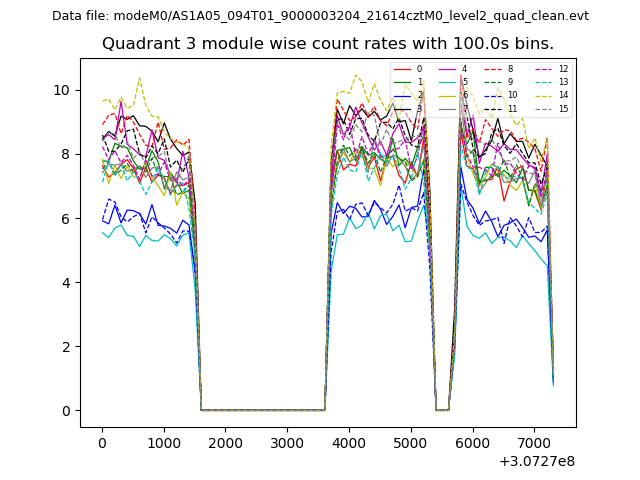
| Module-wise count rates for Quadrant A Data is divided into 100 sec bins |
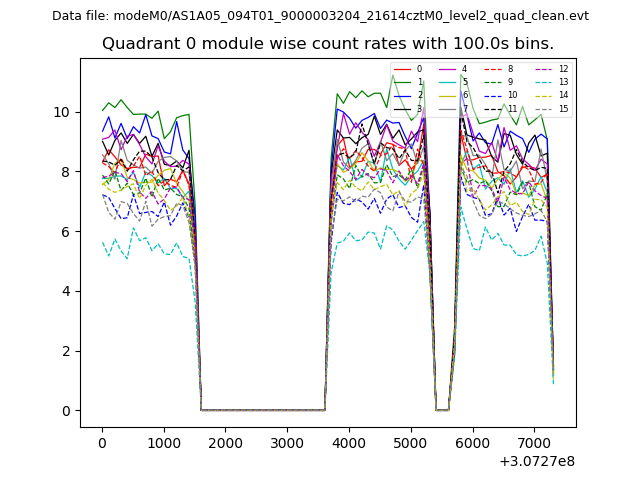 |
 |
| Module-wise count rates for Quadrant B Data is divided into 100 sec bins |
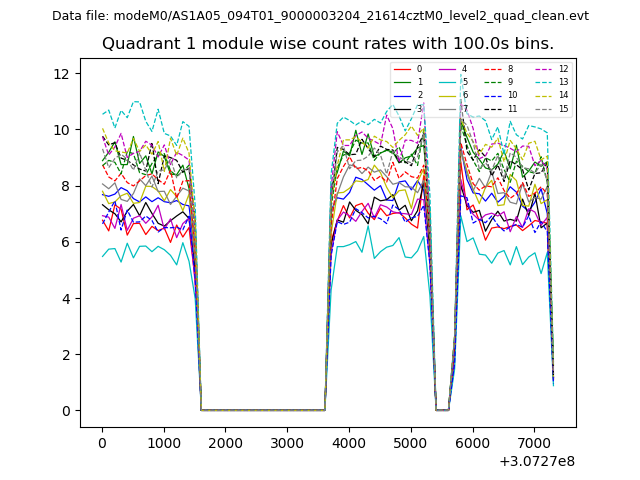 |
 |
| Module-wise count rates for Quadrant C Data is divided into 100 sec bins |
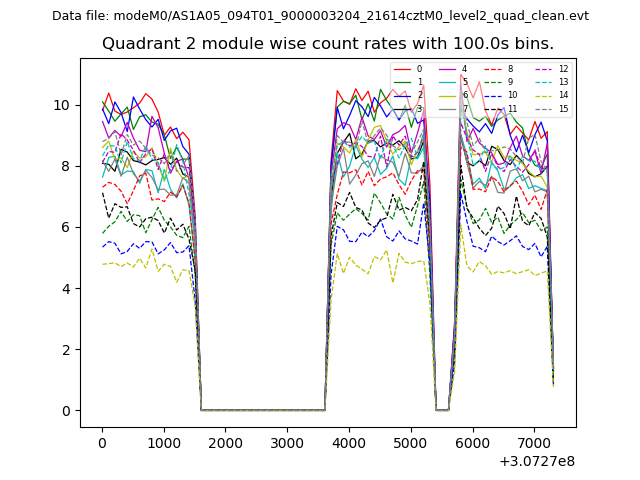 |
 |
| Module-wise count rates for Quadrant D Data is divided into 100 sec bins |
 |
 |
| Parameter | Plot |
|---|---|
| CZT HV Monitor | 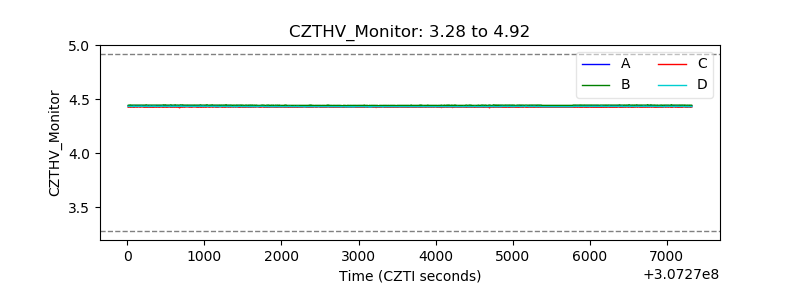 |
| D_VDD | 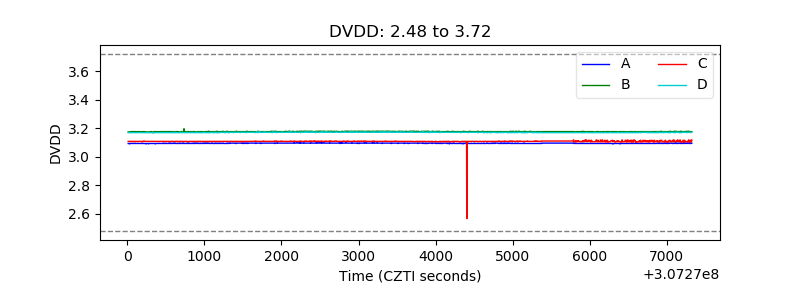 |
| Temperature 1 | 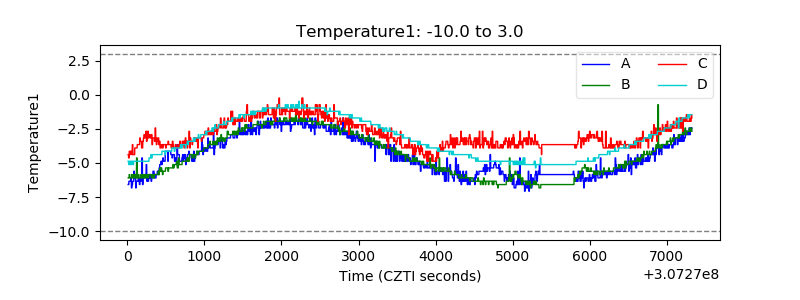 |
| Veto HV Monitor | 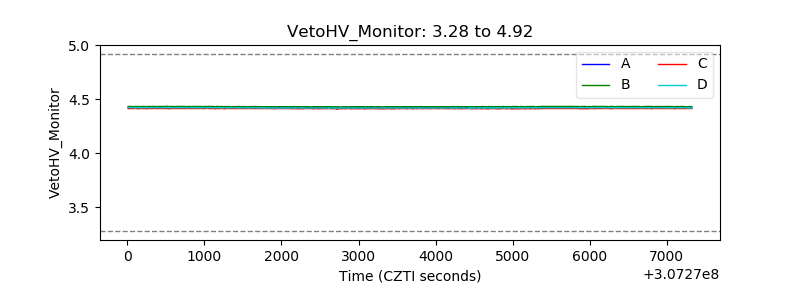 |
| Veto LLD | 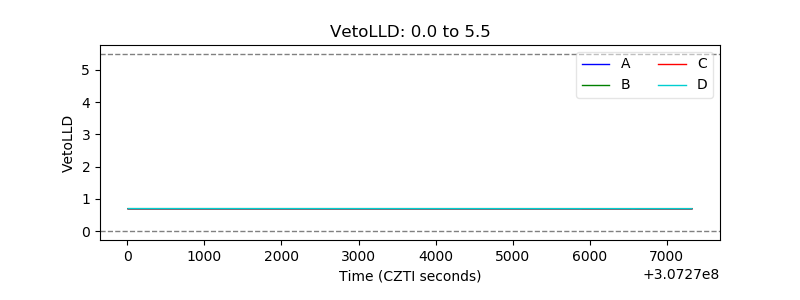 |
| Alpha Counter | 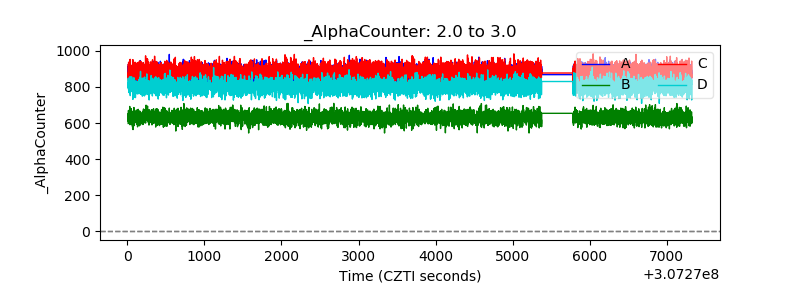 |
| _CPM_Rate | 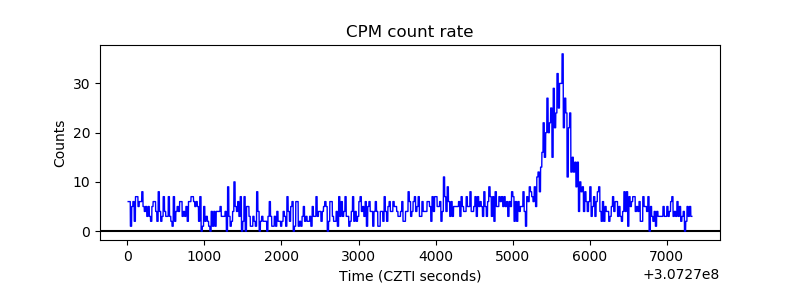 |
| CZT Counter |  |
| +2.5 Volts monitor |  |
| +5 Volts monitor | 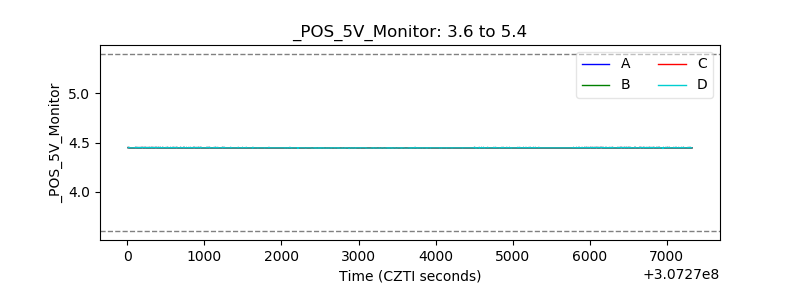 |
| _ROLL_ROT | 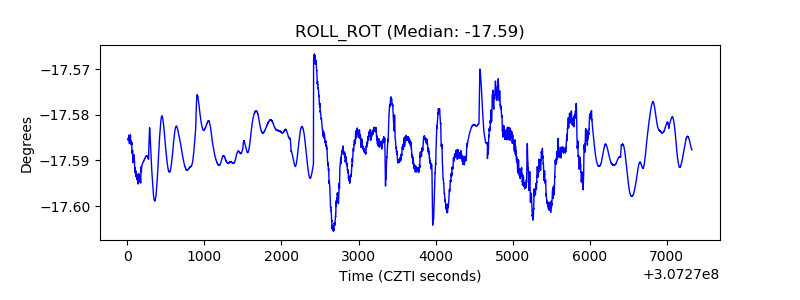 |
| _Roll_DEC | 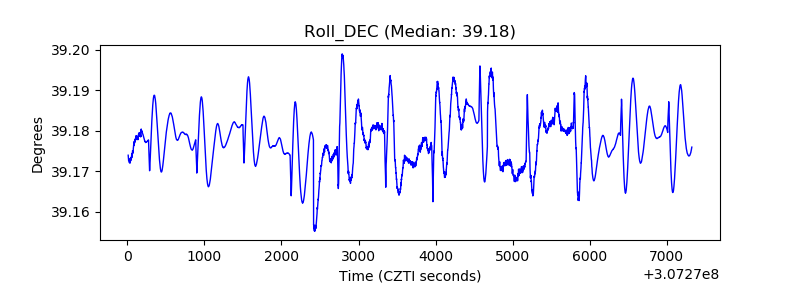 |
| _Roll_RA | 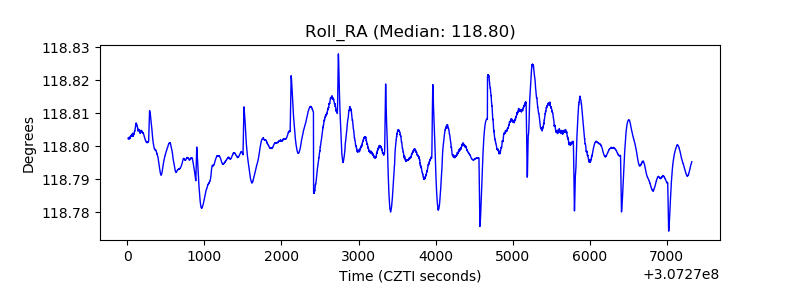 |
| Veto Counter | 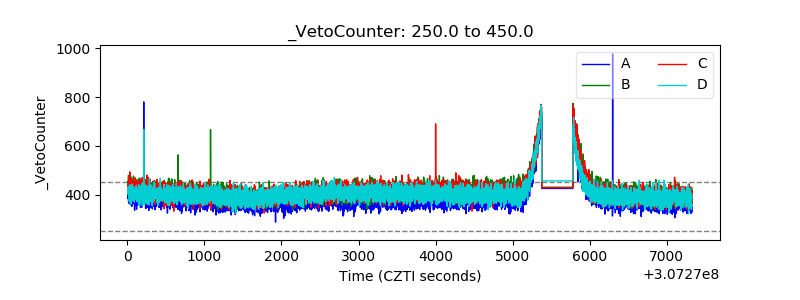 |