| Param | Original file | Final file |
|---|---|---|
| Filename | modeM0/AS1A05_094T01_9000003204_21618cztM0_level2.evt | modeM0/AS1A05_094T01_9000003204_21618cztM0_level2_quad_clean.evt |
| Size (bytes) | 652,345,920 | 106,600,320 |
| Size | 622.1 MB | 101.7 MB |
| Events in quadrant A | 4,593,430 | 651,239 |
| Events in quadrant B | 4,630,175 | 655,252 |
| Events in quadrant C | 4,620,930 | 637,618 |
| Events in quadrant D | 5,266,650 | 624,188 |
| Mode M0 | |||
|---|---|---|---|
| Quadrant | BADHDUFLAG | Total packets | Discarded packets |
| A | 0 | 19814 | 2 |
| B | 0 | 19726 | 2 |
| C | 0 | 19856 | 2 |
| D | 0 | 22047 | 2 |
| Mode M9 | |||
|---|---|---|---|
| Quadrant | BADHDUFLAG | Total packets | Discarded packets |
| A | 0 | 5 | 0 |
| B | 0 | 6 | 0 |
| C | 0 | 6 | 0 |
| D | 0 | 6 | 0 |
| Mode SS | |||
|---|---|---|---|
| Quadrant | BADHDUFLAG | Total packets | Discarded packets |
| A | 0 | 192 | 0 |
| B | 0 | 192 | 0 |
| C | 0 | 192 | 0 |
| D | 0 | 192 | 0 |
| Quadrant | Total seconds | Saturated seconds | Saturation percentage |
|---|---|---|---|
| A | 9515 | 75 | 0.788229% |
| B | 9515 | 79 | 0.830268% |
| C | 9515 | 145 | 1.523910% |
| D | 9515 | 199 | 2.091435% |
Noise dominated data is calculated using 1-second bins in cleaned event files. If a bin has >2000 counts, and if more than 50% of those come from <1% of pixels, then it is considered to be noise-dominated and hence unusable.
| Quadrant | # 1 sec bins | Bins with >0 counts | Bins with >2000 counts | High rate bins dominated by noise | Noise dominated (total time) | Noise dominated (detector-on time) | Marked lightcurve |
|---|---|---|---|---|---|---|---|
| A | 9985 | 9516 | 0 | 0 | 0.00% | 0.00% | 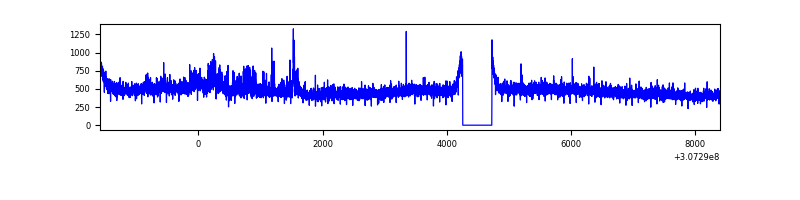 |
| B | 9985 | 9516 | 2 | 2 | 0.02% | 0.02% | 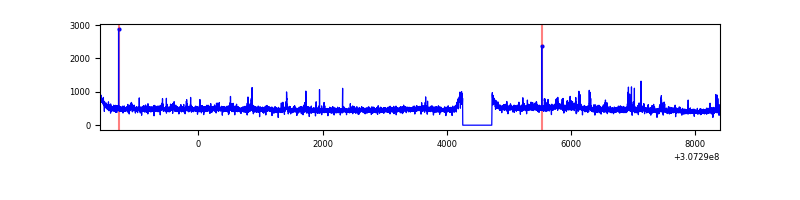 |
| C | 9985 | 9516 | 17 | 17 | 0.17% | 0.18% | 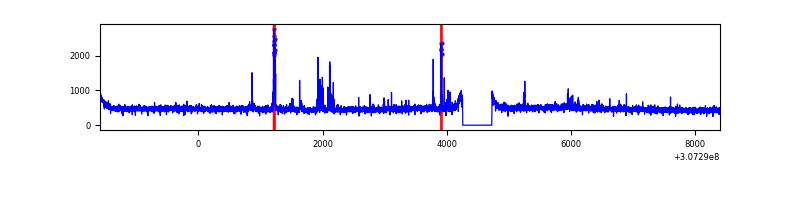 |
| D | 9985 | 9516 | 105 | 105 | 1.05% | 1.10% | 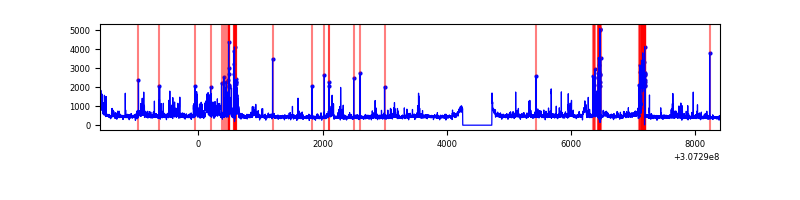 |
Top three noisy pixels from each quadrant. If the there are fewer than three noisy pixels in the level2.evt file, extra rows are filled as -1
| Pixel properties | Quadrant properties | ||||||
|---|---|---|---|---|---|---|---|
| Quadrant | DetID | PixID | Counts | Sigma | Mean | Median | Sigma |
| A | 15 | 236 | 212332 | 920.27 | 1136 | 1111 | 229.5 |
| A | 13 | 254 | 12115 | 47.94 | 1136 | 1111 | 229.5 |
| A | 3 | 137 | 9757 | 37.67 | 1136 | 1111 | 229.5 |
| B | 0 | 190 | 51864 | 233.61 | 1130 | 1100 | 217.3 |
| B | 3 | 64 | 36467 | 162.76 | 1130 | 1100 | 217.3 |
| B | 0 | 219 | 29519 | 130.78 | 1130 | 1100 | 217.3 |
| C | 9 | 54 | 192537 | 746.34 | 1091 | 1098 | 256.5 |
| C | 14 | 238 | 170277 | 659.56 | 1091 | 1098 | 256.5 |
| C | 13 | 61 | 7518 | 25.03 | 1091 | 1098 | 256.5 |
| D | 1 | 52 | 354795 | 1321.44 | 1101 | 1071 | 267.7 |
| D | 7 | 38 | 301672 | 1122.99 | 1101 | 1071 | 267.7 |
| D | 2 | 136 | 160056 | 593.94 | 1101 | 1071 | 267.7 |
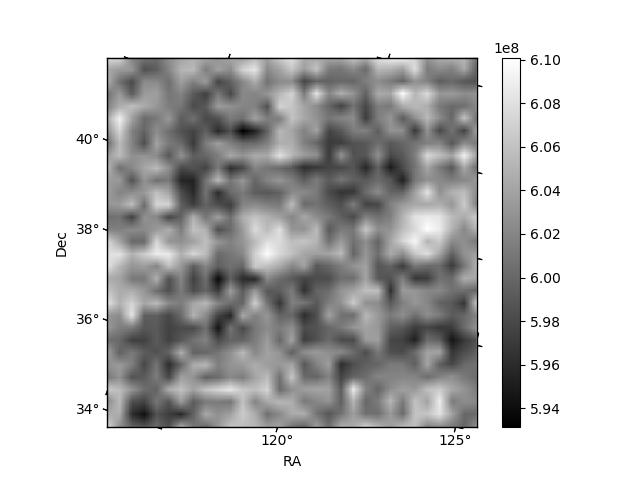
Histogram calculated using DETX and DETY for each event in the final _common_clean file
| Quadrant A | 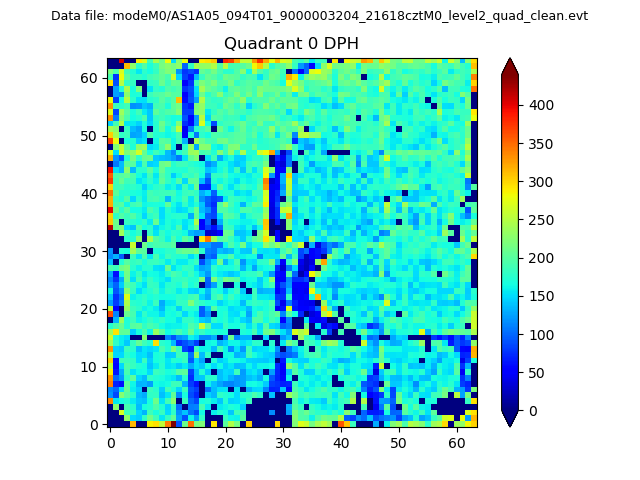 |
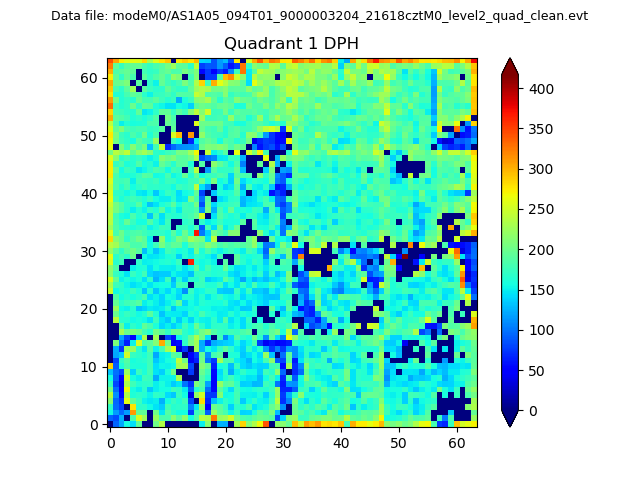 |
Quadrant B |
|---|---|---|---|
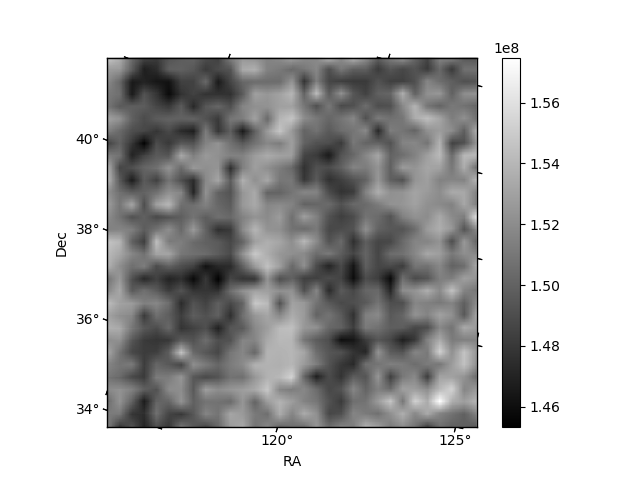
| Quadrant D |  |
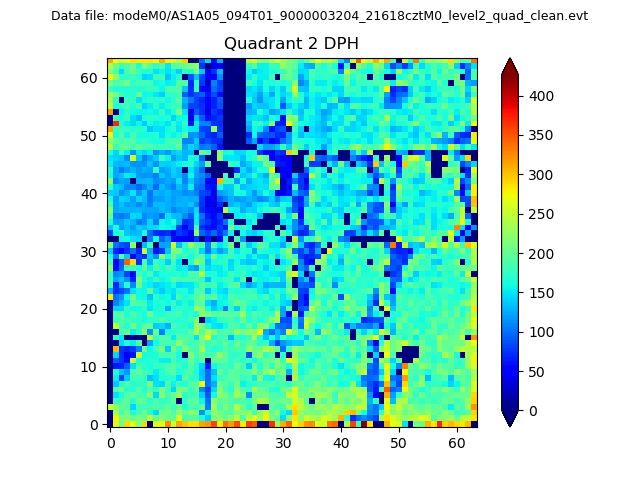 |
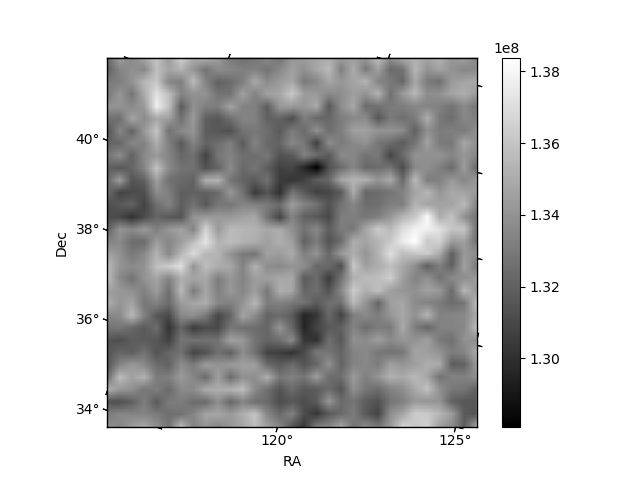
Quadrant C |
| Plot type | Count rate plots | Images |
|---|---|---|
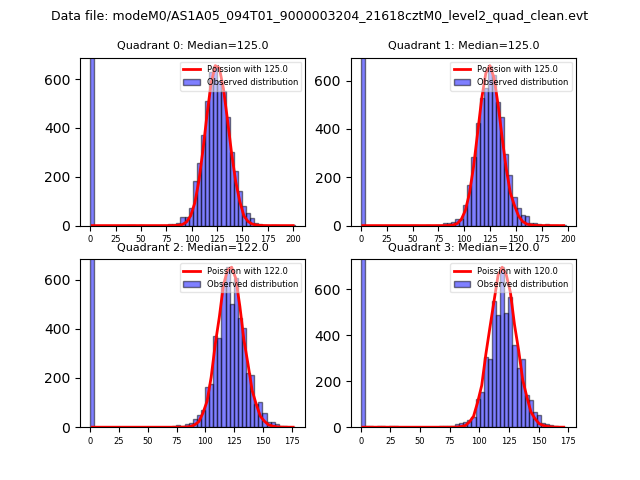
| Comparison with Poisson distribution Blue bars denote a histogram of data divided into 1 sec bins. Red curve is a Poisson curve with rate = median count rate of data. |
 |
 |
| Quadrant-wise count rates Data is divided into 100 sec bins |
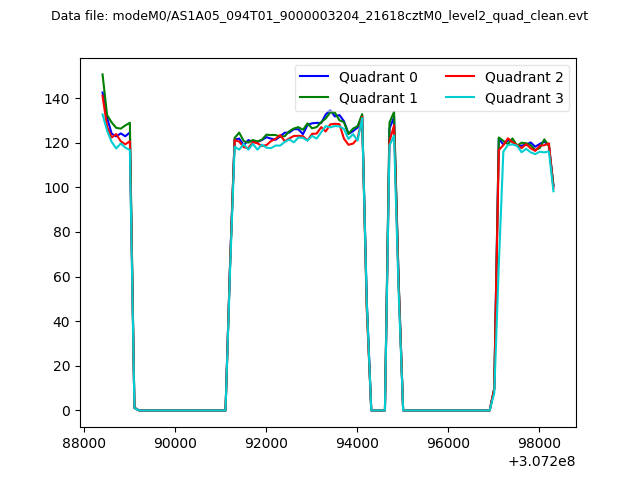 |
|
| Module-wise count rates for Quadrant A Data is divided into 100 sec bins |
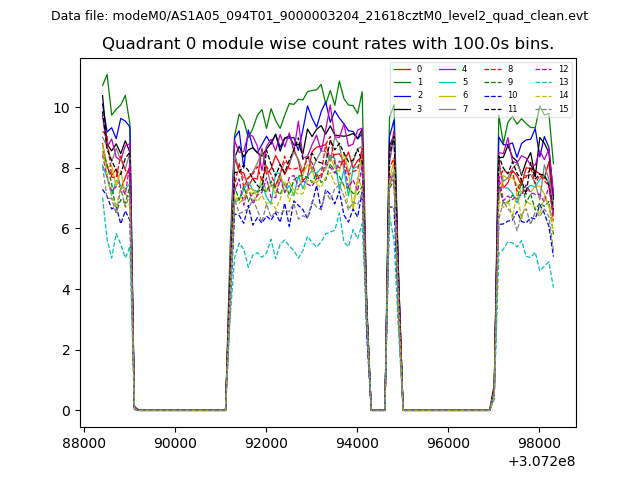 |
 |
| Module-wise count rates for Quadrant B Data is divided into 100 sec bins |
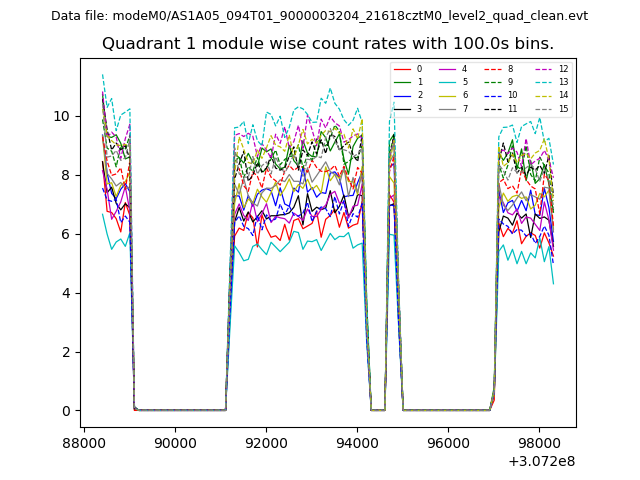 |
 |
| Module-wise count rates for Quadrant C Data is divided into 100 sec bins |
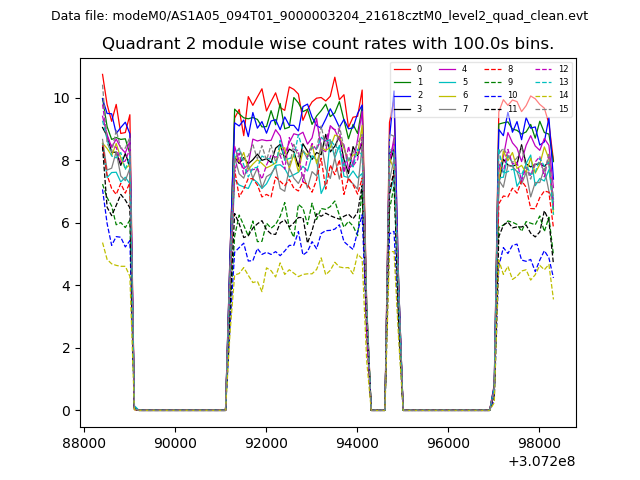 |
 |
| Module-wise count rates for Quadrant D Data is divided into 100 sec bins |
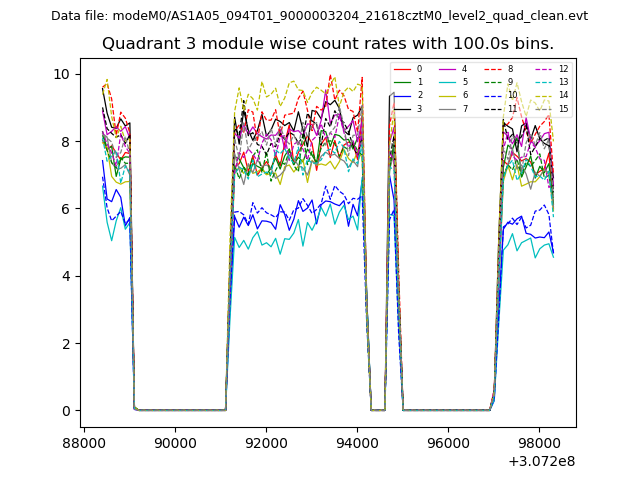 |
 |
| Parameter | Plot |
|---|---|
| CZT HV Monitor | 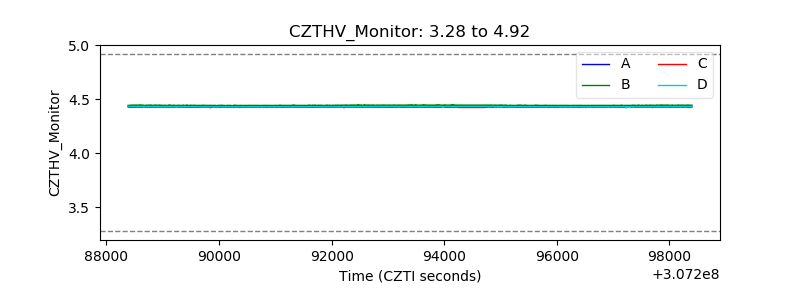 |
| D_VDD | 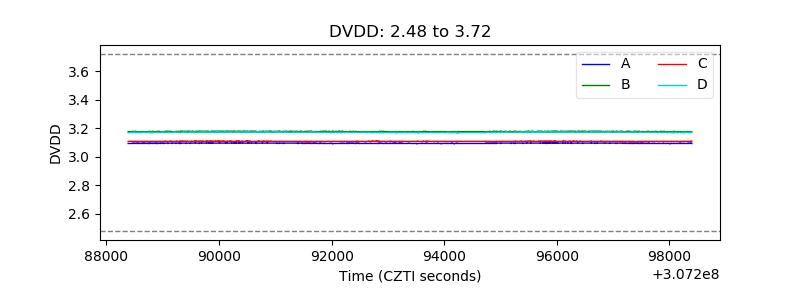 |
| Temperature 1 | 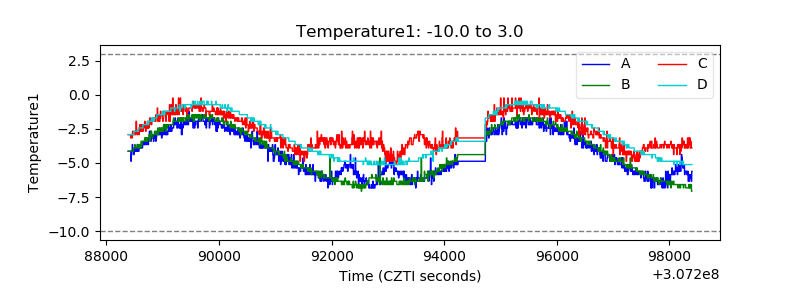 |
| Veto HV Monitor | 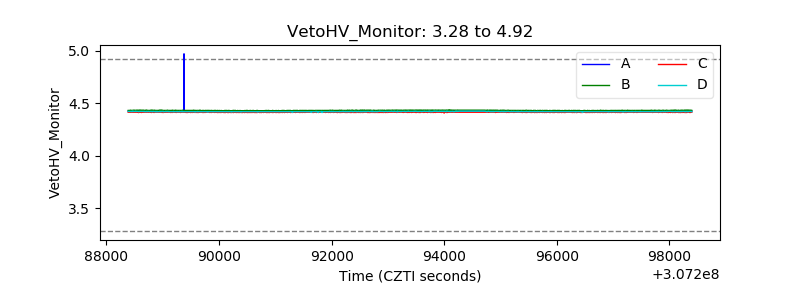 |
| Veto LLD | 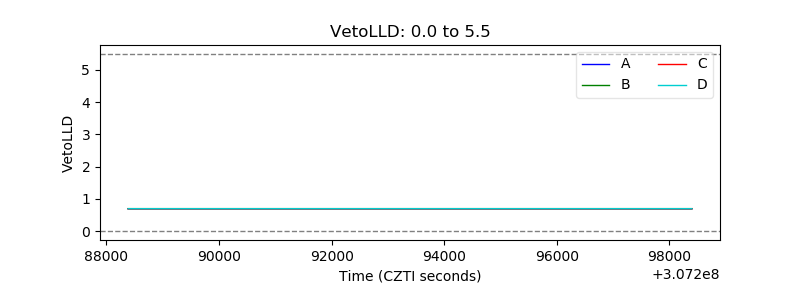 |
| Alpha Counter | 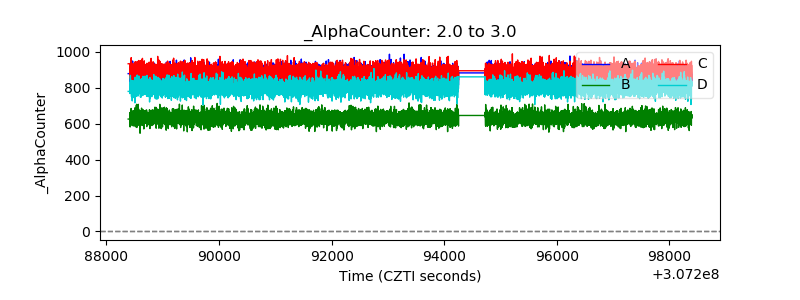 |
| _CPM_Rate | 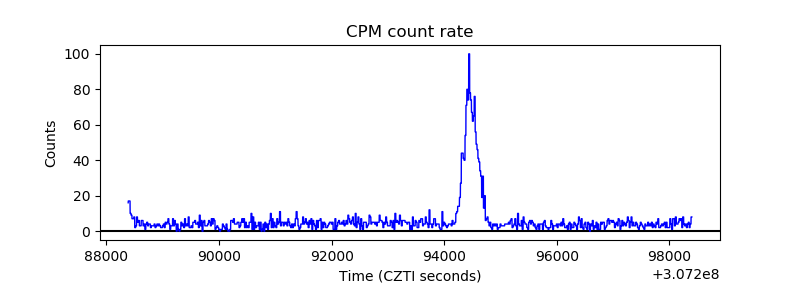 |
| CZT Counter | 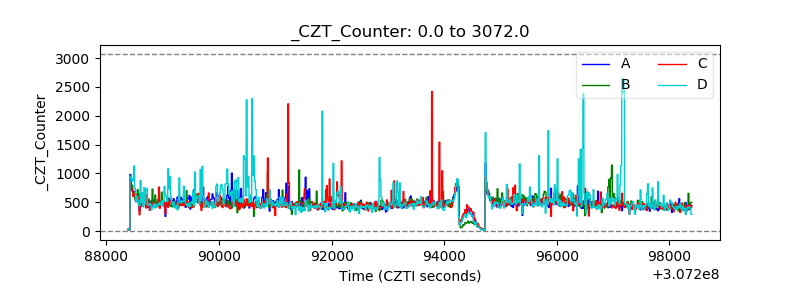 |
| +2.5 Volts monitor |  |
| +5 Volts monitor |  |
| _ROLL_ROT | 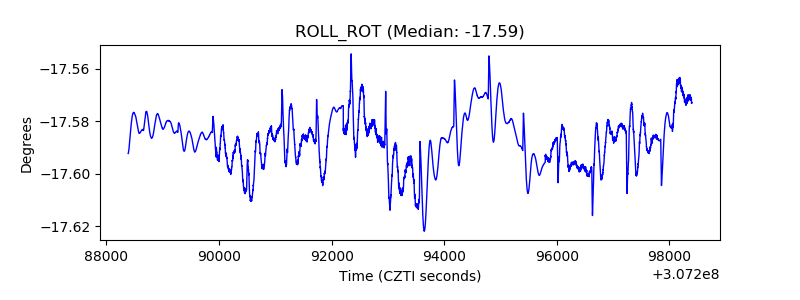 |
| _Roll_DEC | 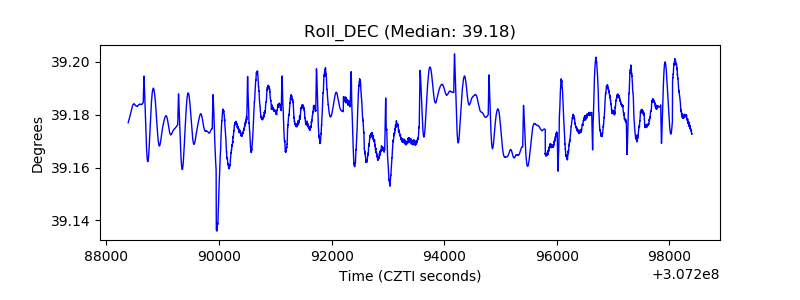 |
| _Roll_RA | 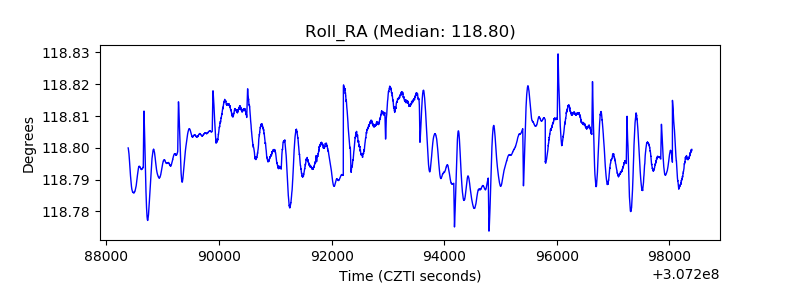 |
| Veto Counter | 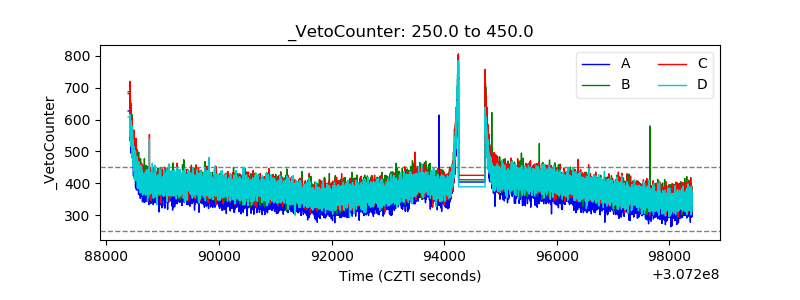 |