| Param | Original file | Final file |
|---|---|---|
| Filename | modeM0/AS1A05_094T01_9000003204_21620cztM0_level2.evt | modeM0/AS1A05_094T01_9000003204_21620cztM0_level2_quad_clean.evt |
| Size (bytes) | 477,192,960 | 81,806,400 |
| Size | 455.1 MB | 78.0 MB |
| Events in quadrant A | 3,487,319 | 510,324 |
| Events in quadrant B | 3,339,807 | 513,275 |
| Events in quadrant C | 3,258,583 | 503,434 |
| Events in quadrant D | 3,918,645 | 490,788 |
| Mode M0 | |||
|---|---|---|---|
| Quadrant | BADHDUFLAG | Total packets | Discarded packets |
| A | 0 | 14681 | 2 |
| B | 0 | 14209 | 1 |
| C | 0 | 13907 | 1 |
| D | 0 | 16179 | 1 |
| Mode M9 | |||
|---|---|---|---|
| Quadrant | BADHDUFLAG | Total packets | Discarded packets |
| A | 0 | 10 | 0 |
| B | 0 | 10 | 0 |
| C | 0 | 10 | 0 |
| D | 0 | 10 | 0 |
| Mode SS | |||
|---|---|---|---|
| Quadrant | BADHDUFLAG | Total packets | Discarded packets |
| A | 0 | 134 | 0 |
| B | 0 | 134 | 0 |
| C | 0 | 134 | 0 |
| D | 0 | 134 | 0 |
| Quadrant | Total seconds | Saturated seconds | Saturation percentage |
|---|---|---|---|
| A | 6587 | 132 | 2.003947% |
| B | 6587 | 49 | 0.743889% |
| C | 6588 | 85 | 1.290225% |
| D | 6588 | 193 | 2.929569% |
Noise dominated data is calculated using 1-second bins in cleaned event files. If a bin has >2000 counts, and if more than 50% of those come from <1% of pixels, then it is considered to be noise-dominated and hence unusable.
| Quadrant | # 1 sec bins | Bins with >0 counts | Bins with >2000 counts | High rate bins dominated by noise | Noise dominated (total time) | Noise dominated (detector-on time) | Marked lightcurve |
|---|---|---|---|---|---|---|---|
| A | 7587 | 6588 | 38 | 38 | 0.50% | 0.58% | 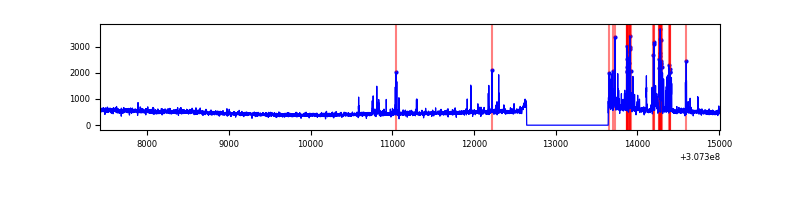 |
| B | 7587 | 6588 | 6 | 6 | 0.08% | 0.09% | 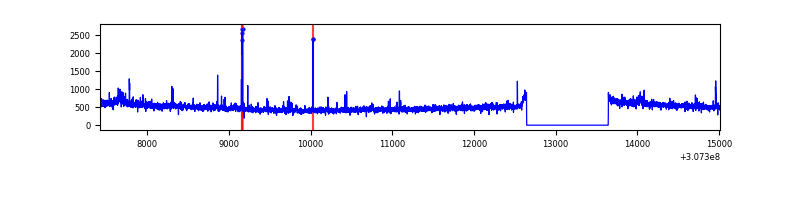 |
| C | 7588 | 6589 | 0 | 0 | 0.00% | 0.00% | 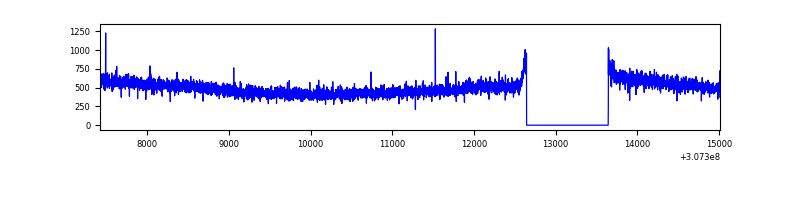 |
| D | 7588 | 6589 | 139 | 139 | 1.83% | 2.11% | 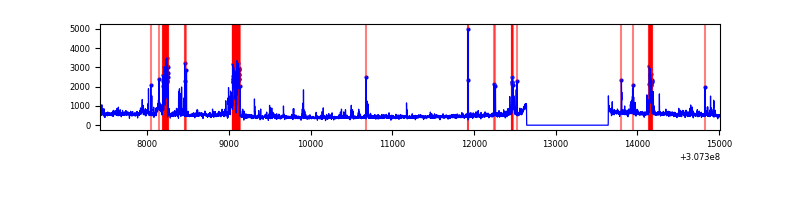 |
Top three noisy pixels from each quadrant. If the there are fewer than three noisy pixels in the level2.evt file, extra rows are filled as -1
| Pixel properties | Quadrant properties | ||||||
|---|---|---|---|---|---|---|---|
| Quadrant | DetID | PixID | Counts | Sigma | Mean | Median | Sigma |
| A | 5 | 16 | 332996 | 2022.67 | 815 | 797 | 164.2 |
| A | 15 | 236 | 11738 | 66.62 | 815 | 797 | 164.2 |
| A | 13 | 254 | 10547 | 59.36 | 815 | 797 | 164.2 |
| B | 0 | 190 | 37764 | 234.49 | 820 | 800 | 157.6 |
| B | 3 | 64 | 24381 | 149.59 | 820 | 800 | 157.6 |
| B | 0 | 228 | 19841 | 120.79 | 820 | 800 | 157.6 |
| C | 14 | 238 | 123988 | 660.65 | 796 | 800 | 186.5 |
| C | 9 | 54 | 16101 | 82.06 | 796 | 800 | 186.5 |
| C | 8 | 128 | 8306 | 40.25 | 796 | 800 | 186.5 |
| D | 13 | 172 | 209617 | 1077.54 | 797 | 775 | 193.8 |
| D | 7 | 238 | 185445 | 952.82 | 797 | 775 | 193.8 |
| D | 7 | 38 | 133431 | 684.45 | 797 | 775 | 193.8 |
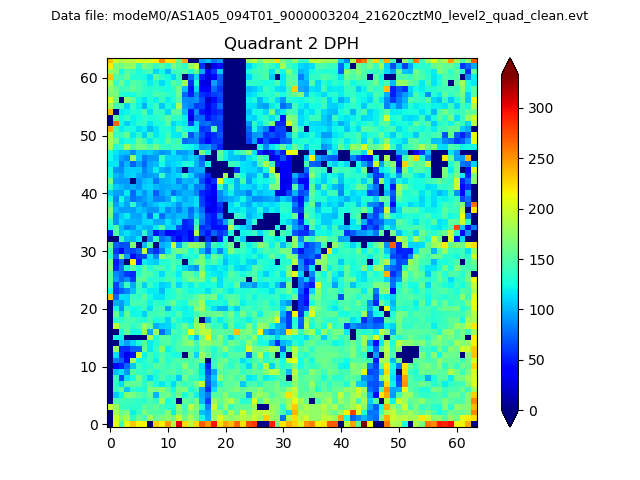
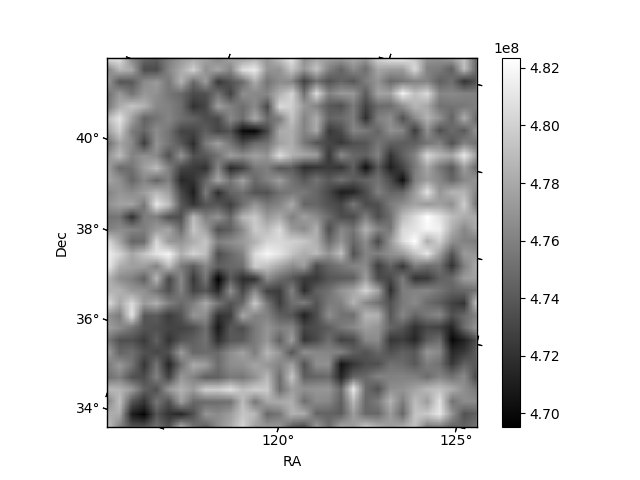
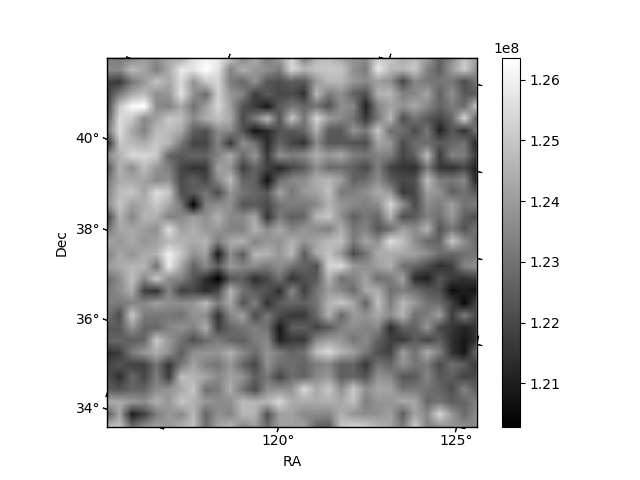
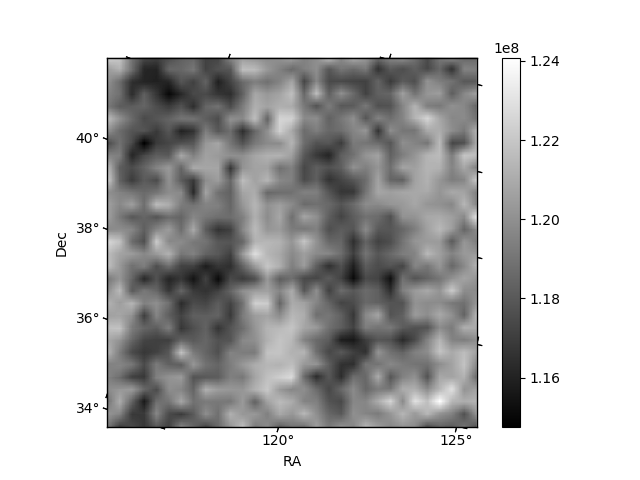
Histogram calculated using DETX and DETY for each event in the final _common_clean file
| Quadrant A | 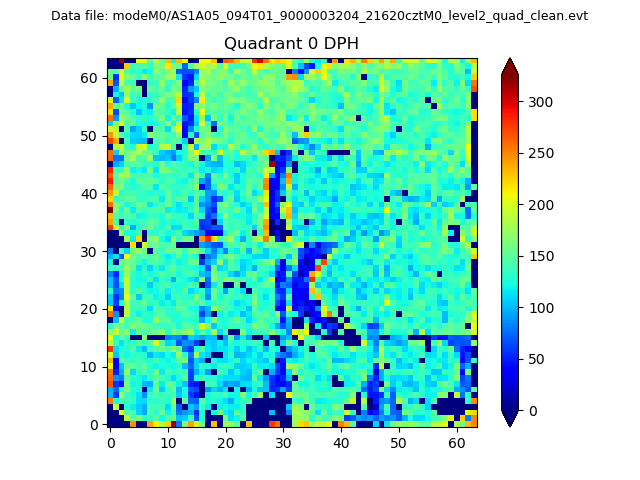 |
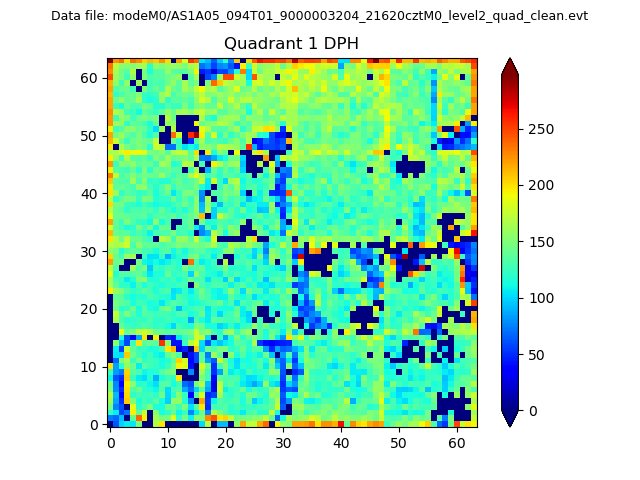 |
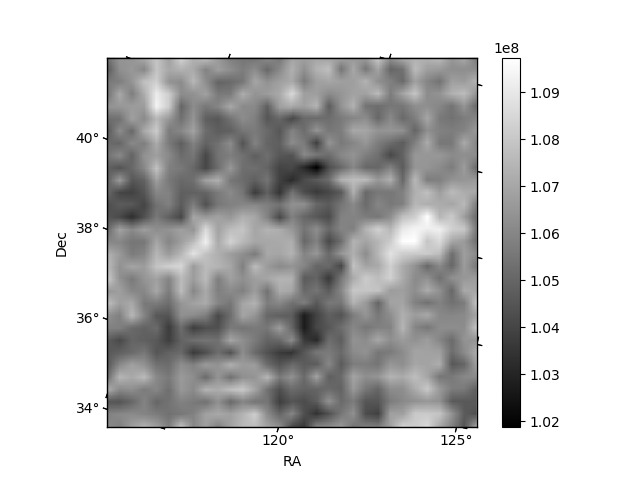
Quadrant B |
|---|---|---|---|
| Quadrant D | 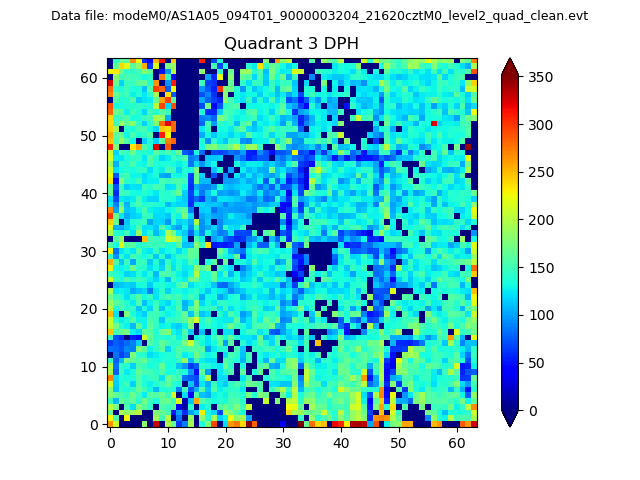 |
 |
Quadrant C |
| Plot type | Count rate plots | Images |
|---|---|---|
| Comparison with Poisson distribution Blue bars denote a histogram of data divided into 1 sec bins. Red curve is a Poisson curve with rate = median count rate of data. |
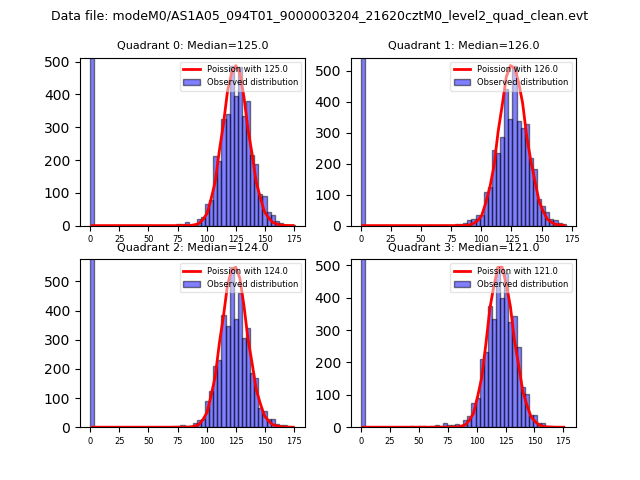 |
 |
| Quadrant-wise count rates Data is divided into 100 sec bins |
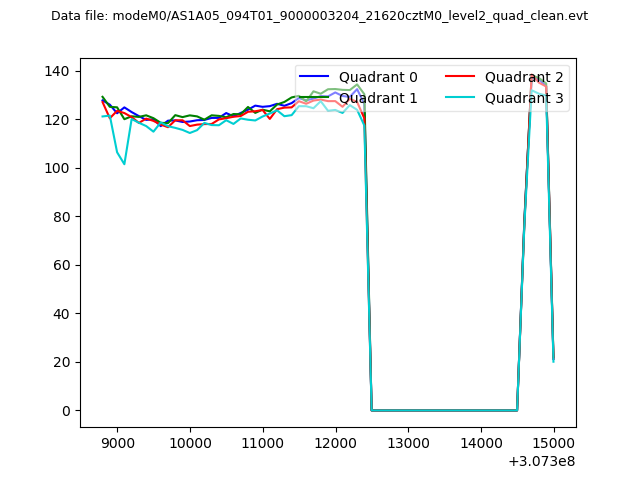 |
|
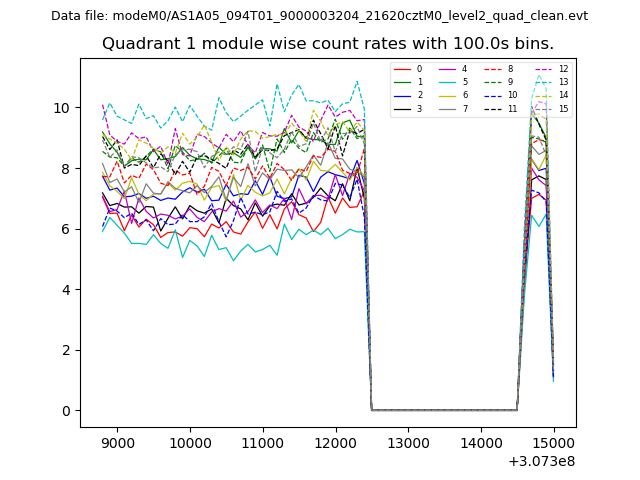
| Module-wise count rates for Quadrant A Data is divided into 100 sec bins |
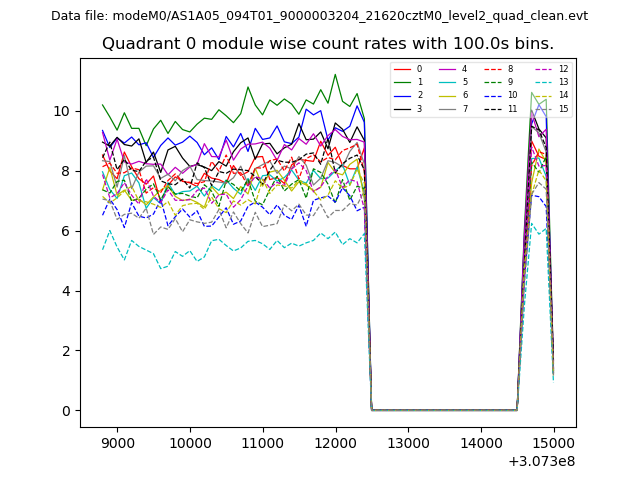 |
 |
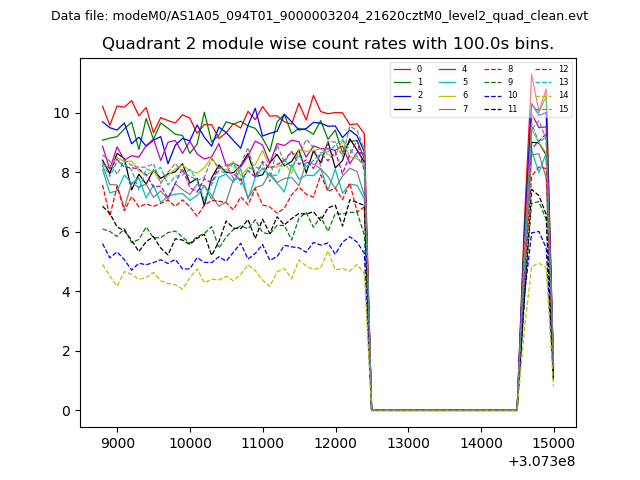
| Module-wise count rates for Quadrant B Data is divided into 100 sec bins |
 |
 |
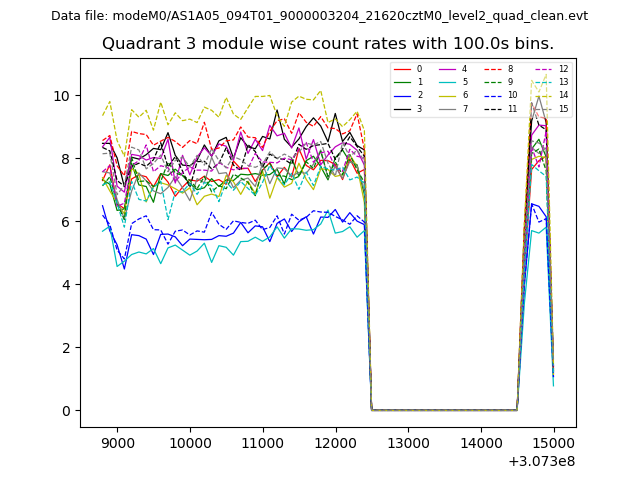
| Module-wise count rates for Quadrant C Data is divided into 100 sec bins |
 |
 |
| Module-wise count rates for Quadrant D Data is divided into 100 sec bins |
 |
 |
| Parameter | Plot |
|---|---|
| CZT HV Monitor | 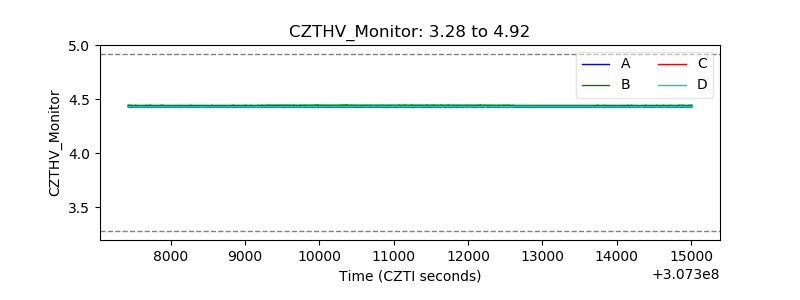 |
| D_VDD | 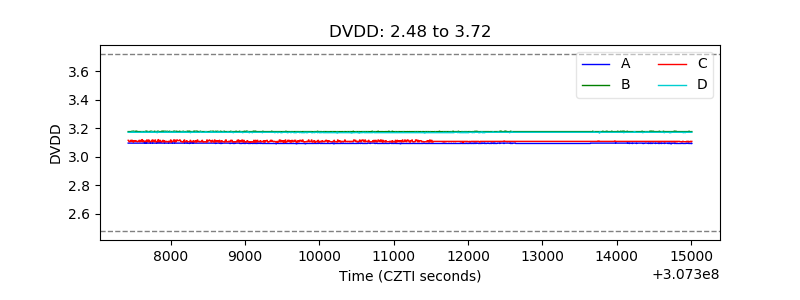 |
| Temperature 1 | 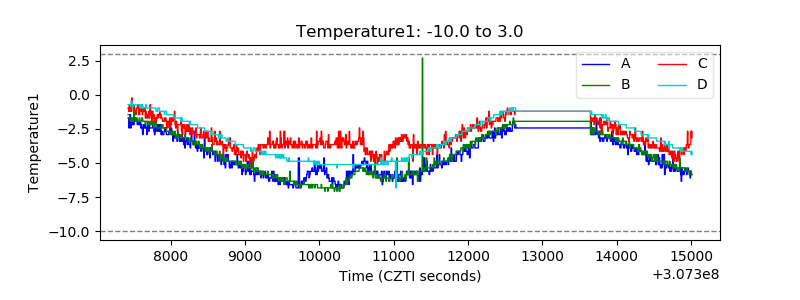 |
| Veto HV Monitor | 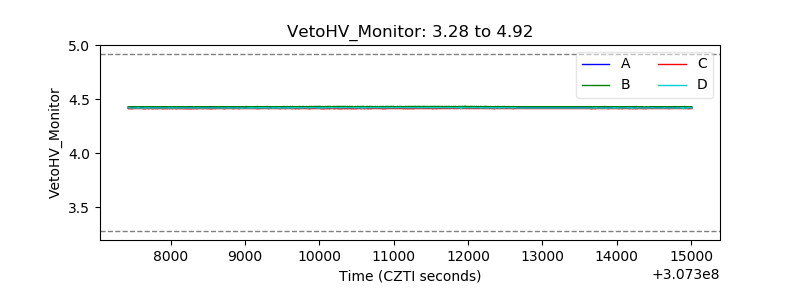 |
| Veto LLD | 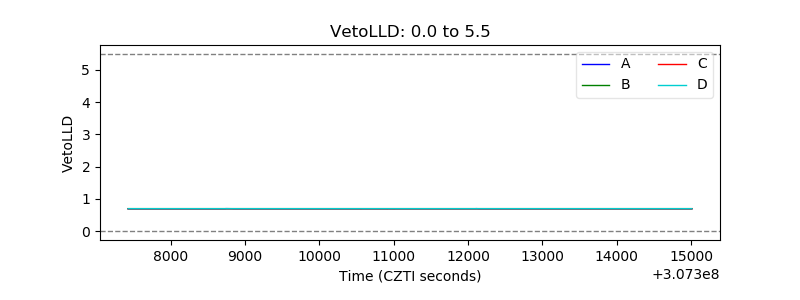 |
| Alpha Counter | 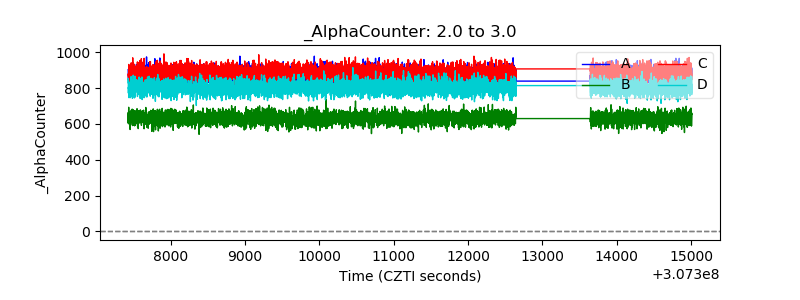 |
| _CPM_Rate | 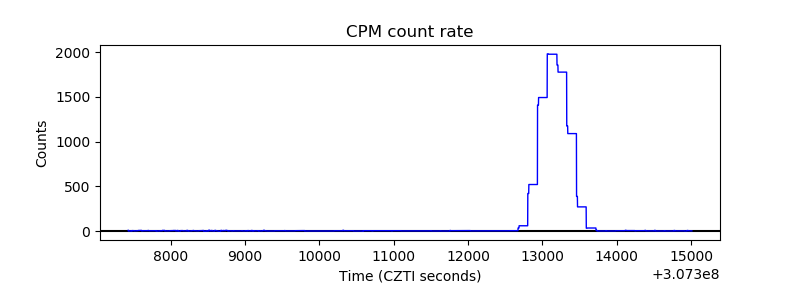 |
| CZT Counter | 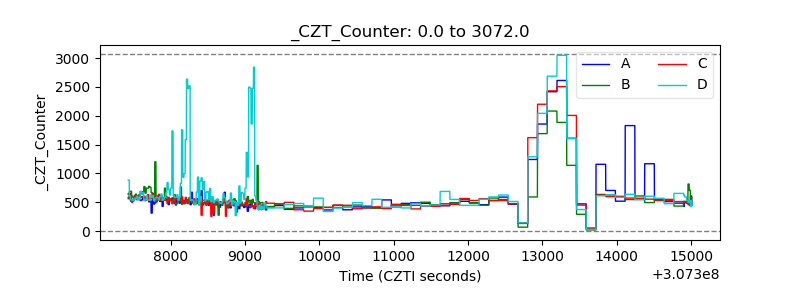 |
| +2.5 Volts monitor | 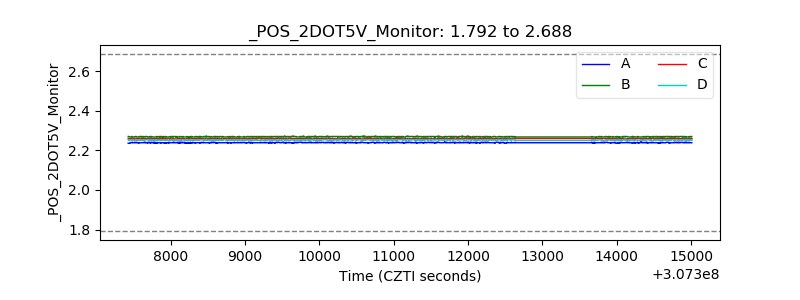 |
| +5 Volts monitor |  |
| _ROLL_ROT | 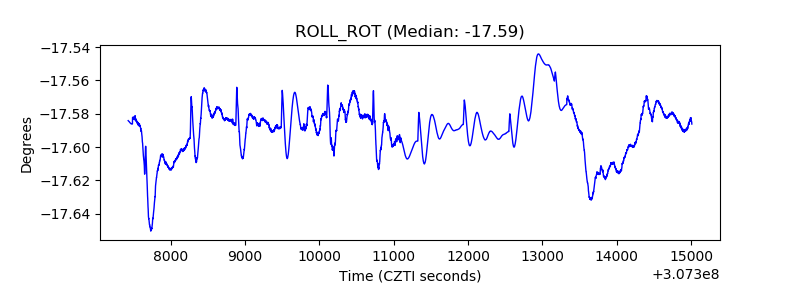 |
| _Roll_DEC | 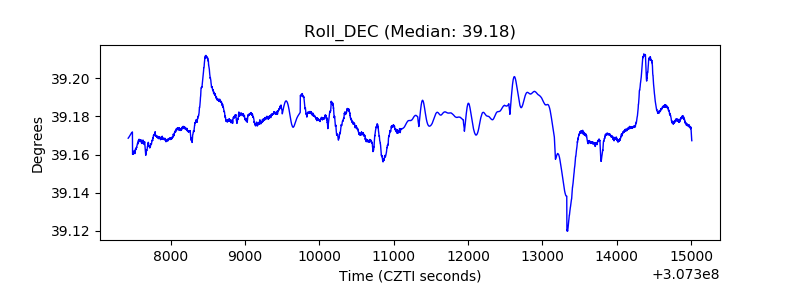 |
| _Roll_RA | 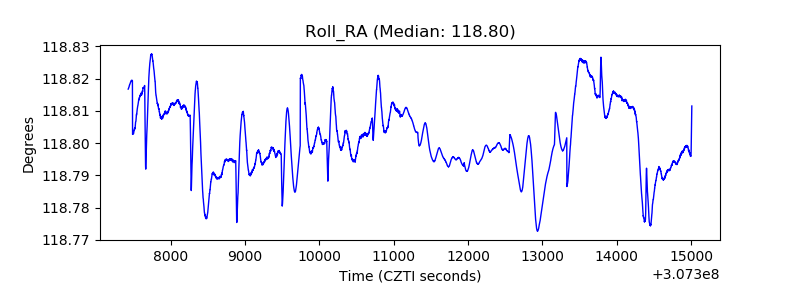 |
| Veto Counter | 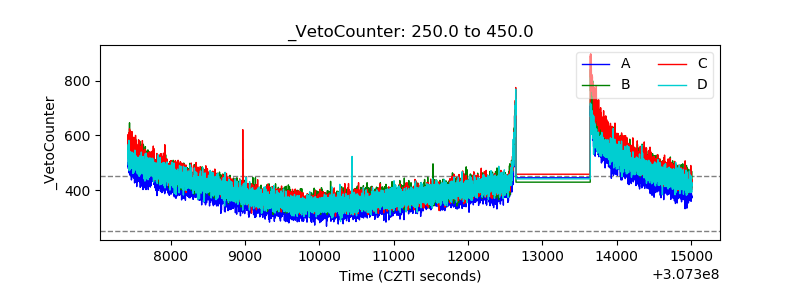 |