| Param | Original file | Final file |
|---|---|---|
| Filename | modeM0/AS1A05_094T01_9000003204_21622cztM0_level2.evt | modeM0/AS1A05_094T01_9000003204_21622cztM0_level2_quad_clean.evt |
| Size (bytes) | 489,991,680 | 91,488,960 |
| Size | 467.3 MB | 87.3 MB |
| Events in quadrant A | 3,581,974 | 581,625 |
| Events in quadrant B | 3,470,171 | 588,697 |
| Events in quadrant C | 3,330,822 | 577,131 |
| Events in quadrant D | 4,008,931 | 563,554 |
| Mode M0 | |||
|---|---|---|---|
| Quadrant | BADHDUFLAG | Total packets | Discarded packets |
| A | 0 | 15057 | 2 |
| B | 0 | 14690 | 2 |
| C | 0 | 14293 | 2 |
| D | 0 | 16442 | 2 |
| Mode M9 | |||
|---|---|---|---|
| Quadrant | BADHDUFLAG | Total packets | Discarded packets |
| A | 0 | 22 | 0 |
| B | 0 | 22 | 0 |
| C | 0 | 22 | 0 |
| D | 0 | 22 | 0 |
| Mode SS | |||
|---|---|---|---|
| Quadrant | BADHDUFLAG | Total packets | Discarded packets |
| A | 0 | 136 | 0 |
| B | 0 | 136 | 0 |
| C | 0 | 136 | 0 |
| D | 0 | 136 | 0 |
| Quadrant | Total seconds | Saturated seconds | Saturation percentage |
|---|---|---|---|
| A | 6590 | 152 | 2.306525% |
| B | 6591 | 70 | 1.062054% |
| C | 6590 | 109 | 1.654021% |
| D | 6590 | 270 | 4.097117% |
Noise dominated data is calculated using 1-second bins in cleaned event files. If a bin has >2000 counts, and if more than 50% of those come from <1% of pixels, then it is considered to be noise-dominated and hence unusable.
| Quadrant | # 1 sec bins | Bins with >0 counts | Bins with >2000 counts | High rate bins dominated by noise | Noise dominated (total time) | Noise dominated (detector-on time) | Marked lightcurve |
|---|---|---|---|---|---|---|---|
| A | 8750 | 6592 | 40 | 40 | 0.46% | 0.61% | 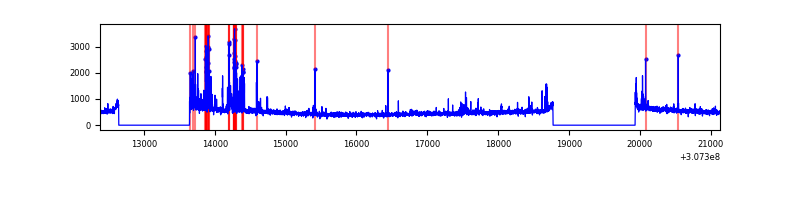 |
| B | 8751 | 6593 | 3 | 3 | 0.03% | 0.05% | 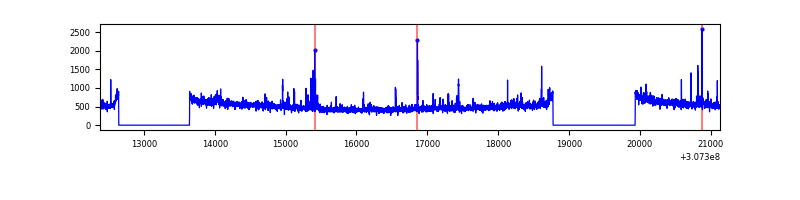 |
| C | 8750 | 6592 | 0 | 0 | 0.00% | 0.00% | 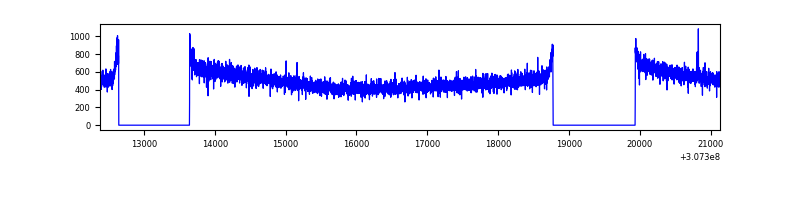 |
| D | 8750 | 6592 | 166 | 166 | 1.90% | 2.52% | 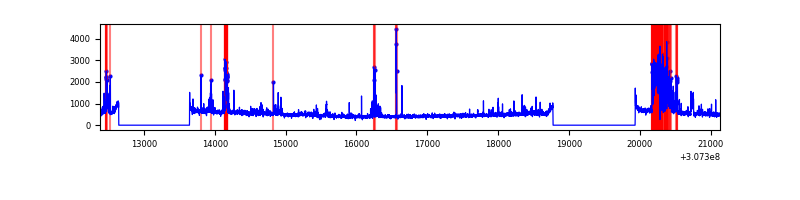 |
Top three noisy pixels from each quadrant. If the there are fewer than three noisy pixels in the level2.evt file, extra rows are filled as -1
| Pixel properties | Quadrant properties | ||||||
|---|---|---|---|---|---|---|---|
| Quadrant | DetID | PixID | Counts | Sigma | Mean | Median | Sigma |
| A | 5 | 16 | 345130 | 2045.32 | 837 | 818 | 168.3 |
| A | 13 | 254 | 9589 | 52.1 | 837 | 818 | 168.3 |
| A | 0 | 226 | 7301 | 38.51 | 837 | 818 | 168.3 |
| B | 0 | 230 | 51223 | 315.44 | 843 | 823 | 159.8 |
| B | 3 | 64 | 33223 | 202.78 | 843 | 823 | 159.8 |
| B | 0 | 197 | 29452 | 179.18 | 843 | 823 | 159.8 |
| C | 14 | 238 | 128947 | 672.82 | 817 | 824 | 190.4 |
| C | 9 | 54 | 10581 | 51.24 | 817 | 824 | 190.4 |
| C | 13 | 61 | 5760 | 25.92 | 817 | 824 | 190.4 |
| D | 1 | 52 | 555493 | 2811.87 | 812 | 791 | 197.3 |
| D | 7 | 238 | 170535 | 860.46 | 812 | 791 | 197.3 |
| D | 2 | 136 | 74624 | 374.27 | 812 | 791 | 197.3 |
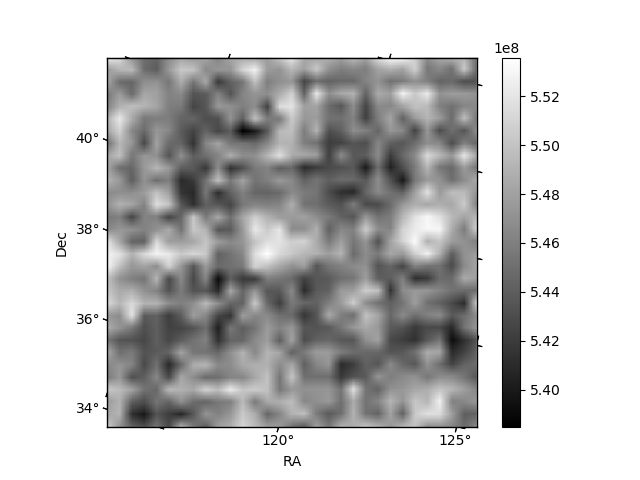
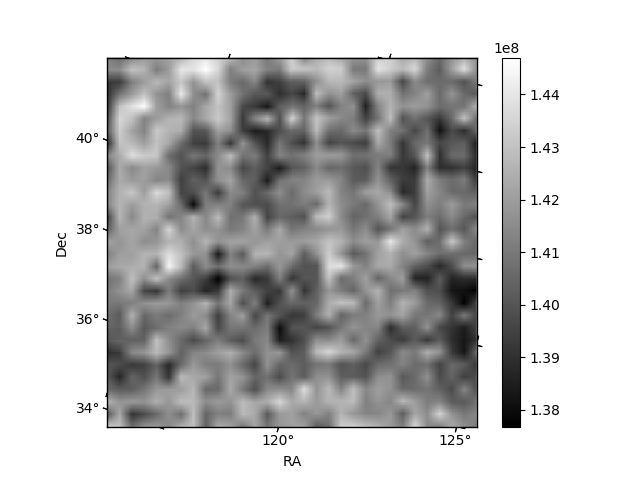
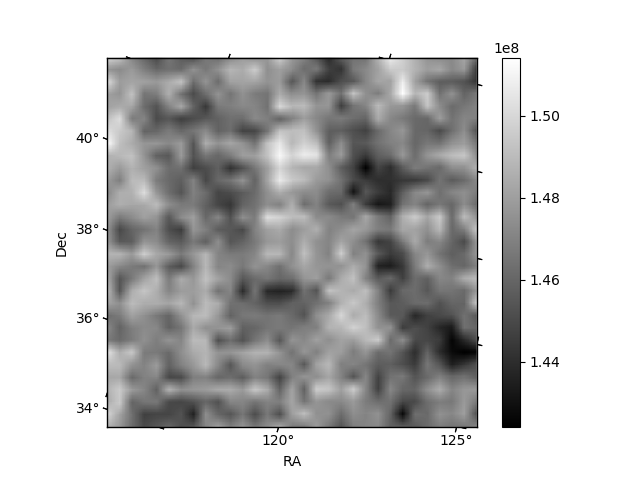
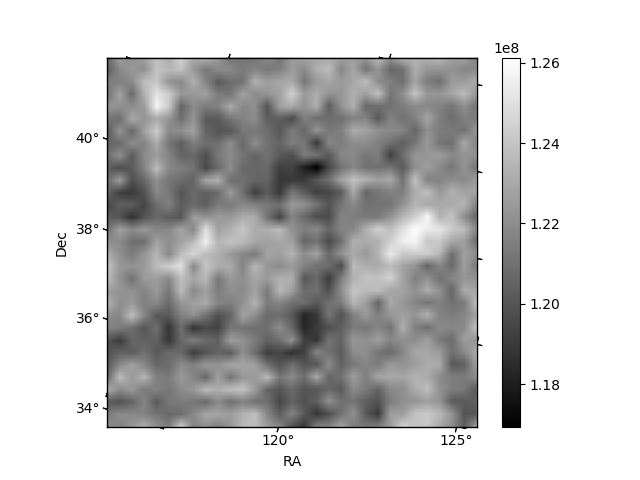
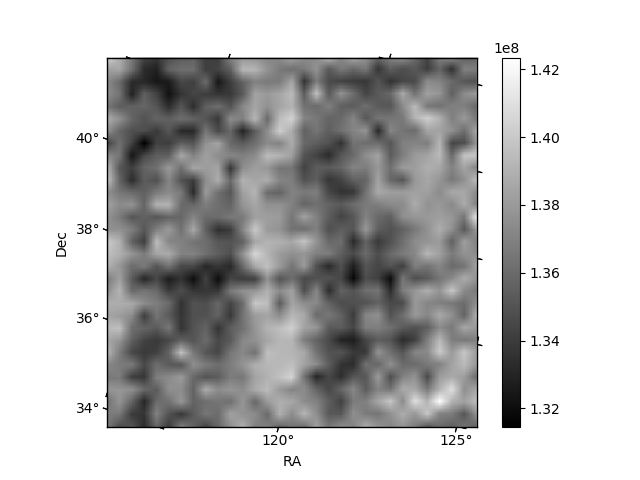
Histogram calculated using DETX and DETY for each event in the final _common_clean file
| Quadrant A | 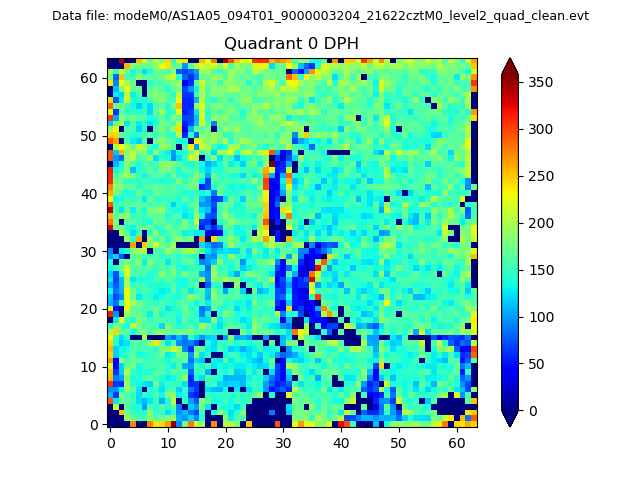 |
 |
Quadrant B |
|---|---|---|---|
| Quadrant D | 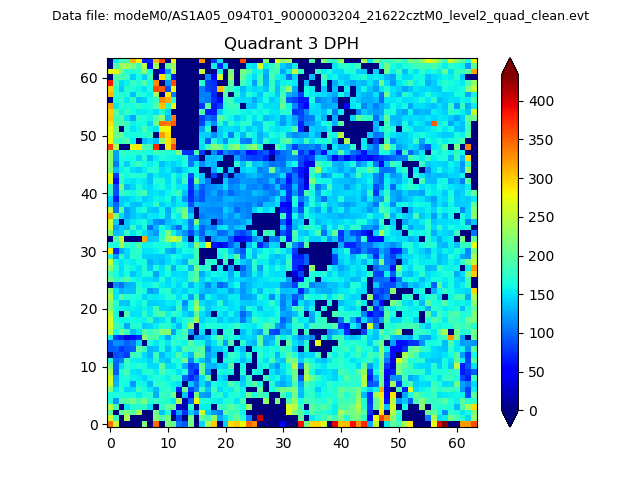 |
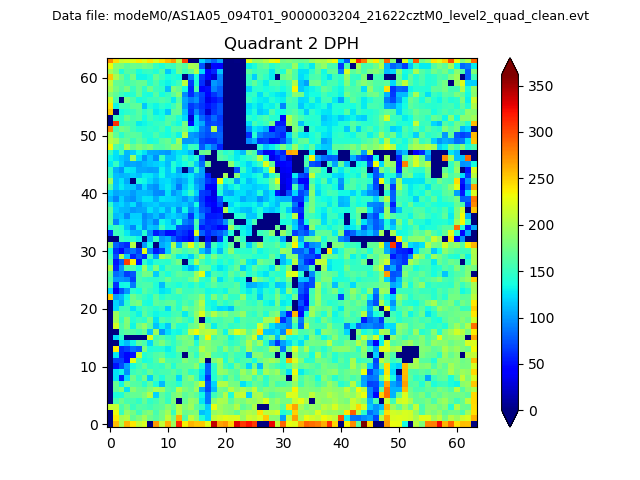 |
Quadrant C |
| Plot type | Count rate plots | Images |
|---|---|---|
| Comparison with Poisson distribution Blue bars denote a histogram of data divided into 1 sec bins. Red curve is a Poisson curve with rate = median count rate of data. |
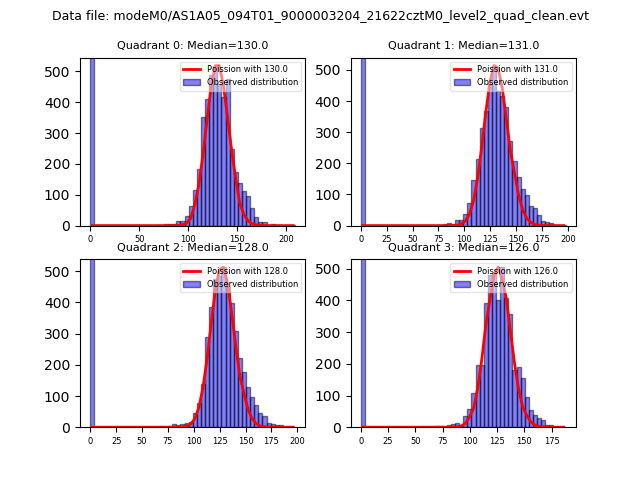 |
 |
| Quadrant-wise count rates Data is divided into 100 sec bins |
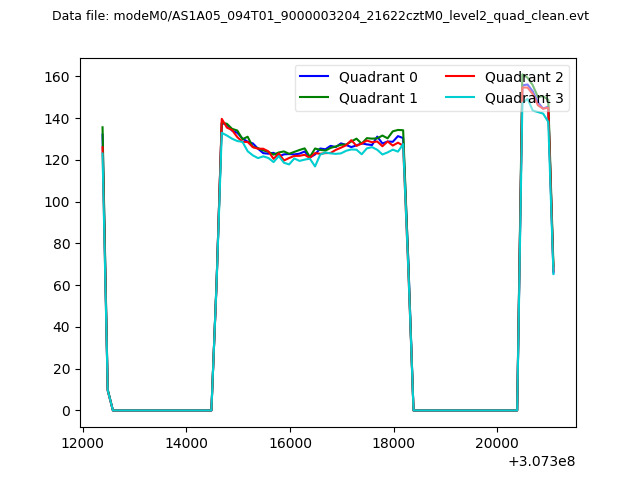 |
|
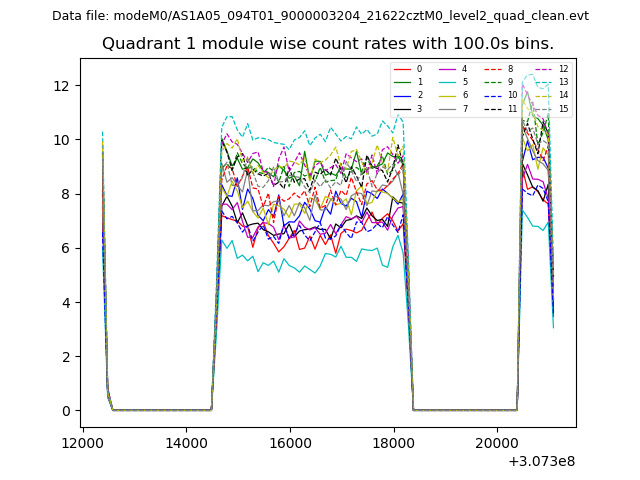
| Module-wise count rates for Quadrant A Data is divided into 100 sec bins |
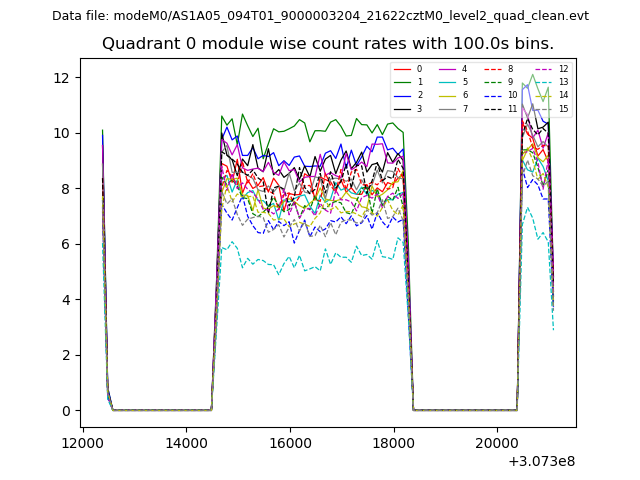 |
 |
| Module-wise count rates for Quadrant B Data is divided into 100 sec bins |
 |
 |
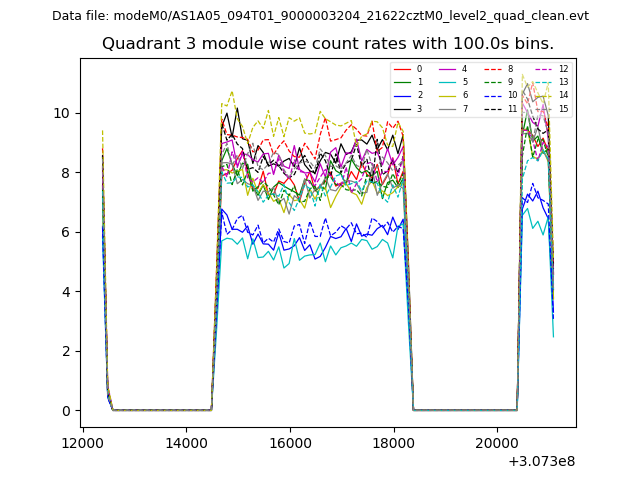
| Module-wise count rates for Quadrant C Data is divided into 100 sec bins |
 |
 |
| Module-wise count rates for Quadrant D Data is divided into 100 sec bins |
 |
 |
| Parameter | Plot |
|---|---|
| CZT HV Monitor | 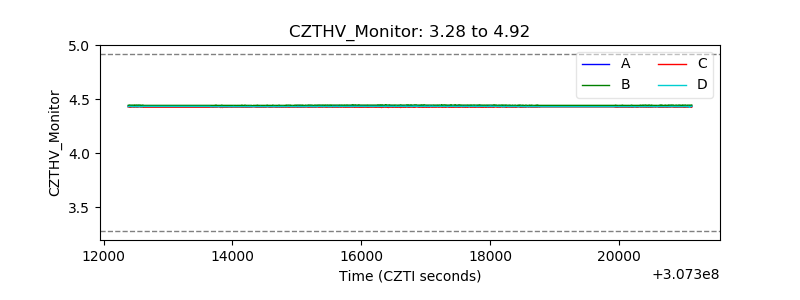 |
| D_VDD | 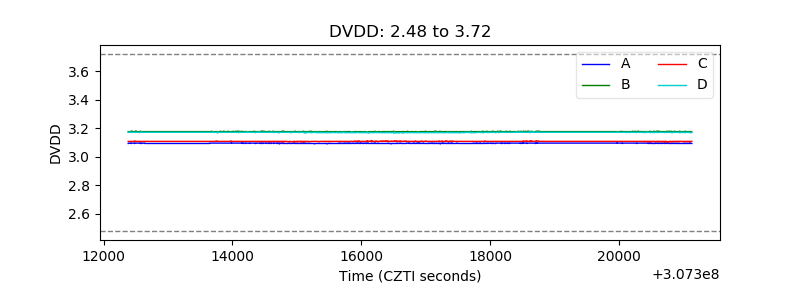 |
| Temperature 1 | 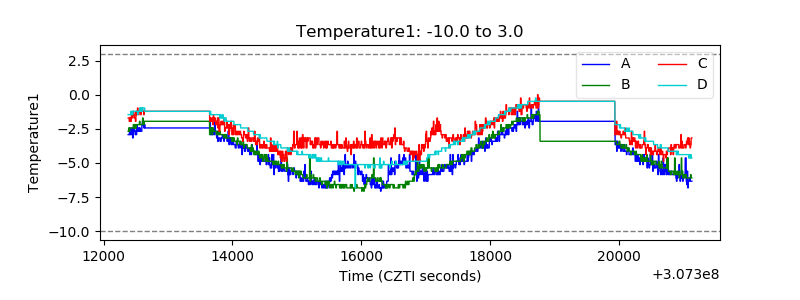 |
| Veto HV Monitor | 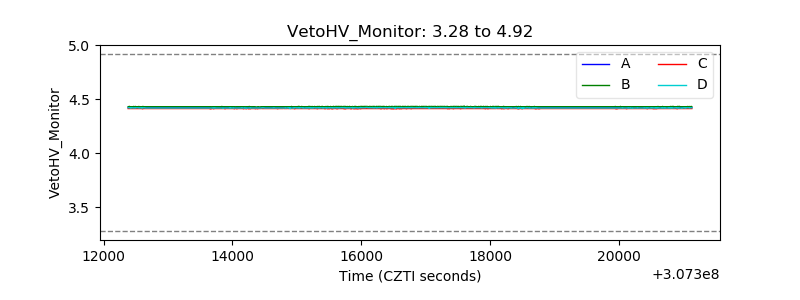 |
| Veto LLD | 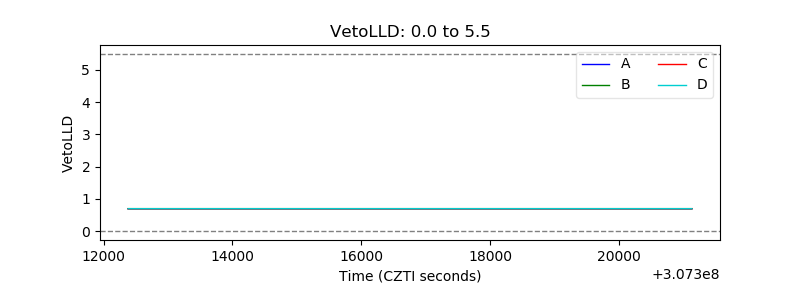 |
| Alpha Counter | 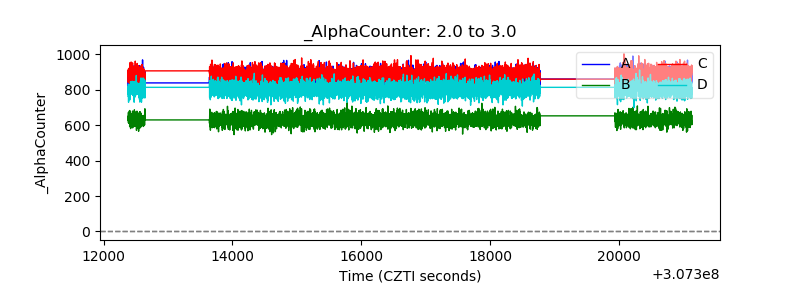 |
| _CPM_Rate | 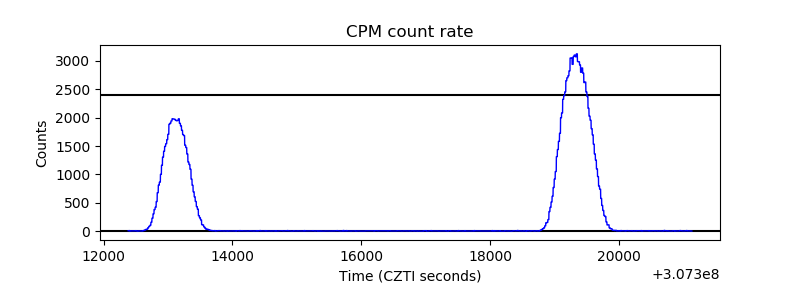 |
| CZT Counter | 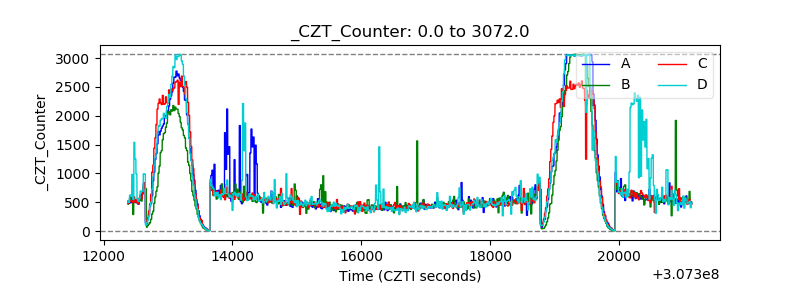 |
| +2.5 Volts monitor |  |
| +5 Volts monitor |  |
| _ROLL_ROT | 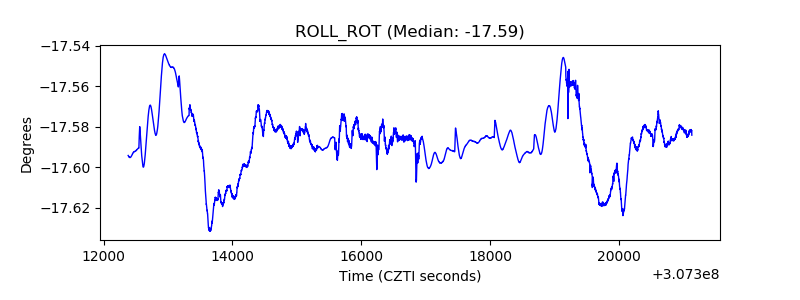 |
| _Roll_DEC | 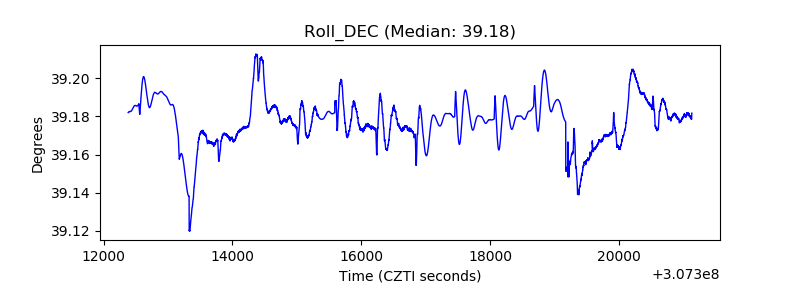 |
| _Roll_RA | 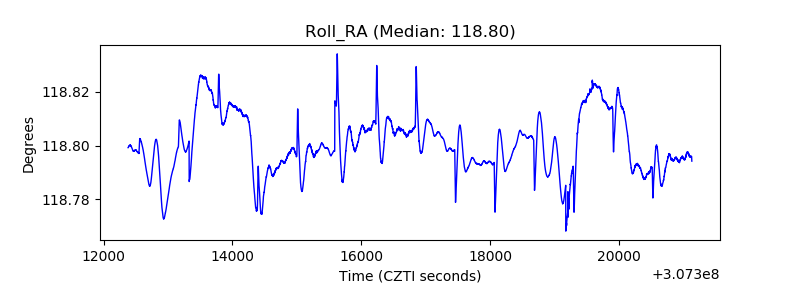 |
| Veto Counter | 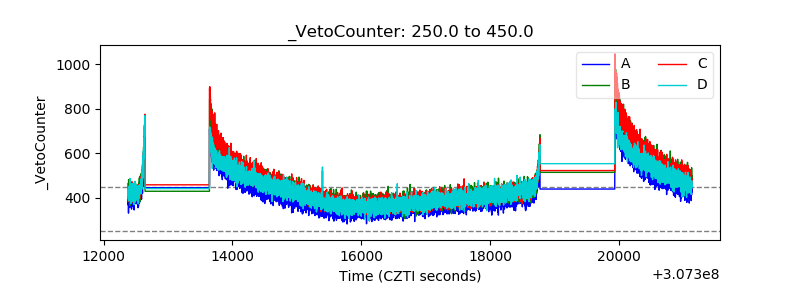 |