| Param | Original file | Final file |
|---|---|---|
| Filename | modeM0/AS1A05_094T01_9000003204_21626cztM0_level2.evt | modeM0/AS1A05_094T01_9000003204_21626cztM0_level2_quad_clean.evt |
| Size (bytes) | 438,315,840 | 83,479,680 |
| Size | 418.0 MB | 79.6 MB |
| Events in quadrant A | 2,803,079 | 538,241 |
| Events in quadrant B | 2,975,712 | 551,568 |
| Events in quadrant C | 2,848,284 | 528,476 |
| Events in quadrant D | 4,256,121 | 507,318 |
| Mode M0 | |||
|---|---|---|---|
| Quadrant | BADHDUFLAG | Total packets | Discarded packets |
| A | 0 | 11933 | 1 |
| B | 0 | 12541 | 1 |
| C | 0 | 12119 | 1 |
| D | 0 | 16533 | 1 |
| Mode M9 | |||
|---|---|---|---|
| Quadrant | BADHDUFLAG | Total packets | Discarded packets |
| A | 0 | 13 | 0 |
| B | 0 | 13 | 0 |
| C | 0 | 13 | 0 |
| D | 0 | 13 | 0 |
| Mode SS | |||
|---|---|---|---|
| Quadrant | BADHDUFLAG | Total packets | Discarded packets |
| A | 0 | 118 | 0 |
| B | 0 | 118 | 0 |
| C | 0 | 118 | 0 |
| D | 0 | 118 | 0 |
| Quadrant | Total seconds | Saturated seconds | Saturation percentage |
|---|---|---|---|
| A | 5751 | 20 | 0.347766% |
| B | 5752 | 46 | 0.799722% |
| C | 5752 | 68 | 1.182197% |
| D | 5752 | 512 | 8.901252% |
Noise dominated data is calculated using 1-second bins in cleaned event files. If a bin has >2000 counts, and if more than 50% of those come from <1% of pixels, then it is considered to be noise-dominated and hence unusable.
| Quadrant | # 1 sec bins | Bins with >0 counts | Bins with >2000 counts | High rate bins dominated by noise | Noise dominated (total time) | Noise dominated (detector-on time) | Marked lightcurve |
|---|---|---|---|---|---|---|---|
| A | 7076 | 5752 | 0 | 0 | 0.00% | 0.00% | 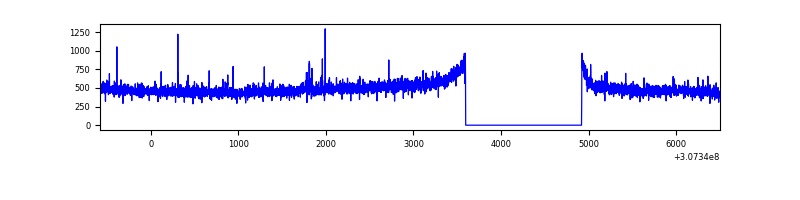 |
| B | 7077 | 5753 | 1 | 1 | 0.01% | 0.02% | 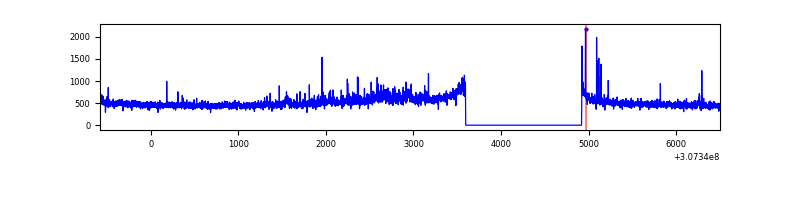 |
| C | 7077 | 5753 | 4 | 4 | 0.06% | 0.07% | 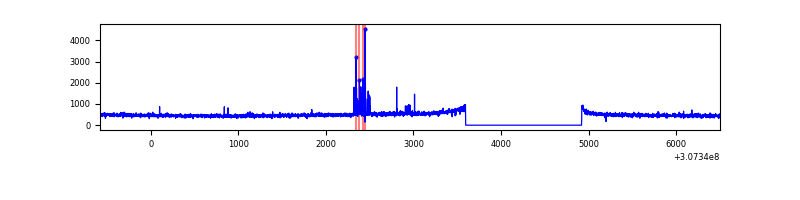 |
| D | 7077 | 5753 | 318 | 318 | 4.49% | 5.53% | 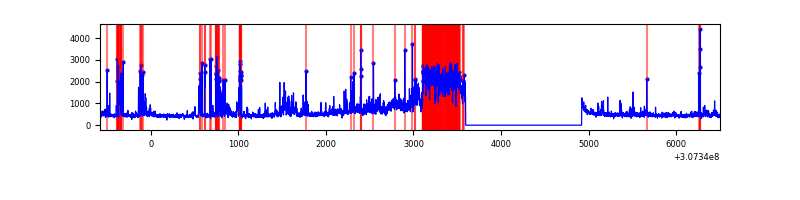 |
Top three noisy pixels from each quadrant. If the there are fewer than three noisy pixels in the level2.evt file, extra rows are filled as -1
| Pixel properties | Quadrant properties | ||||||
|---|---|---|---|---|---|---|---|
| Quadrant | DetID | PixID | Counts | Sigma | Mean | Median | Sigma |
| A | 5 | 16 | 16709 | 111.67 | 718 | 704 | 143.3 |
| A | 15 | 236 | 10794 | 70.4 | 718 | 704 | 143.3 |
| A | 5 | 203 | 8678 | 55.64 | 718 | 704 | 143.3 |
| B | 0 | 229 | 30562 | 220.08 | 718 | 702 | 135.7 |
| B | 3 | 64 | 27536 | 197.78 | 718 | 702 | 135.7 |
| B | 5 | 175 | 25799 | 184.98 | 718 | 702 | 135.7 |
| C | 14 | 238 | 108576 | 675.71 | 686 | 691 | 159.7 |
| C | 0 | 207 | 58445 | 361.73 | 686 | 691 | 159.7 |
| C | 10 | 22 | 6483 | 36.28 | 686 | 691 | 159.7 |
| D | 7 | 38 | 705151 | 4350.86 | 669 | 649 | 161.9 |
| D | 7 | 238 | 434710 | 2680.67 | 669 | 649 | 161.9 |
| D | 1 | 52 | 359256 | 2214.68 | 669 | 649 | 161.9 |
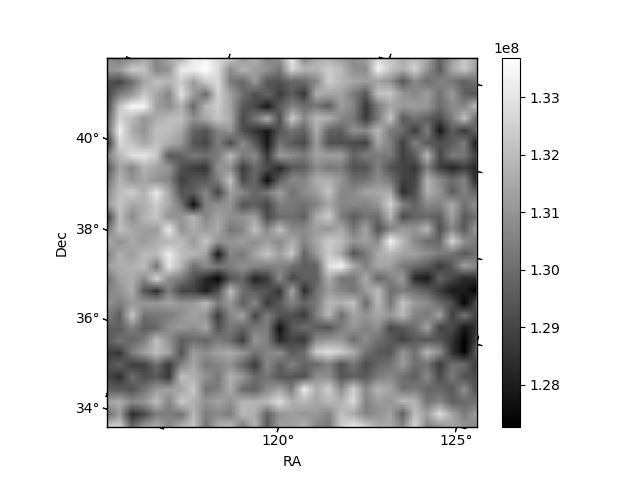
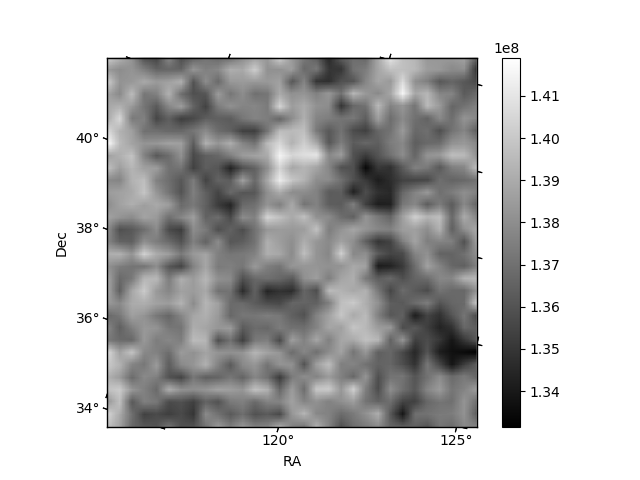
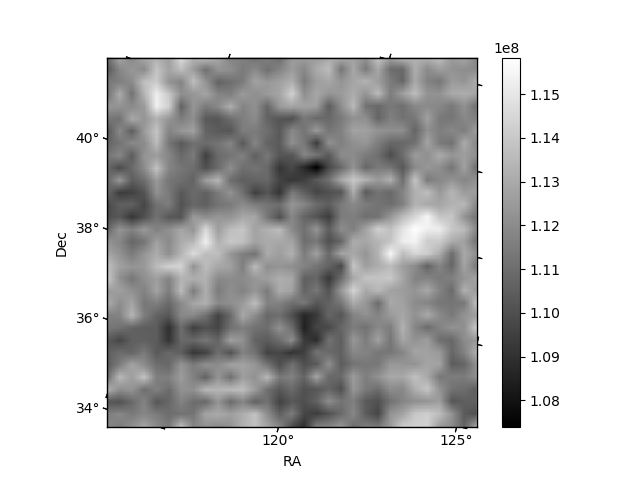
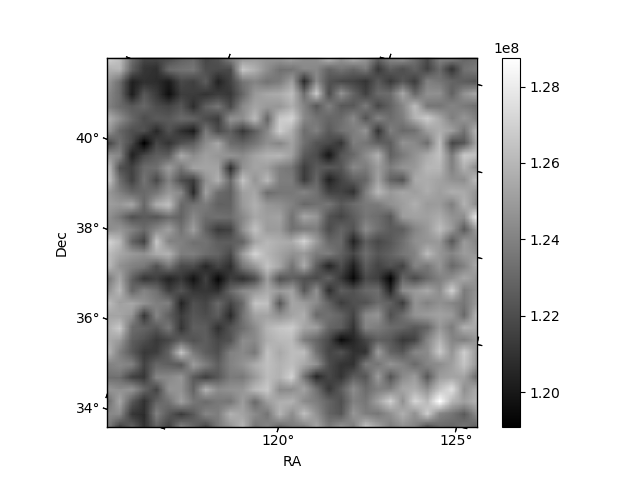
Histogram calculated using DETX and DETY for each event in the final _common_clean file
| Quadrant A | 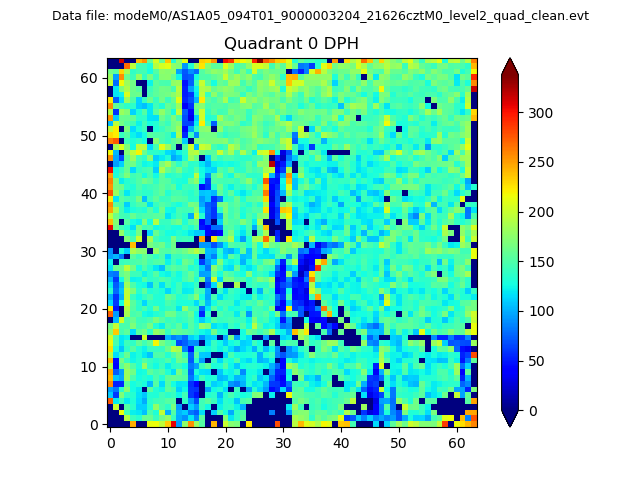 |
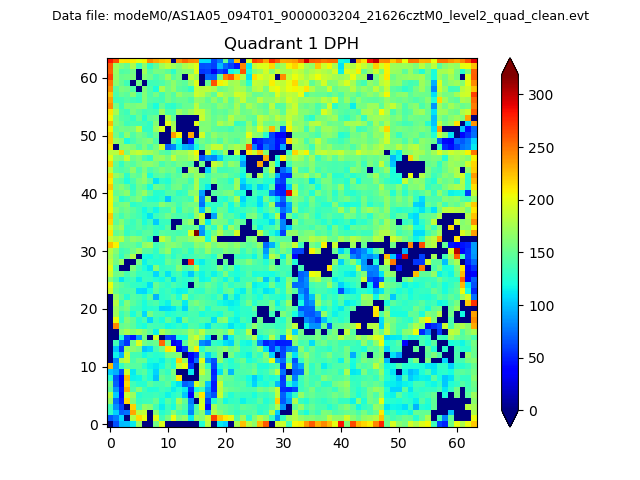 |
Quadrant B |
|---|---|---|---|
| Quadrant D | 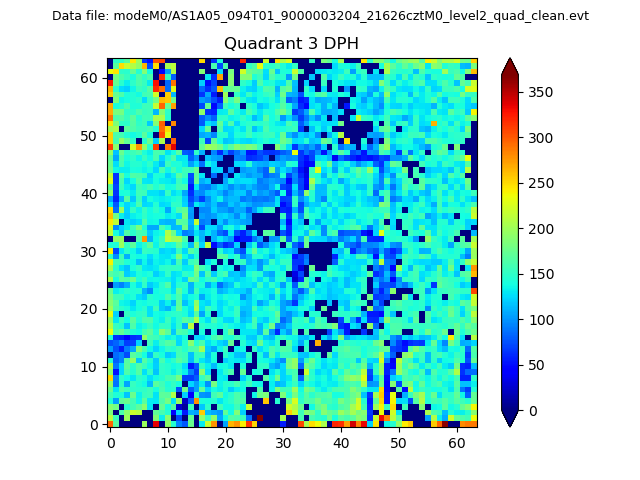 |
 |
Quadrant C |
| Plot type | Count rate plots | Images |
|---|---|---|
| Comparison with Poisson distribution Blue bars denote a histogram of data divided into 1 sec bins. Red curve is a Poisson curve with rate = median count rate of data. |
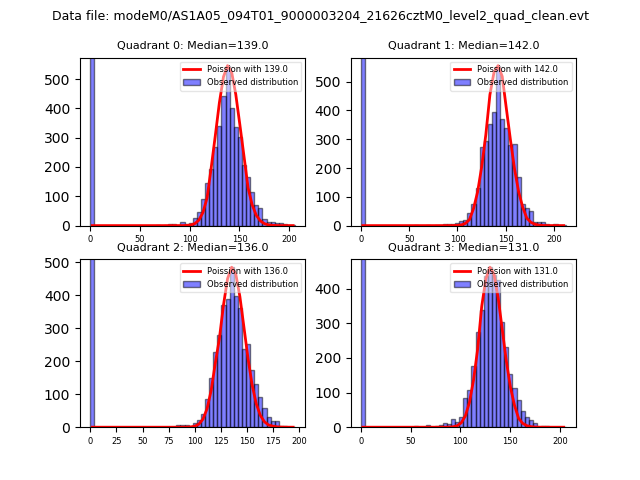 |
 |
| Quadrant-wise count rates Data is divided into 100 sec bins |
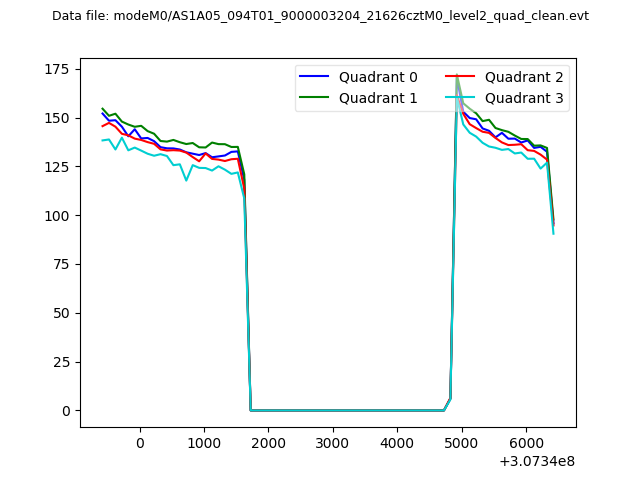 |
|
| Module-wise count rates for Quadrant A Data is divided into 100 sec bins |
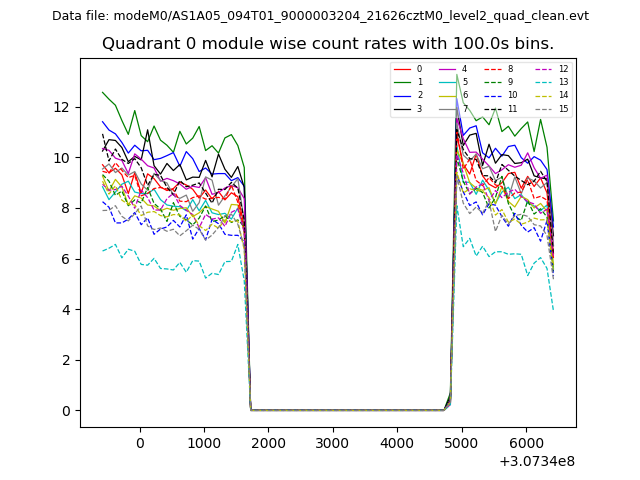 |
 |
| Module-wise count rates for Quadrant B Data is divided into 100 sec bins |
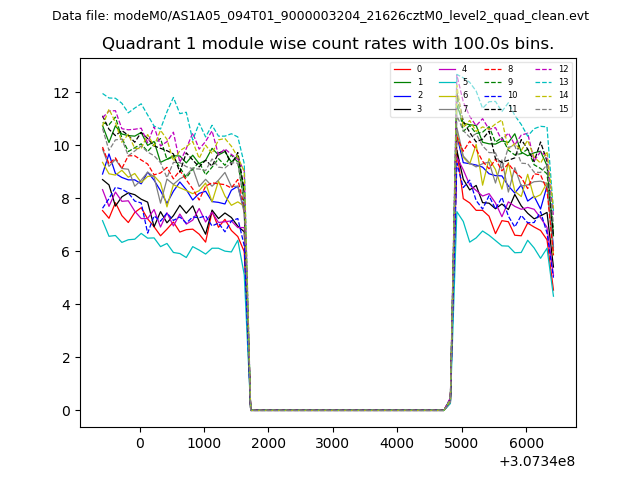 |
 |
| Module-wise count rates for Quadrant C Data is divided into 100 sec bins |
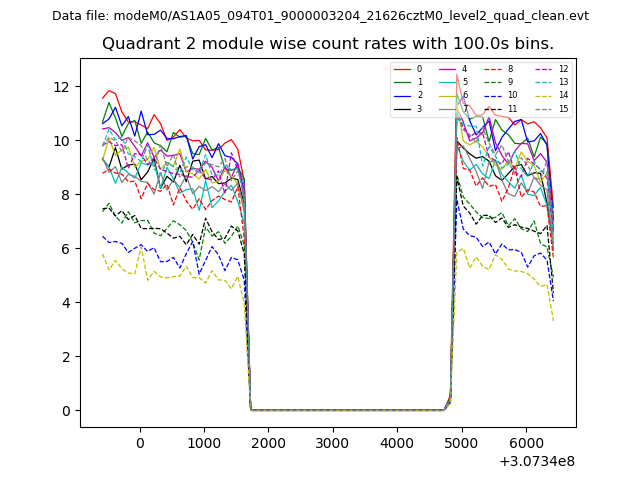 |
 |
| Module-wise count rates for Quadrant D Data is divided into 100 sec bins |
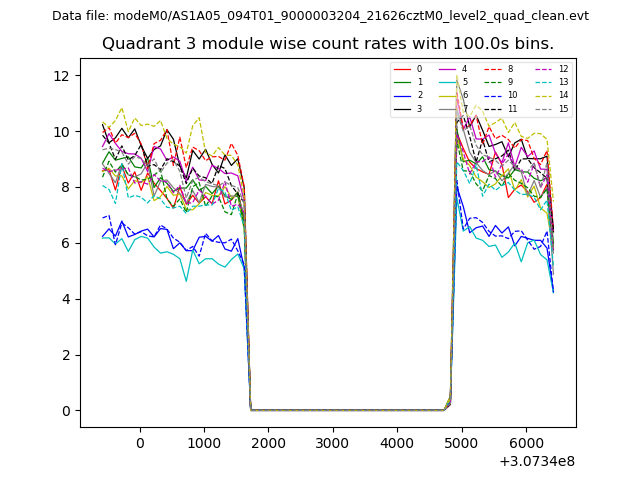 |
 |
| Parameter | Plot |
|---|---|
| CZT HV Monitor | 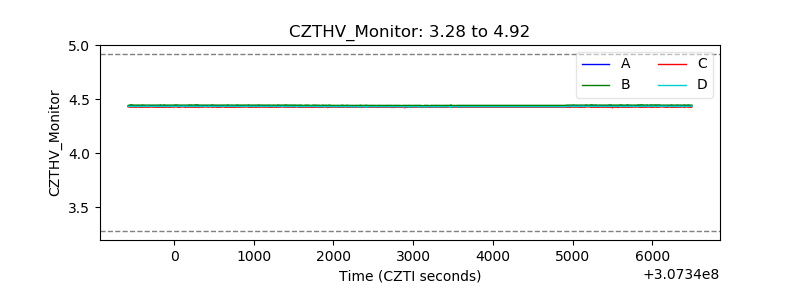 |
| D_VDD | 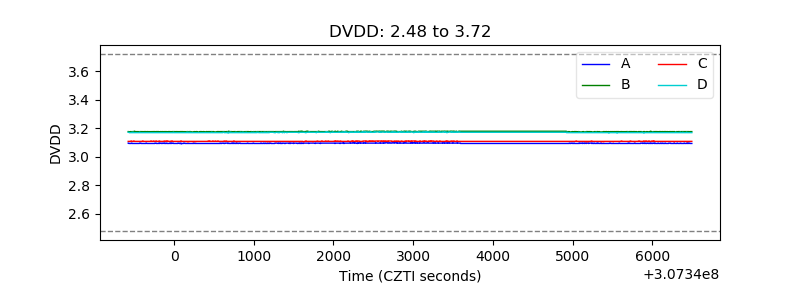 |
| Temperature 1 | 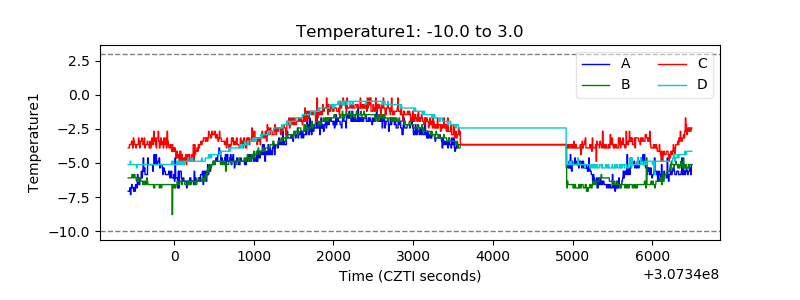 |
| Veto HV Monitor | 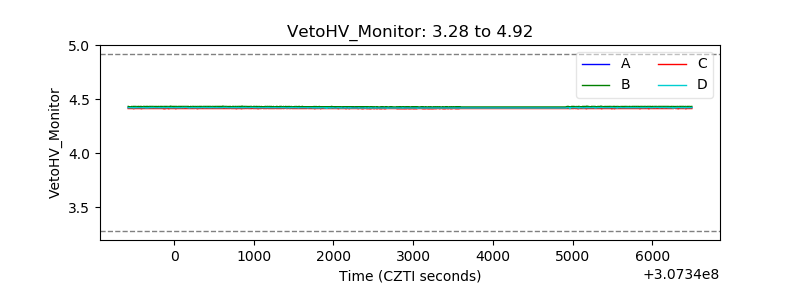 |
| Veto LLD | 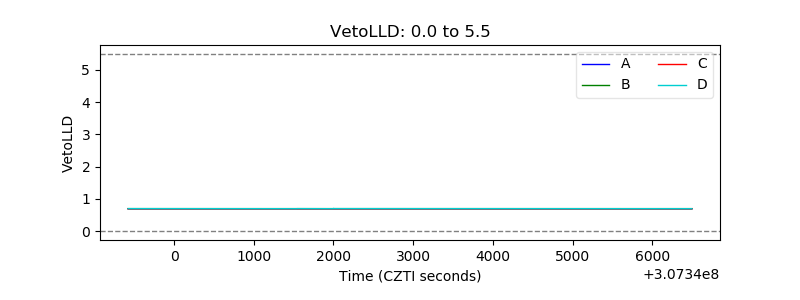 |
| Alpha Counter | 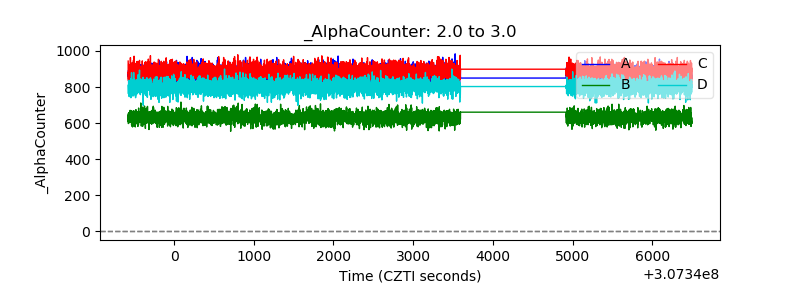 |
| _CPM_Rate | 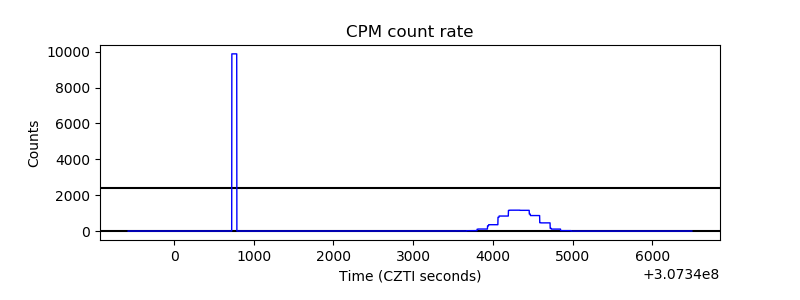 |
| CZT Counter |  |
| +2.5 Volts monitor |  |
| +5 Volts monitor |  |
| _ROLL_ROT | 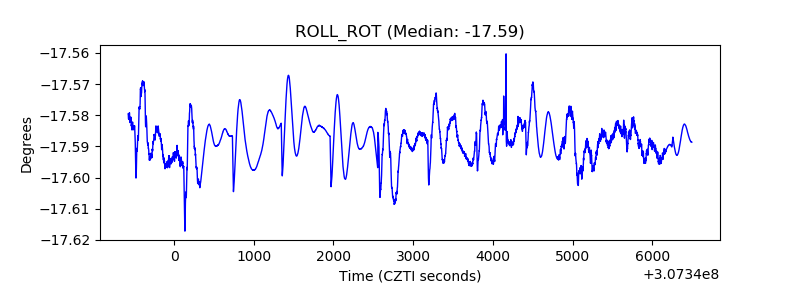 |
| _Roll_DEC | 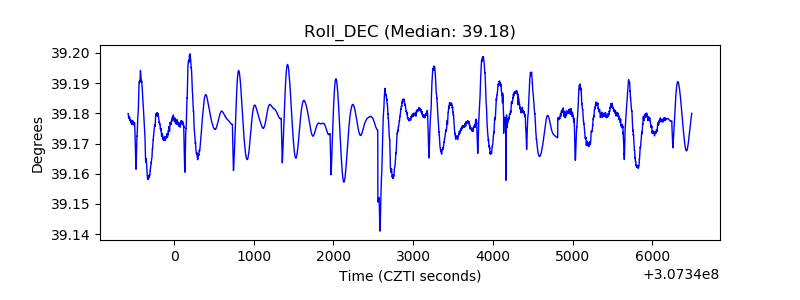 |
| _Roll_RA |  |
| Veto Counter | 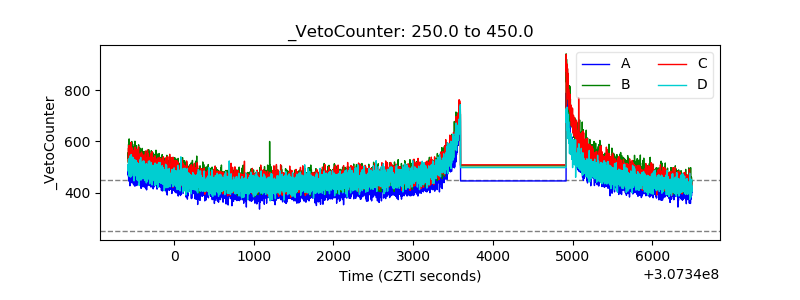 |