| Param | Original file | Final file |
|---|---|---|
| Filename | modeM0/AS1A05_094T01_9000003204_21627cztM0_level2.evt | modeM0/AS1A05_094T01_9000003204_21627cztM0_level2_quad_clean.evt |
| Size (bytes) | 445,224,960 | 87,776,640 |
| Size | 424.6 MB | 83.7 MB |
| Events in quadrant A | 3,070,362 | 562,550 |
| Events in quadrant B | 3,184,052 | 569,138 |
| Events in quadrant C | 3,035,901 | 550,400 |
| Events in quadrant D | 3,762,607 | 533,794 |
| Mode M0 | |||
|---|---|---|---|
| Quadrant | BADHDUFLAG | Total packets | Discarded packets |
| A | 0 | 13168 | 1 |
| B | 0 | 13371 | 1 |
| C | 0 | 13122 | 1 |
| D | 0 | 15549 | 1 |
| Mode M9 | |||
|---|---|---|---|
| Quadrant | BADHDUFLAG | Total packets | Discarded packets |
| A | 0 | 10 | 0 |
| B | 0 | 10 | 0 |
| C | 0 | 10 | 0 |
| D | 0 | 10 | 0 |
| Mode SS | |||
|---|---|---|---|
| Quadrant | BADHDUFLAG | Total packets | Discarded packets |
| A | 0 | 130 | 0 |
| B | 0 | 130 | 0 |
| C | 0 | 130 | 0 |
| D | 0 | 130 | 0 |
| Quadrant | Total seconds | Saturated seconds | Saturation percentage |
|---|---|---|---|
| A | 6334 | 41 | 0.647300% |
| B | 6334 | 63 | 0.994632% |
| C | 6334 | 75 | 1.184086% |
| D | 6335 | 64 | 1.010260% |
Noise dominated data is calculated using 1-second bins in cleaned event files. If a bin has >2000 counts, and if more than 50% of those come from <1% of pixels, then it is considered to be noise-dominated and hence unusable.
| Quadrant | # 1 sec bins | Bins with >0 counts | Bins with >2000 counts | High rate bins dominated by noise | Noise dominated (total time) | Noise dominated (detector-on time) | Marked lightcurve |
|---|---|---|---|---|---|---|---|
| A | 7384 | 6335 | 3 | 3 | 0.04% | 0.05% | 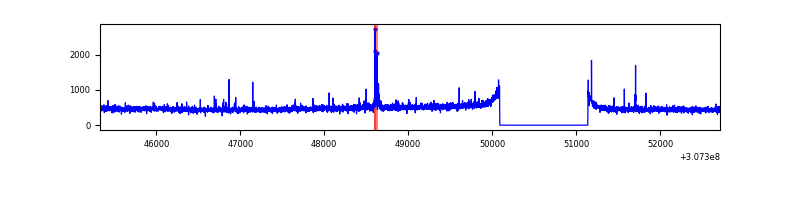 |
| B | 7384 | 6335 | 3 | 3 | 0.04% | 0.05% | 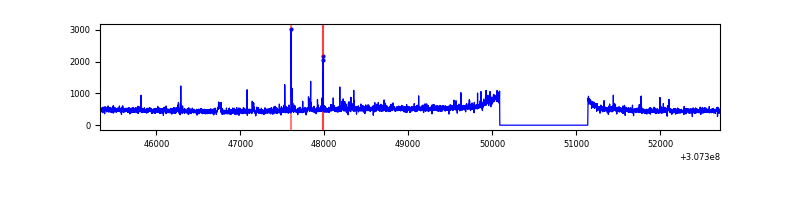 |
| C | 7384 | 6335 | 0 | 0 | 0.00% | 0.00% | 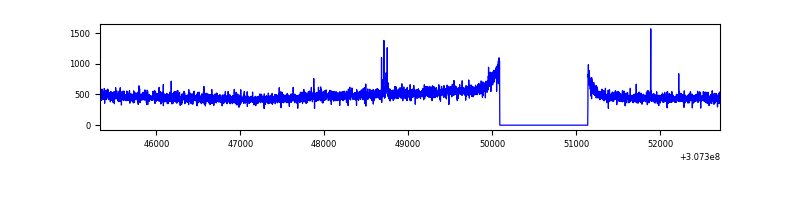 |
| D | 7385 | 6336 | 28 | 28 | 0.38% | 0.44% | 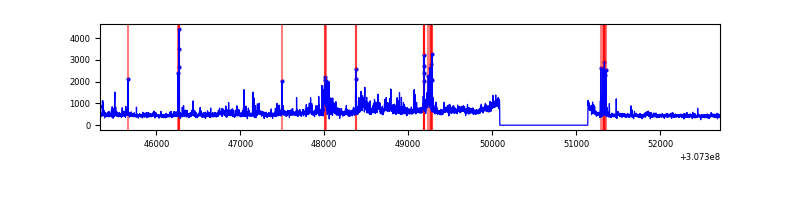 |
Top three noisy pixels from each quadrant. If the there are fewer than three noisy pixels in the level2.evt file, extra rows are filled as -1
| Pixel properties | Quadrant properties | ||||||
|---|---|---|---|---|---|---|---|
| Quadrant | DetID | PixID | Counts | Sigma | Mean | Median | Sigma |
| A | 5 | 16 | 51611 | 324.69 | 780 | 762 | 156.6 |
| A | 13 | 254 | 8586 | 49.96 | 780 | 762 | 156.6 |
| A | 15 | 236 | 8147 | 47.16 | 780 | 762 | 156.6 |
| B | 3 | 64 | 32912 | 216.84 | 778 | 760 | 148.3 |
| B | 0 | 229 | 25911 | 169.63 | 778 | 760 | 148.3 |
| B | 12 | 111 | 17409 | 112.29 | 778 | 760 | 148.3 |
| C | 14 | 238 | 116960 | 666.92 | 744 | 749 | 174.3 |
| C | 0 | 207 | 10770 | 57.51 | 744 | 749 | 174.3 |
| C | 10 | 22 | 8741 | 45.87 | 744 | 749 | 174.3 |
| D | 7 | 238 | 334068 | 1829.02 | 751 | 728 | 182.3 |
| D | 13 | 168 | 202396 | 1106.54 | 751 | 728 | 182.3 |
| D | 2 | 136 | 143411 | 782.89 | 751 | 728 | 182.3 |
Histogram calculated using DETX and DETY for each event in the final _common_clean file
| Quadrant A |  |
 |
Quadrant B |
|---|---|---|---|
| Quadrant D | 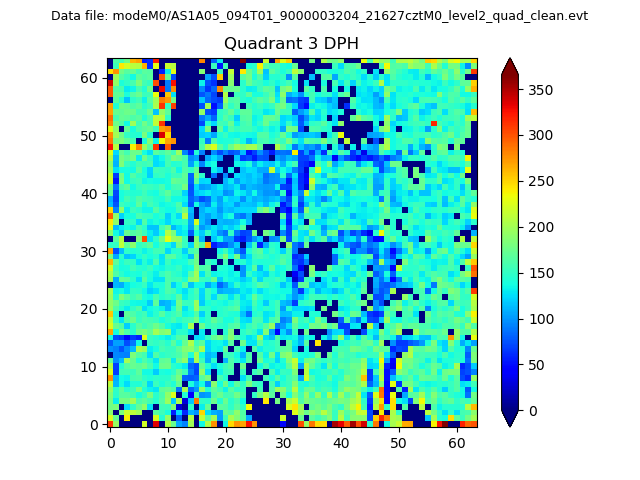 |
 |
Quadrant C |
| Plot type | Count rate plots | Images |
|---|---|---|
| Comparison with Poisson distribution Blue bars denote a histogram of data divided into 1 sec bins. Red curve is a Poisson curve with rate = median count rate of data. |
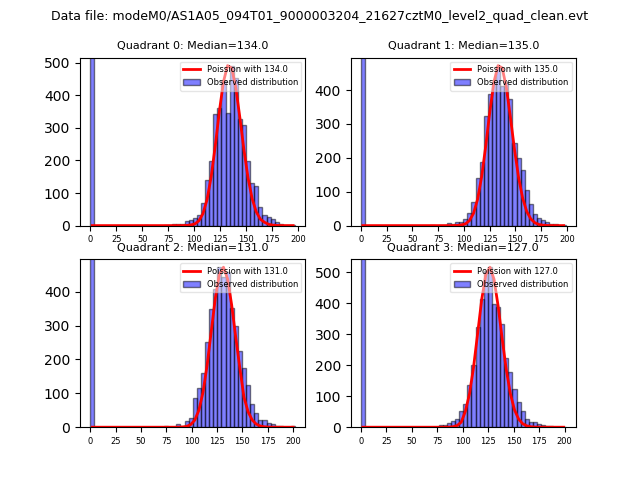 |
 |
| Quadrant-wise count rates Data is divided into 100 sec bins |
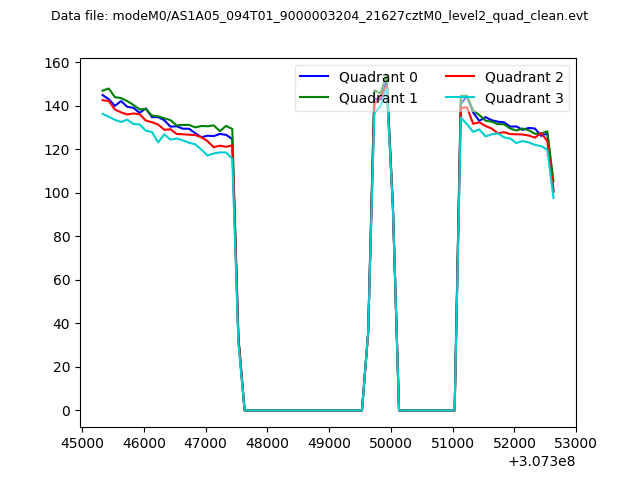 |
|
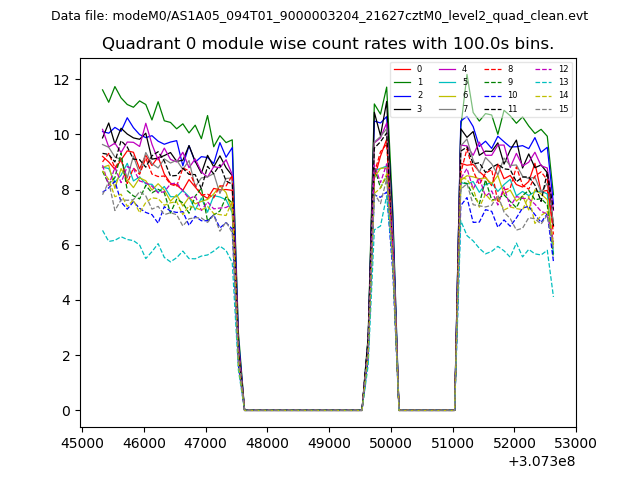
| Module-wise count rates for Quadrant A Data is divided into 100 sec bins |
 |
 |
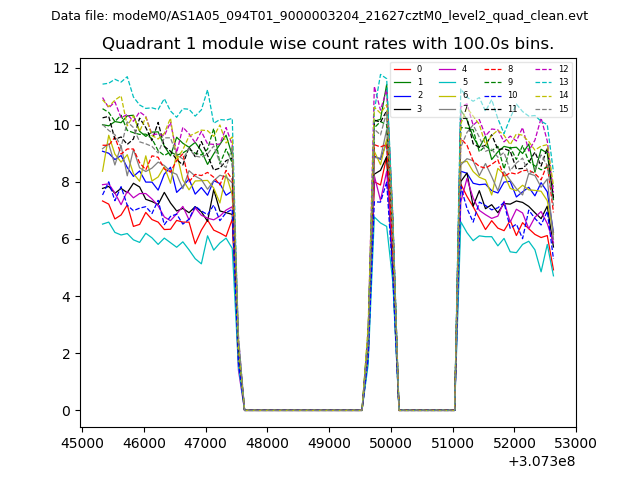
| Module-wise count rates for Quadrant B Data is divided into 100 sec bins |
 |
 |
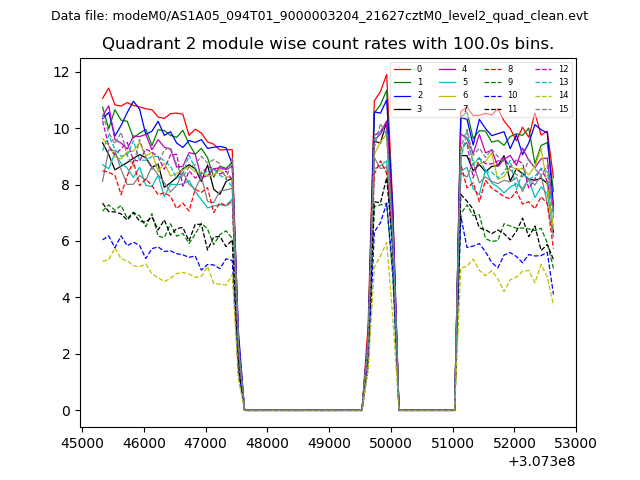
| Module-wise count rates for Quadrant C Data is divided into 100 sec bins |
 |
 |
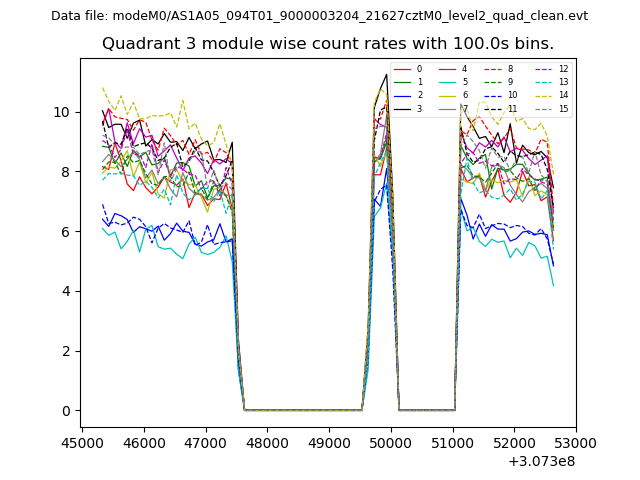
| Module-wise count rates for Quadrant D Data is divided into 100 sec bins |
 |
 |
| Parameter | Plot |
|---|---|
| CZT HV Monitor | 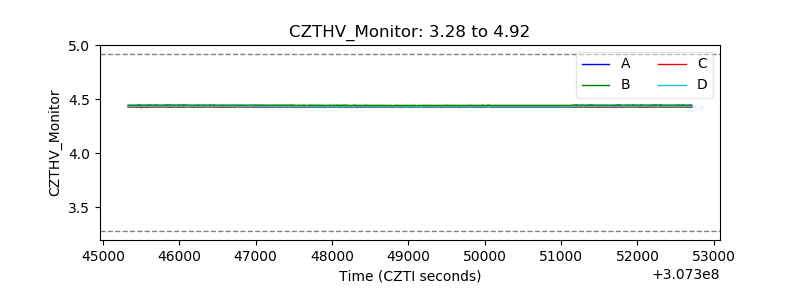 |
| D_VDD | 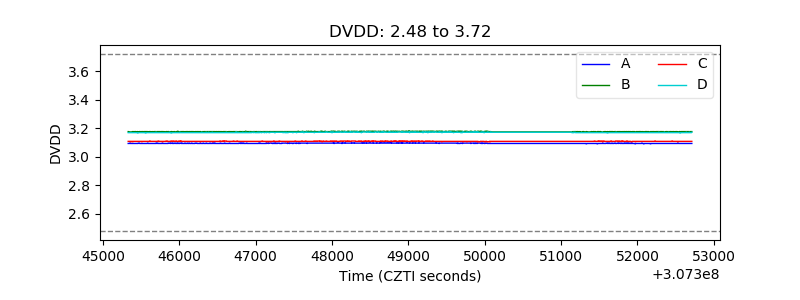 |
| Temperature 1 | 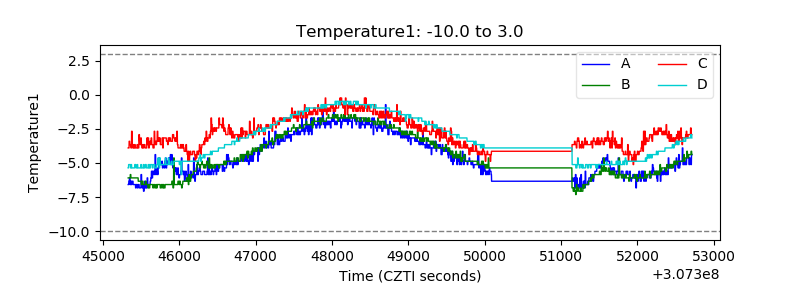 |
| Veto HV Monitor | 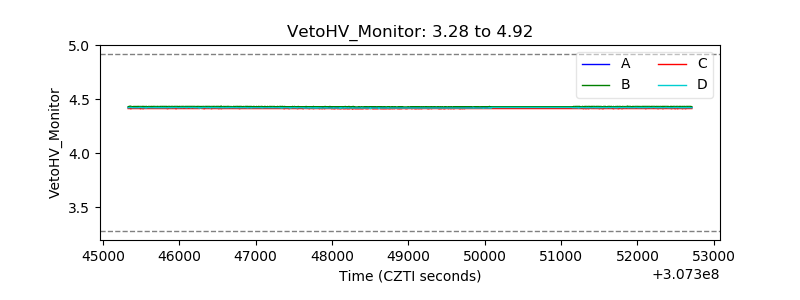 |
| Veto LLD | 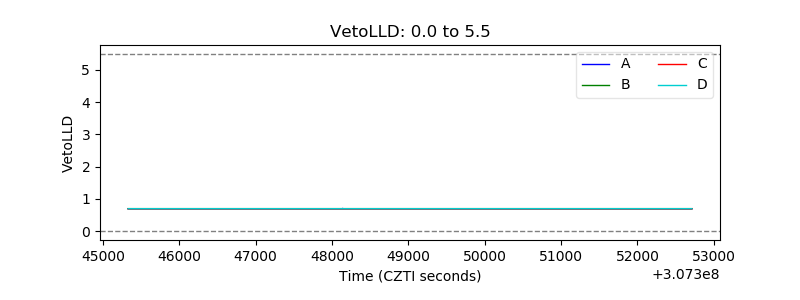 |
| Alpha Counter | 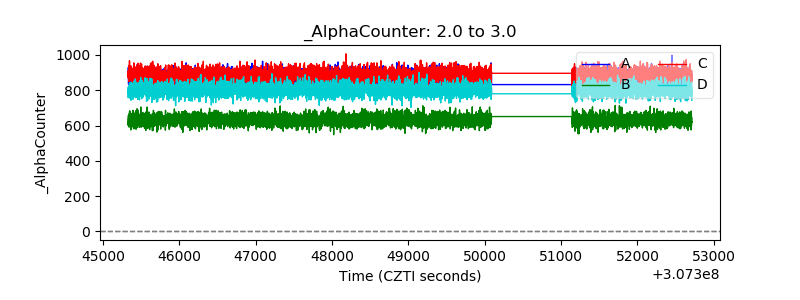 |
| _CPM_Rate | 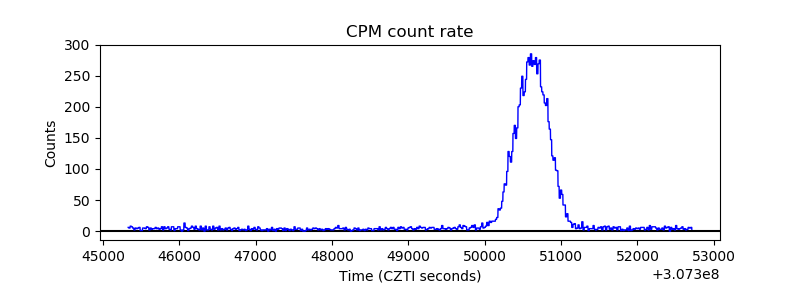 |
| CZT Counter |  |
| +2.5 Volts monitor |  |
| +5 Volts monitor | 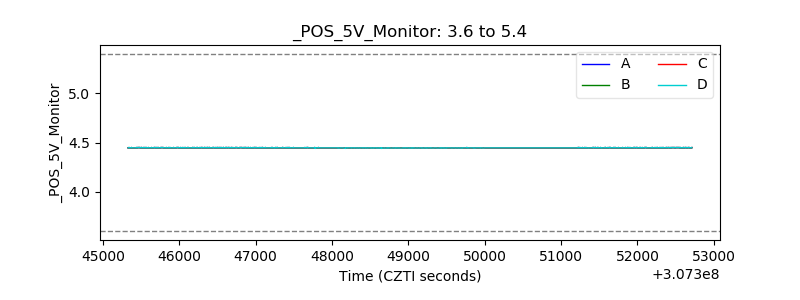 |
| _ROLL_ROT | 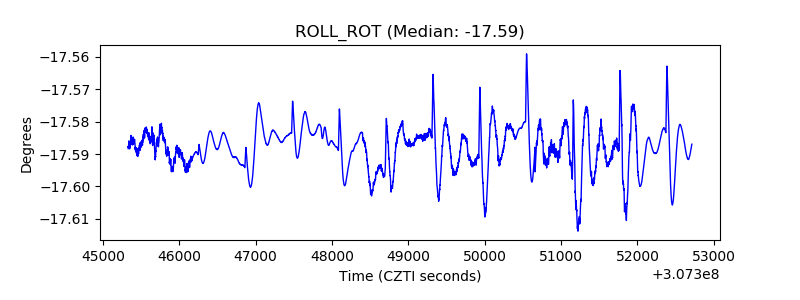 |
| _Roll_DEC | 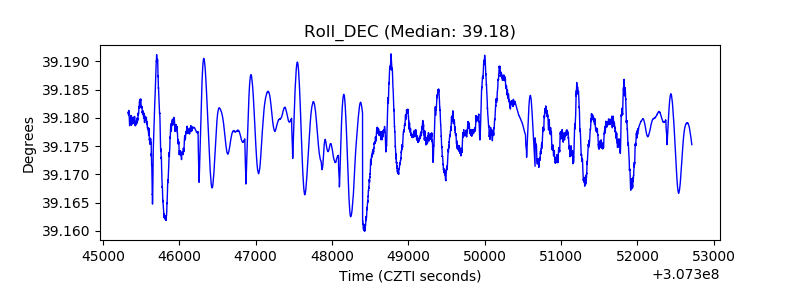 |
| _Roll_RA | 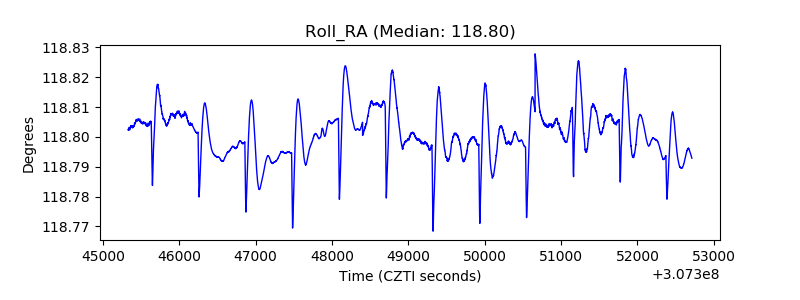 |
| Veto Counter | 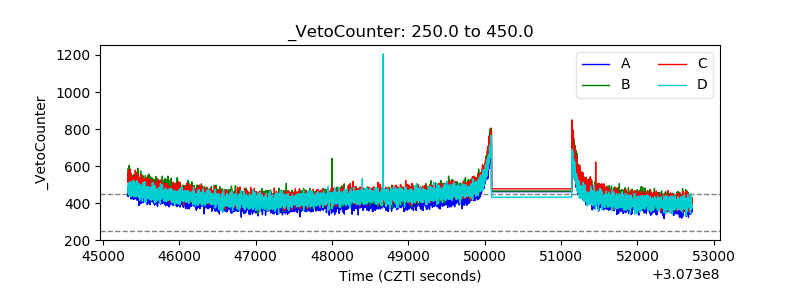 |