| Param | Original file | Final file |
|---|---|---|
| Filename | modeM0/AS1A05_094T01_9000003204_21629cztM0_level2.evt | modeM0/AS1A05_094T01_9000003204_21629cztM0_level2_quad_clean.evt |
| Size (bytes) | 332,285,760 | 50,123,520 |
| Size | 316.9 MB | 47.8 MB |
| Events in quadrant A | 2,100,950 | 302,778 |
| Events in quadrant B | 2,370,088 | 307,403 |
| Events in quadrant C | 2,079,922 | 297,827 |
| Events in quadrant D | 3,200,964 | 288,421 |
| Mode M0 | |||
|---|---|---|---|
| Quadrant | BADHDUFLAG | Total packets | Discarded packets |
| A | 0 | 9205 | 0 |
| B | 0 | 9882 | 0 |
| C | 0 | 9160 | 0 |
| D | 0 | 12492 | 0 |
| Mode SS | |||
|---|---|---|---|
| Quadrant | BADHDUFLAG | Total packets | Discarded packets |
| A | 0 | 92 | 0 |
| B | 0 | 92 | 0 |
| C | 0 | 92 | 0 |
| D | 0 | 92 | 0 |
| Quadrant | Total seconds | Saturated seconds | Saturation percentage |
|---|---|---|---|
| A | 4562 | 3 | 0.065761% |
| B | 4563 | 28 | 0.613631% |
| C | 4563 | 13 | 0.284900% |
| D | 4563 | 285 | 6.245891% |
Noise dominated data is calculated using 1-second bins in cleaned event files. If a bin has >2000 counts, and if more than 50% of those come from <1% of pixels, then it is considered to be noise-dominated and hence unusable.
| Quadrant | # 1 sec bins | Bins with >0 counts | Bins with >2000 counts | High rate bins dominated by noise | Noise dominated (total time) | Noise dominated (detector-on time) | Marked lightcurve |
|---|---|---|---|---|---|---|---|
| A | 4562 | 4562 | 0 | 0 | 0.00% | 0.00% | 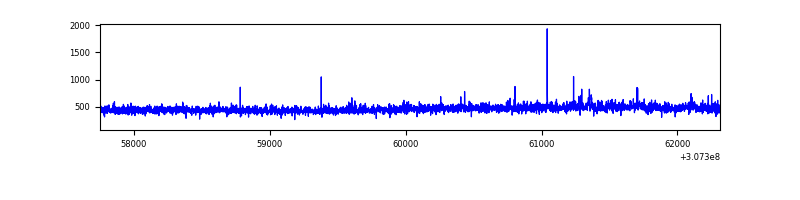 |
| B | 4563 | 4563 | 20 | 20 | 0.44% | 0.44% | 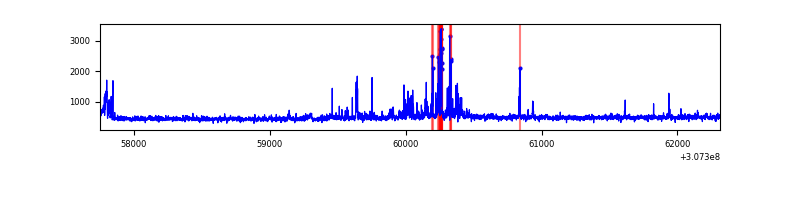 |
| C | 4563 | 4563 | 0 | 0 | 0.00% | 0.00% | 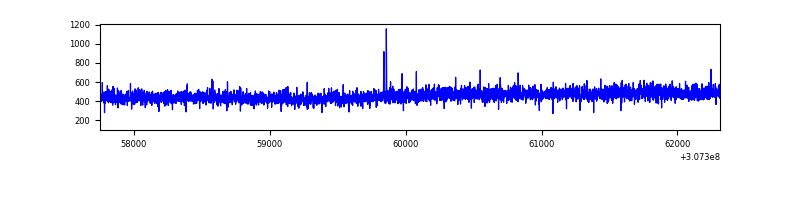 |
| D | 4563 | 4563 | 164 | 164 | 3.59% | 3.59% | 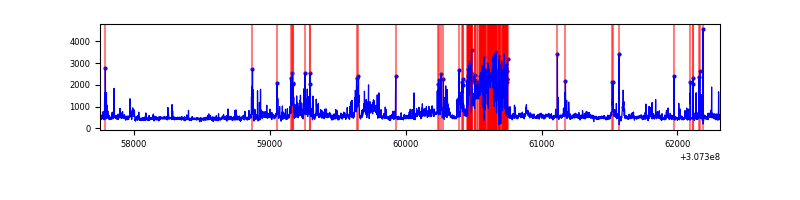 |
Top three noisy pixels from each quadrant. If the there are fewer than three noisy pixels in the level2.evt file, extra rows are filled as -1
| Pixel properties | Quadrant properties | ||||||
|---|---|---|---|---|---|---|---|
| Quadrant | DetID | PixID | Counts | Sigma | Mean | Median | Sigma |
| A | 15 | 236 | 32144 | 290.95 | 533 | 521 | 108.7 |
| A | 5 | 16 | 12966 | 114.5 | 533 | 521 | 108.7 |
| A | 13 | 254 | 6719 | 57.03 | 533 | 521 | 108.7 |
| B | 0 | 189 | 163490 | 1604.17 | 528 | 513 | 101.6 |
| B | 6 | 36 | 28219 | 272.7 | 528 | 513 | 101.6 |
| B | 3 | 64 | 27635 | 266.96 | 528 | 513 | 101.6 |
| C | 14 | 238 | 80624 | 663.86 | 511 | 514 | 120.7 |
| C | 10 | 22 | 5772 | 43.57 | 511 | 514 | 120.7 |
| C | 13 | 61 | 3537 | 25.05 | 511 | 514 | 120.7 |
| D | 7 | 38 | 538363 | 4346.63 | 502 | 489 | 123.7 |
| D | 7 | 238 | 393912 | 3179.3 | 502 | 489 | 123.7 |
| D | 1 | 52 | 148947 | 1199.71 | 502 | 489 | 123.7 |
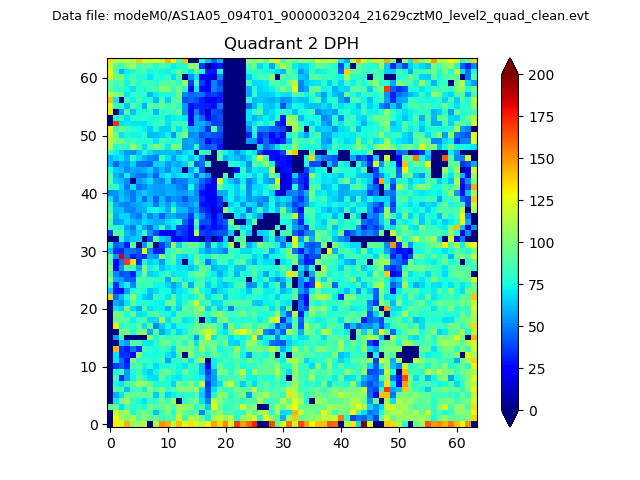
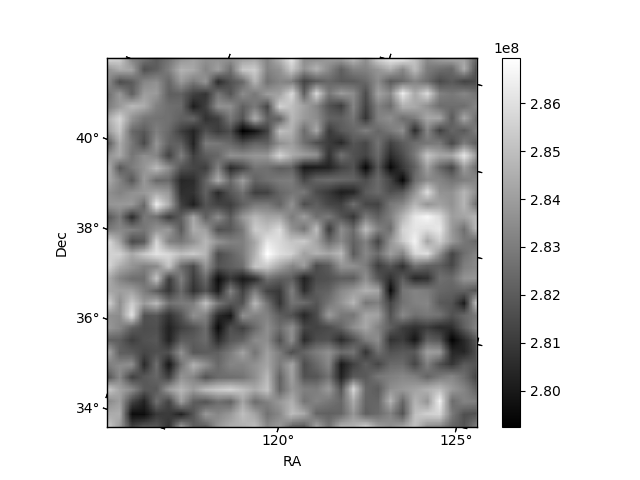
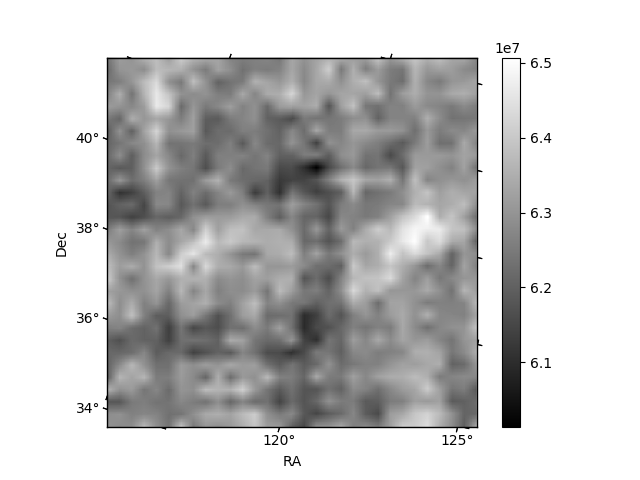
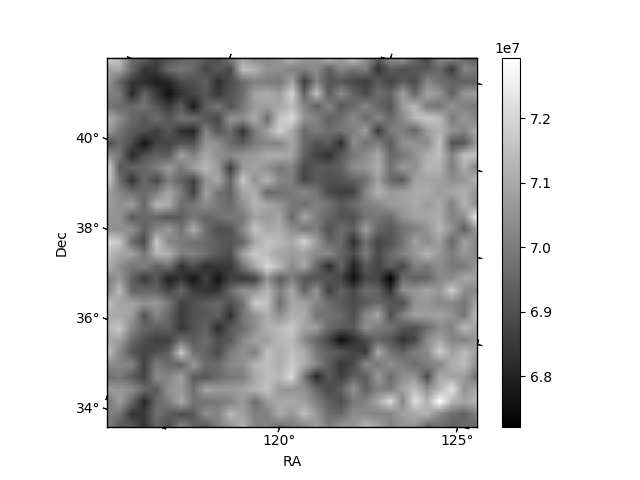
Histogram calculated using DETX and DETY for each event in the final _common_clean file
| Quadrant A | 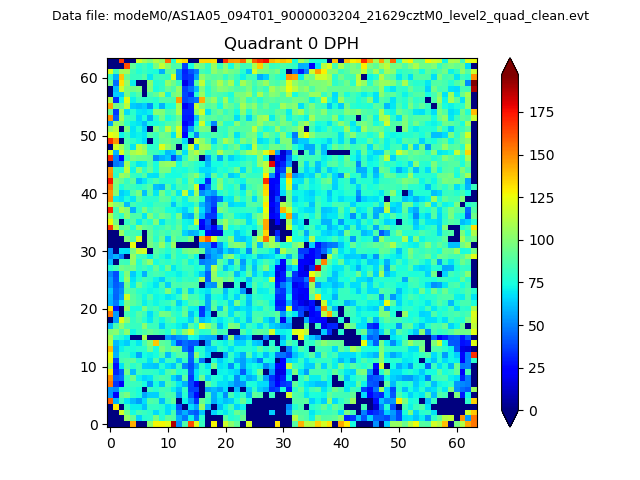 |
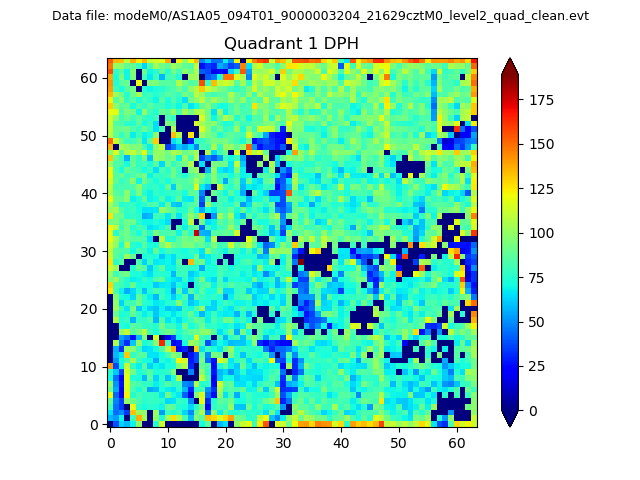 |
Quadrant B |
|---|---|---|---|
| Quadrant D | 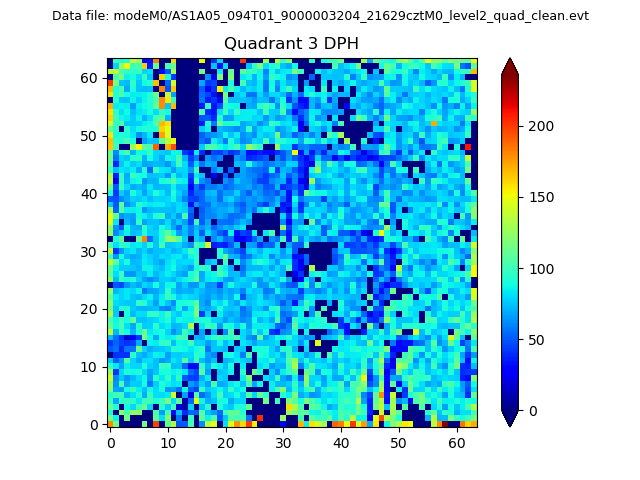 |
 |
Quadrant C |
| Plot type | Count rate plots | Images |
|---|---|---|
| Comparison with Poisson distribution Blue bars denote a histogram of data divided into 1 sec bins. Red curve is a Poisson curve with rate = median count rate of data. |
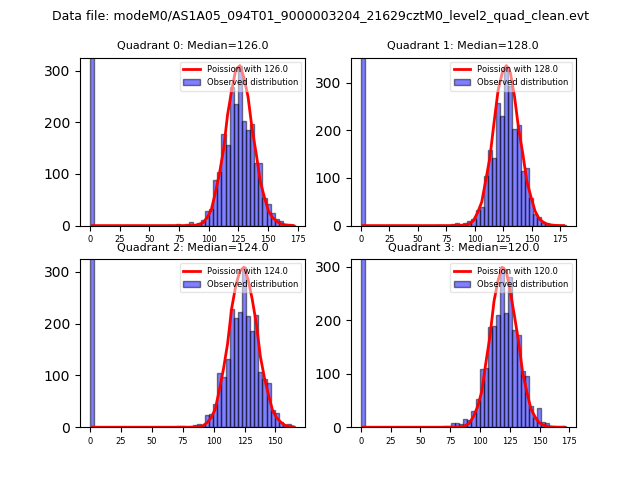 |
 |
| Quadrant-wise count rates Data is divided into 100 sec bins |
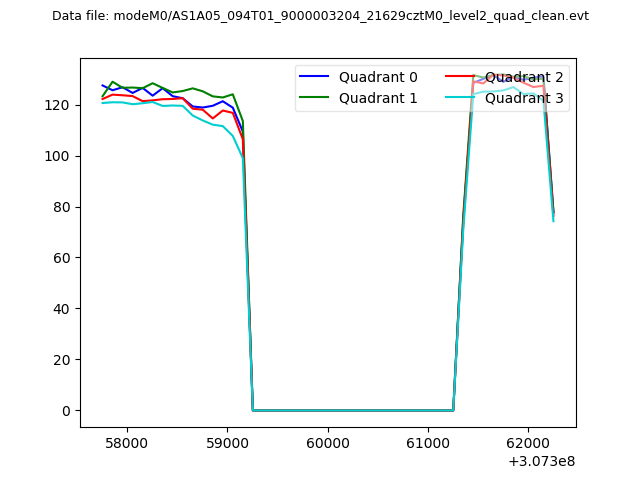 |
|
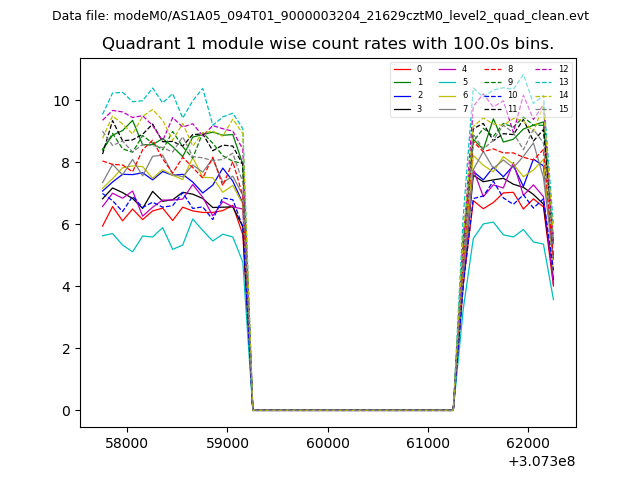
| Module-wise count rates for Quadrant A Data is divided into 100 sec bins |
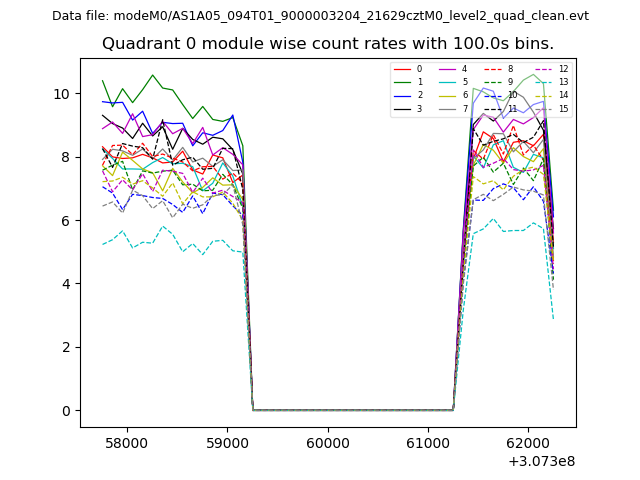 |
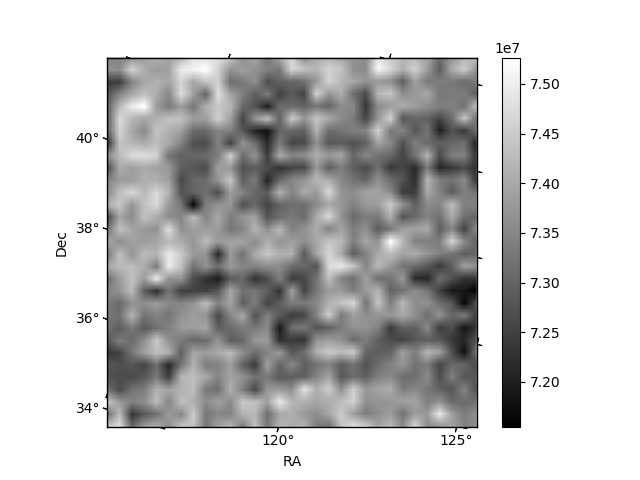 |
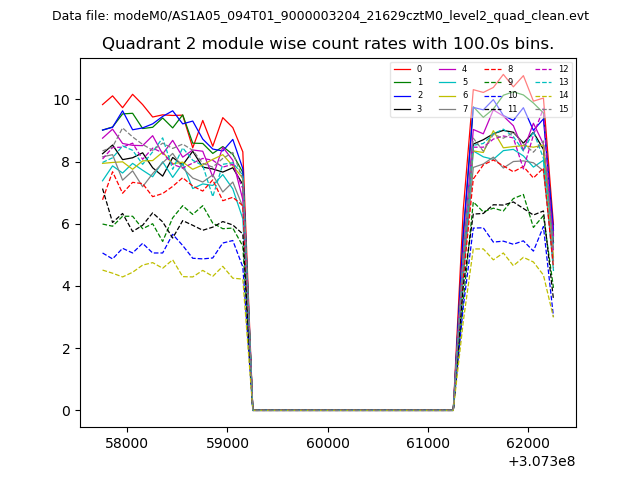
| Module-wise count rates for Quadrant B Data is divided into 100 sec bins |
 |
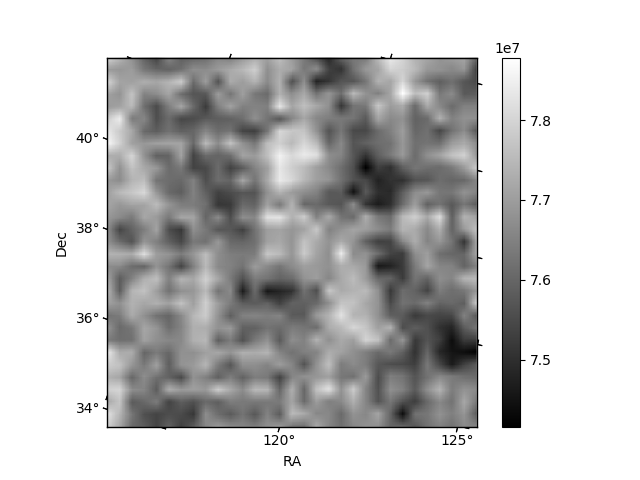 |
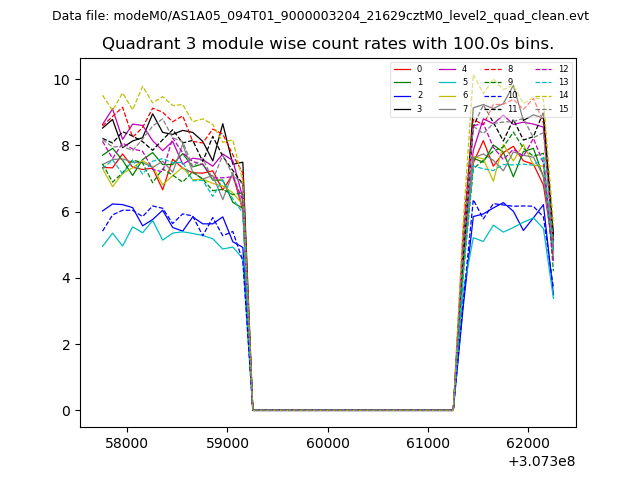
| Module-wise count rates for Quadrant C Data is divided into 100 sec bins |
 |
 |
| Module-wise count rates for Quadrant D Data is divided into 100 sec bins |
 |
 |
| Parameter | Plot |
|---|---|
| CZT HV Monitor | 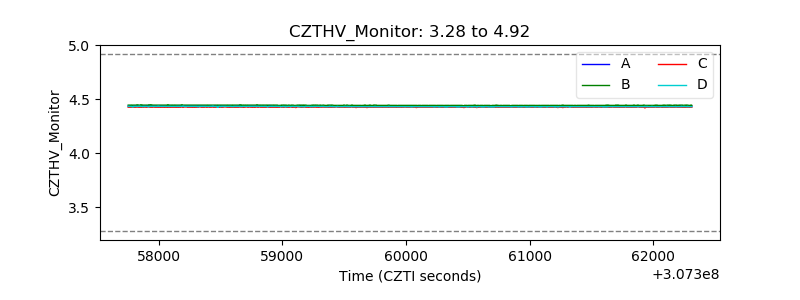 |
| D_VDD | 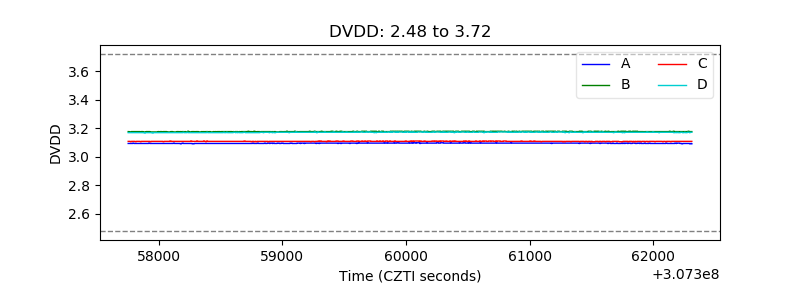 |
| Temperature 1 | 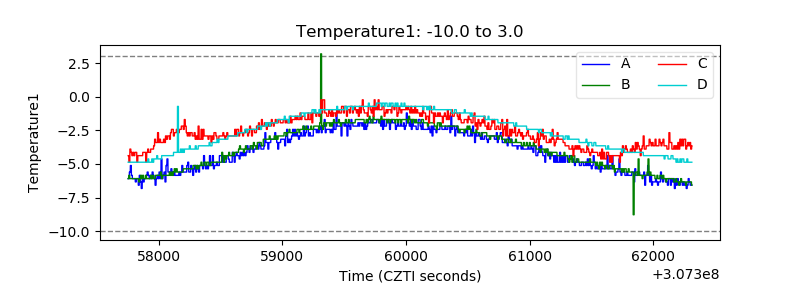 |
| Veto HV Monitor | 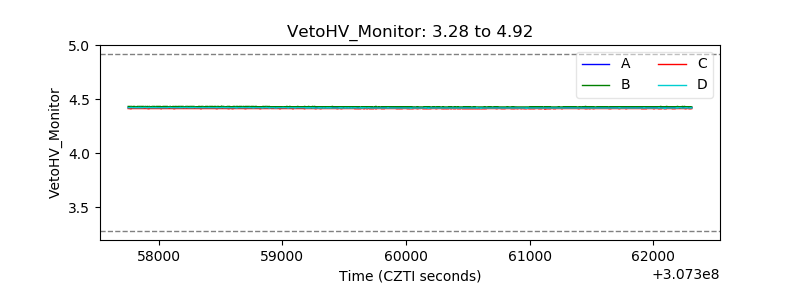 |
| Veto LLD | 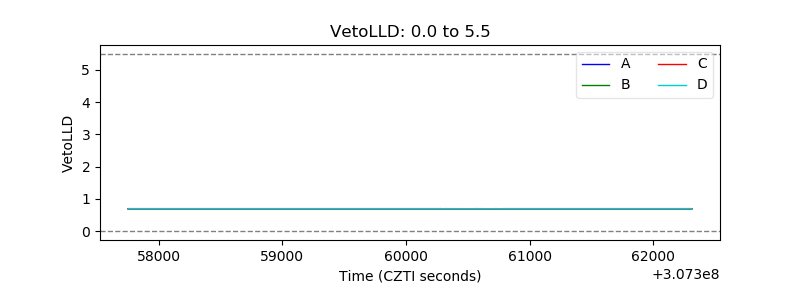 |
| Alpha Counter | 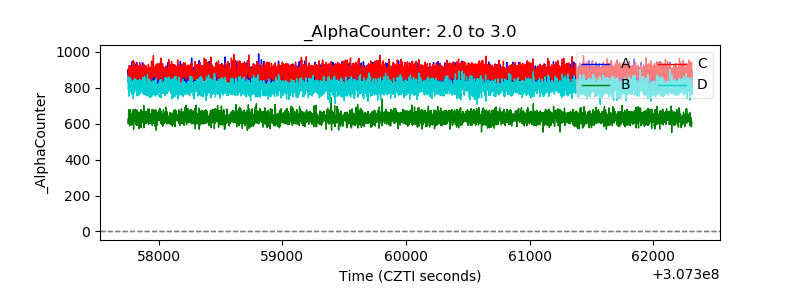 |
| _CPM_Rate | 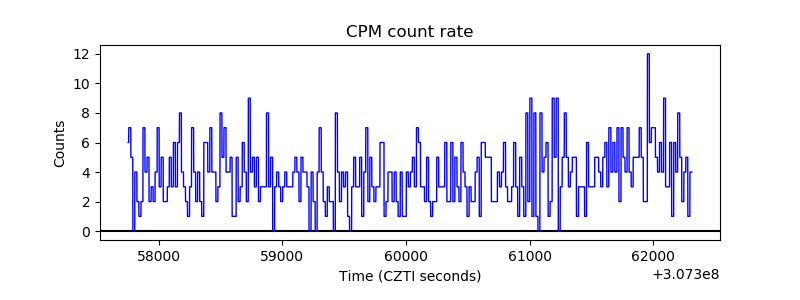 |
| CZT Counter | 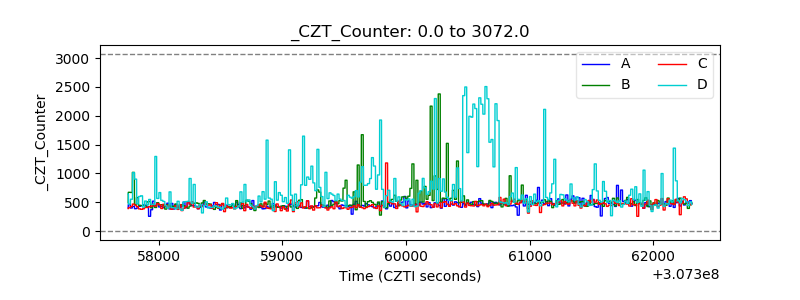 |
| +2.5 Volts monitor |  |
| +5 Volts monitor |  |
| _ROLL_ROT |  |
| _Roll_DEC | 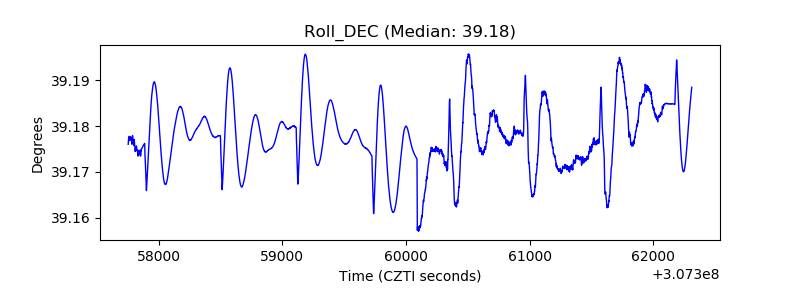 |
| _Roll_RA | 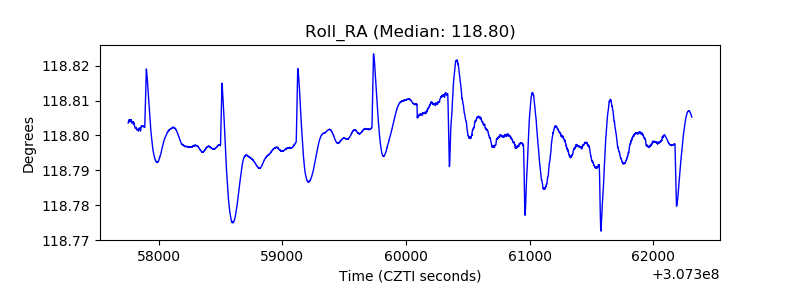 |
| Veto Counter | 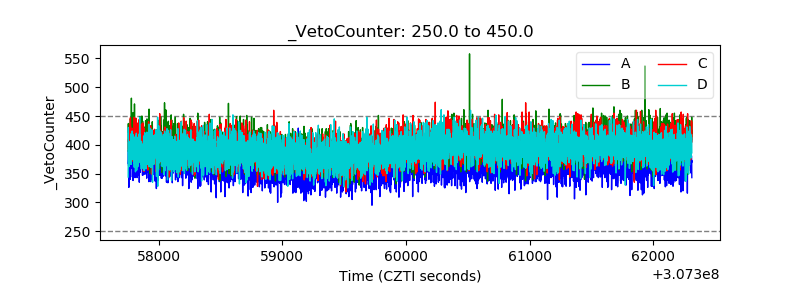 |