| Param | Original file | Final file |
|---|---|---|
| Filename | modeM0/AS1A06_002T02_9000003206cztM0_level2.fits | modeM0/AS1A06_002T02_9000003206cztM0_level2_quad_clean.evt |
| Size (bytes) | 1,867,118,400 | 1,629,025,920 |
| Size | 1.7 GB | 1.5 GB |
| Events in quadrant A | 11,504,608 | 9,501,288 |
| Events in quadrant B | 11,081,028 | 9,566,939 |
| Events in quadrant C | 11,211,056 | 9,055,608 |
| Events in quadrant D | 9,524,520 | 7,988,718 |
| Mode M0 | |||
|---|---|---|---|
| Quadrant | BADHDUFLAG | Total packets | Discarded packets |
| A | 0 | 402385 | 0 |
| B | 0 | 419335 | 0 |
| C | 0 | 401452 | 0 |
| D | 0 | 519770 | 0 |
| Mode M9 | |||
|---|---|---|---|
| Quadrant | BADHDUFLAG | Total packets | Discarded packets |
| A | 0 | 299 | 0 |
| B | 0 | 299 | 0 |
| C | 0 | 299 | 0 |
| D | 0 | 299 | 0 |
| Mode SS | |||
|---|---|---|---|
| Quadrant | BADHDUFLAG | Total packets | Discarded packets |
| A | 0 | 3924 | 0 |
| B | 0 | 3924 | 0 |
| C | 0 | 3924 | 0 |
| D | 0 | 3924 | 0 |
| Quadrant | Total seconds | Saturated seconds | Saturation percentage |
|---|---|---|---|
| A | 193020 | 2244 | 1.162574% |
| B | 193021 | 3276 | 1.697225% |
| C | 193023 | 3140 | 1.626749% |
| D | 193022 | 9776 | 5.064708% |
Noise dominated data is calculated using 1-second bins in cleaned event files. If a bin has >2000 counts, and if more than 50% of those come from <1% of pixels, then it is considered to be noise-dominated and hence unusable.
| Quadrant | # 1 sec bins | Bins with >0 counts | Bins with >2000 counts | High rate bins dominated by noise | Noise dominated (total time) | Noise dominated (detector-on time) | Marked lightcurve |
|---|---|---|---|---|---|---|---|
| A | 222668 | 193012 | 0 | 0 | 0.00% | 0.00% |  |
| B | 222668 | 193007 | 0 | 0 | 0.00% | 0.00% |  |
| C | 222668 | 193025 | 0 | 0 | 0.00% | 0.00% |  |
| D | 222669 | 192986 | 0 | 0 | 0.00% | 0.00% |  |
Top three noisy pixels from each quadrant. If the there are fewer than three noisy pixels in the level2.evt file, extra rows are filled as -1
| Pixel properties | Quadrant properties | ||||||
|---|---|---|---|---|---|---|---|
| Quadrant | DetID | PixID | Counts | Sigma | Mean | Median | Sigma |
| A | 0 | 29 | 11161 | 11.49 | 2994 | 2812 | 726.9 |
| A | 7 | 110 | 9257 | 8.87 | 2994 | 2812 | 726.9 |
| A | 0 | 30 | 8665 | 8.05 | 2994 | 2812 | 726.9 |
| B | 2 | 9 | 8957 | 10.8 | 2932 | 2799 | 570.1 |
| B | 2 | 8 | 7556 | 8.34 | 2932 | 2799 | 570.1 |
| B | 5 | 128 | 7212 | 7.74 | 2932 | 2799 | 570.1 |
| C | 12 | 241 | 8098 | 7.03 | 2963 | 2765 | 758.9 |
| C | 9 | 209 | 7538 | 6.29 | 2963 | 2765 | 758.9 |
| C | 12 | 250 | 7508 | 6.25 | 2963 | 2765 | 758.9 |
| D | 3 | 14 | 6813 | 6.03 | 2719 | 2472 | 720.0 |
| D | 7 | 3 | 6724 | 5.91 | 2719 | 2472 | 720.0 |
| D | 6 | 231 | 6617 | 5.76 | 2719 | 2472 | 720.0 |
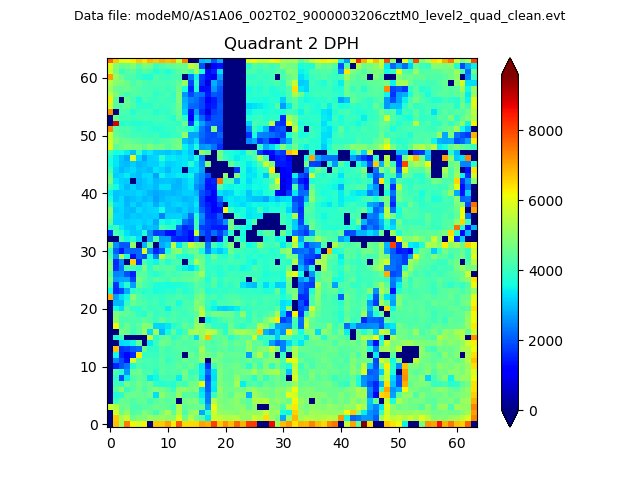
Histogram calculated using DETX and DETY for each event in the final _common_clean file
| Quadrant A |  |
 |
Quadrant B |
|---|---|---|---|
| Quadrant D | 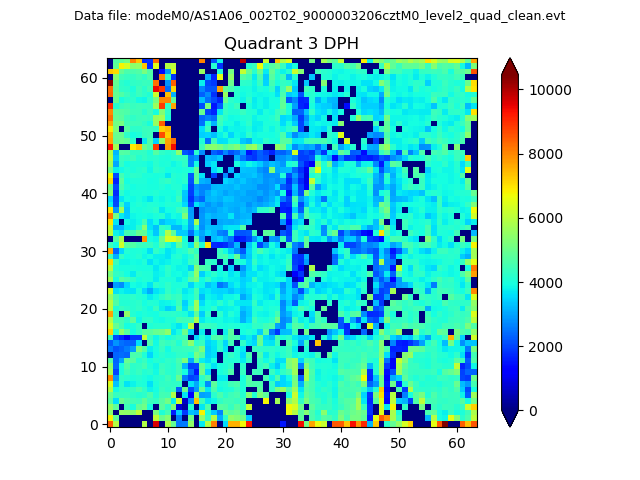 |
 |
Quadrant C |
| Plot type | Count rate plots | Images |
|---|---|---|
| Comparison with Poisson distribution Blue bars denote a histogram of data divided into 1 sec bins. Red curve is a Poisson curve with rate = median count rate of data. |
 |
 |
| Quadrant-wise count rates Data is divided into 100 sec bins |
 |
|
| Module-wise count rates for Quadrant A Data is divided into 100 sec bins |
 |
 |
| Module-wise count rates for Quadrant B Data is divided into 100 sec bins |
 |
 |
| Module-wise count rates for Quadrant C Data is divided into 100 sec bins |
 |
 |
| Module-wise count rates for Quadrant D Data is divided into 100 sec bins |
 |
 |
| Parameter | Plot |
|---|---|
| CZT HV Monitor |  |
| D_VDD |  |
| Temperature 1 |  |
| Veto HV Monitor |  |
| Veto LLD |  |
| Alpha Counter |  |
| _CPM_Rate |  |
| CZT Counter |  |
| +2.5 Volts monitor |  |
| +5 Volts monitor |  |
| _ROLL_ROT |  |
| _Roll_DEC |  |
| _Roll_RA | 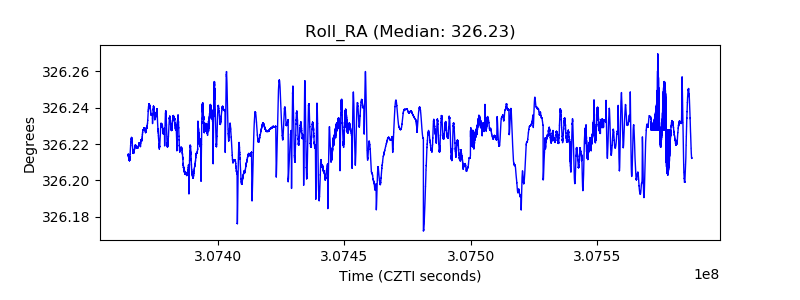 |
| Veto Counter |  |