| Param | Original file | Final file |
|---|---|---|
| Filename | modeM0/AS1A06_002T02_9000003206_21630cztM0_level2.evt | modeM0/AS1A06_002T02_9000003206_21630cztM0_level2_quad_clean.evt |
| Size (bytes) | 478,817,280 | 93,430,080 |
| Size | 456.6 MB | 89.1 MB |
| Events in quadrant A | 3,250,935 | 600,459 |
| Events in quadrant B | 3,436,852 | 611,509 |
| Events in quadrant C | 3,262,466 | 582,972 |
| Events in quadrant D | 4,086,741 | 558,892 |
| Mode M0 | |||
|---|---|---|---|
| Quadrant | BADHDUFLAG | Total packets | Discarded packets |
| A | 0 | 14149 | 1 |
| B | 0 | 14373 | 1 |
| C | 0 | 14098 | 1 |
| D | 0 | 16641 | 1 |
| Mode M9 | |||
|---|---|---|---|
| Quadrant | BADHDUFLAG | Total packets | Discarded packets |
| A | 0 | 1 | 0 |
| B | 0 | 1 | 0 |
| C | 0 | 1 | 0 |
| D | 0 | 1 | 0 |
| Mode SS | |||
|---|---|---|---|
| Quadrant | BADHDUFLAG | Total packets | Discarded packets |
| A | 0 | 138 | 0 |
| B | 0 | 138 | 0 |
| C | 0 | 138 | 0 |
| D | 0 | 138 | 0 |
| Quadrant | Total seconds | Saturated seconds | Saturation percentage |
|---|---|---|---|
| A | 6828 | 219 | 3.207381% |
| B | 6828 | 239 | 3.500293% |
| C | 6828 | 242 | 3.544230% |
| D | 6829 | 266 | 3.895153% |
Noise dominated data is calculated using 1-second bins in cleaned event files. If a bin has >2000 counts, and if more than 50% of those come from <1% of pixels, then it is considered to be noise-dominated and hence unusable.
| Quadrant | # 1 sec bins | Bins with >0 counts | Bins with >2000 counts | High rate bins dominated by noise | Noise dominated (total time) | Noise dominated (detector-on time) | Marked lightcurve |
|---|---|---|---|---|---|---|---|
| A | 6903 | 6829 | 0 | 0 | 0.00% | 0.00% | 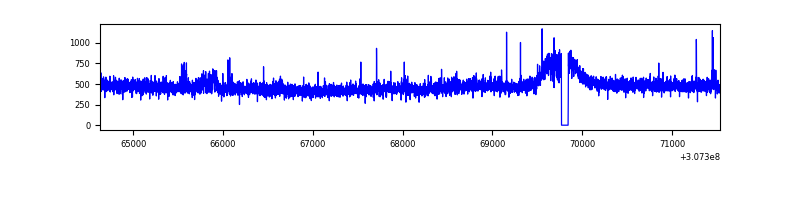 |
| B | 6903 | 6829 | 2 | 2 | 0.03% | 0.03% | 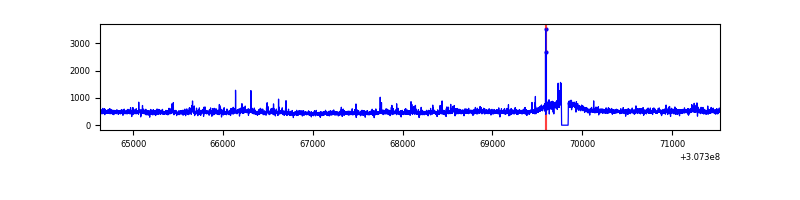 |
| C | 6903 | 6829 | 0 | 0 | 0.00% | 0.00% | 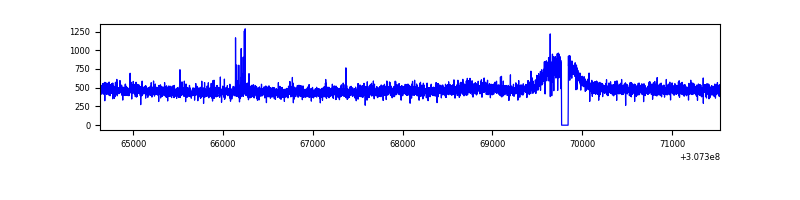 |
| D | 6904 | 6830 | 52 | 52 | 0.75% | 0.76% | 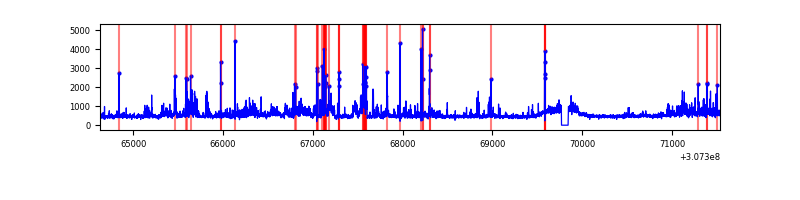 |
Top three noisy pixels from each quadrant. If the there are fewer than three noisy pixels in the level2.evt file, extra rows are filled as -1
| Pixel properties | Quadrant properties | ||||||
|---|---|---|---|---|---|---|---|
| Quadrant | DetID | PixID | Counts | Sigma | Mean | Median | Sigma |
| A | 15 | 236 | 39080 | 228.28 | 828 | 809 | 167.6 |
| A | 5 | 16 | 19294 | 110.26 | 828 | 809 | 167.6 |
| A | 13 | 254 | 8940 | 48.5 | 828 | 809 | 167.6 |
| B | 0 | 219 | 36668 | 227.25 | 822 | 799 | 157.8 |
| B | 0 | 229 | 32087 | 198.23 | 822 | 799 | 157.8 |
| B | 0 | 197 | 30410 | 187.6 | 822 | 799 | 157.8 |
| C | 14 | 238 | 124131 | 658.89 | 797 | 798 | 187.2 |
| C | 0 | 207 | 11758 | 58.55 | 797 | 798 | 187.2 |
| C | 8 | 128 | 8473 | 41.0 | 797 | 798 | 187.2 |
| D | 1 | 52 | 417547 | 2103.83 | 806 | 782 | 198.1 |
| D | 7 | 238 | 288425 | 1452.02 | 806 | 782 | 198.1 |
| D | 2 | 136 | 176307 | 886.05 | 806 | 782 | 198.1 |
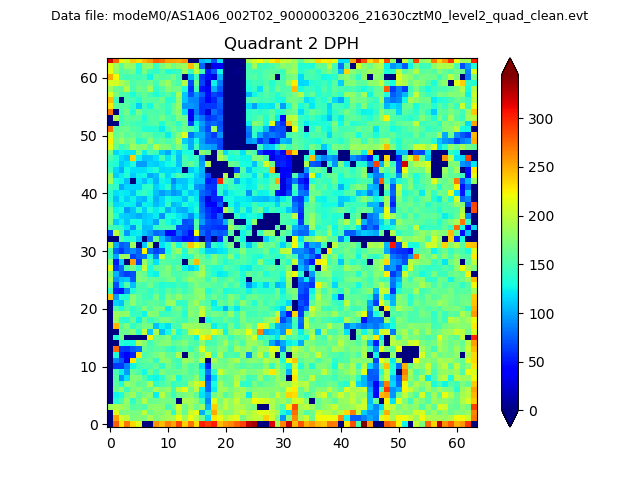
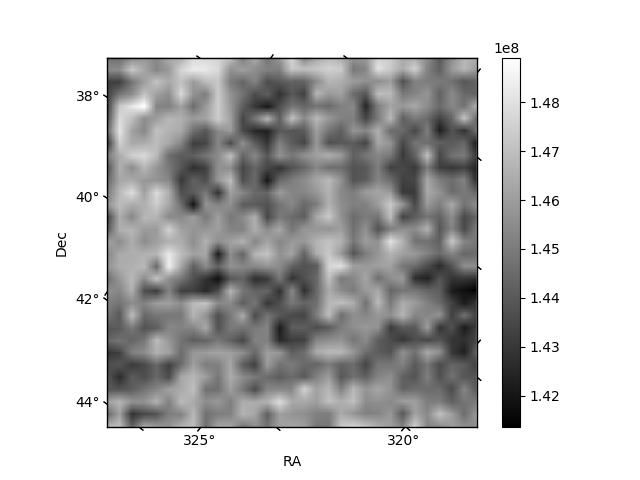
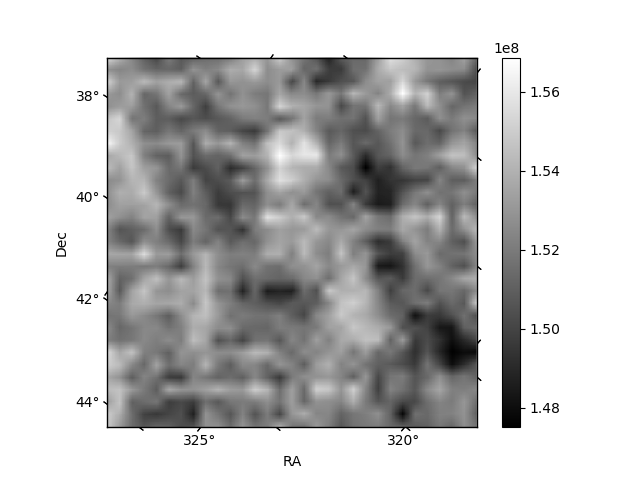
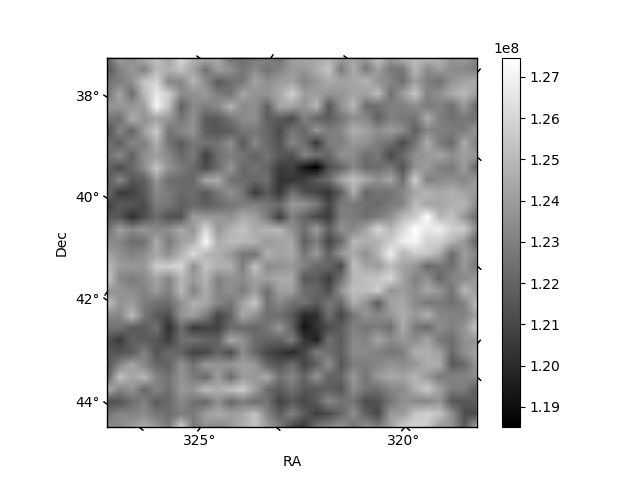
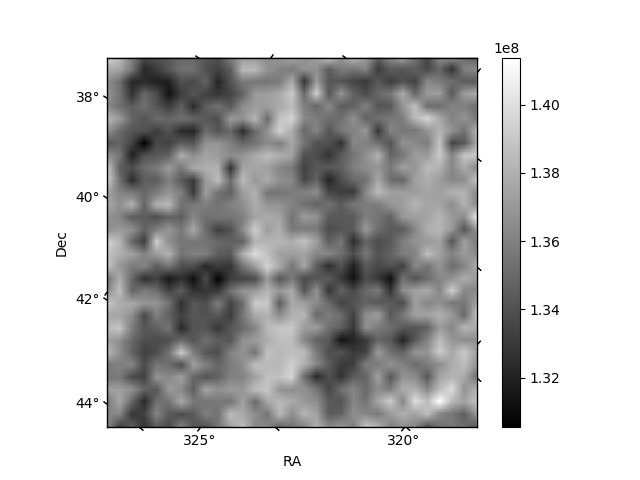
Histogram calculated using DETX and DETY for each event in the final _common_clean file
| Quadrant A |  |
 |
Quadrant B |
|---|---|---|---|
| Quadrant D | 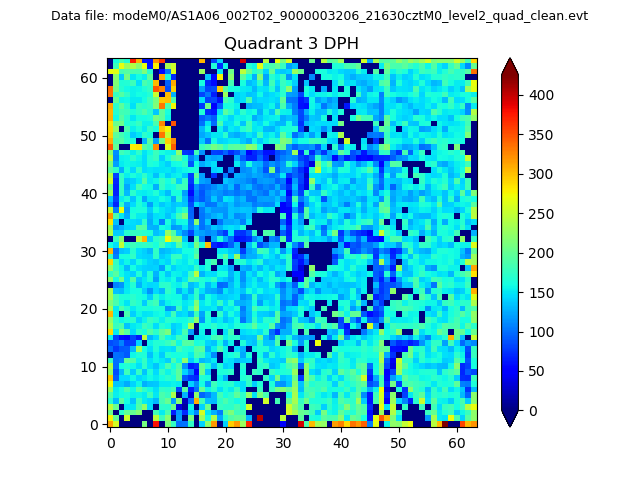 |
 |
Quadrant C |
| Plot type | Count rate plots | Images |
|---|---|---|
| Comparison with Poisson distribution Blue bars denote a histogram of data divided into 1 sec bins. Red curve is a Poisson curve with rate = median count rate of data. |
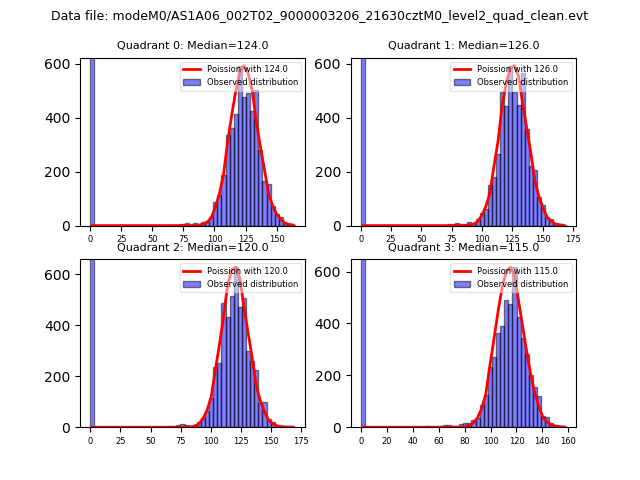 |
 |
| Quadrant-wise count rates Data is divided into 100 sec bins |
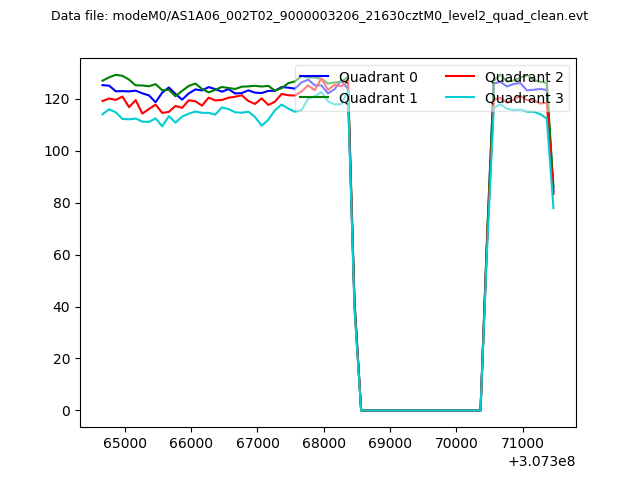 |
|
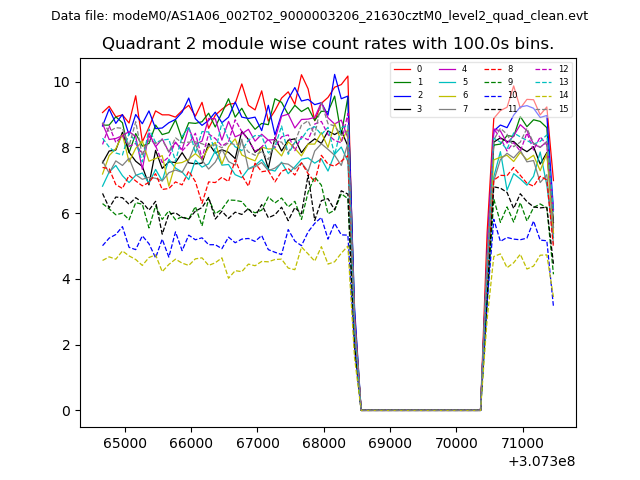
| Module-wise count rates for Quadrant A Data is divided into 100 sec bins |
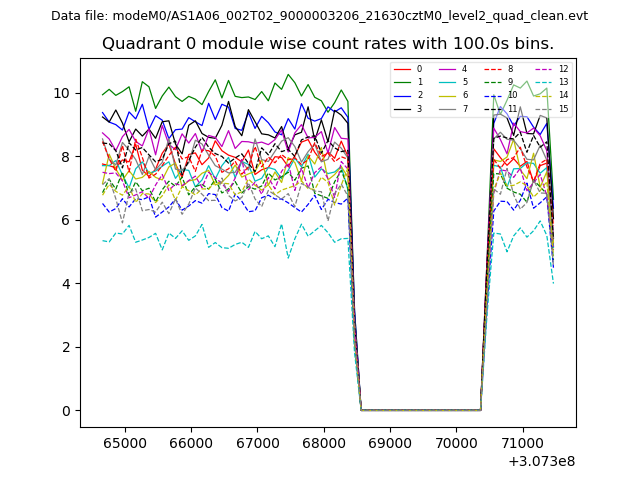 |
 |
| Module-wise count rates for Quadrant B Data is divided into 100 sec bins |
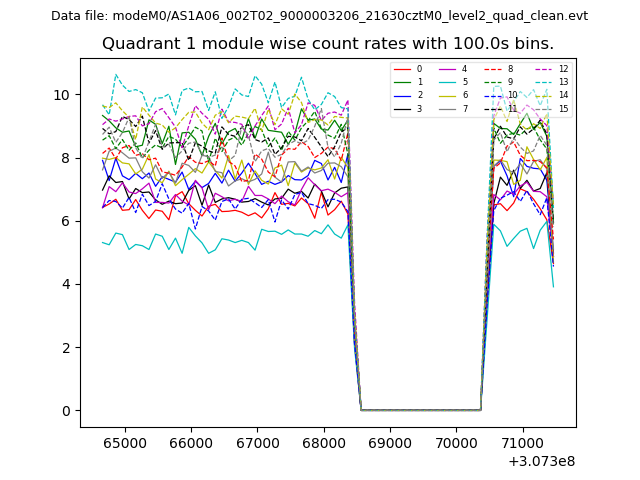 |
 |
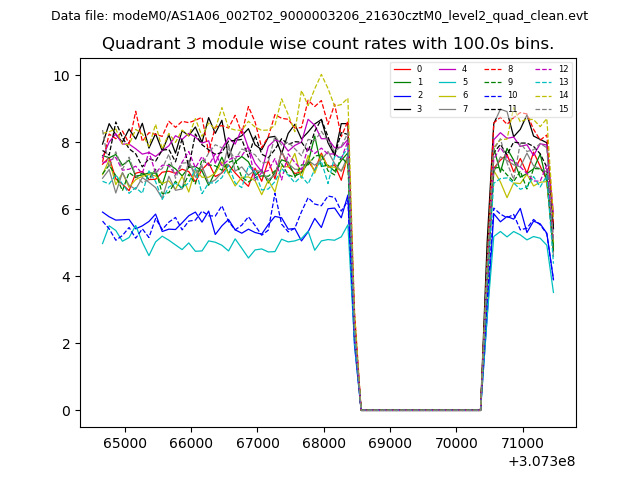
| Module-wise count rates for Quadrant C Data is divided into 100 sec bins |
 |
 |
| Module-wise count rates for Quadrant D Data is divided into 100 sec bins |
 |
 |
| Parameter | Plot |
|---|---|
| CZT HV Monitor | 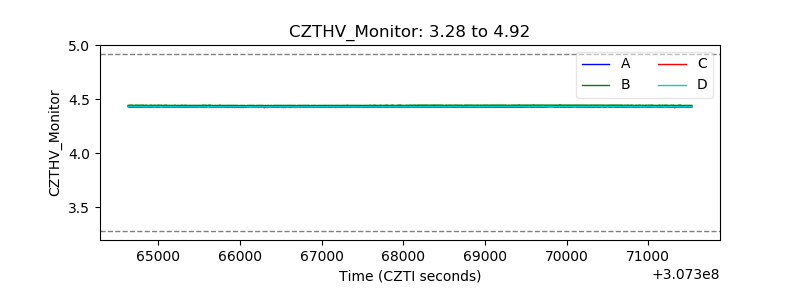 |
| D_VDD | 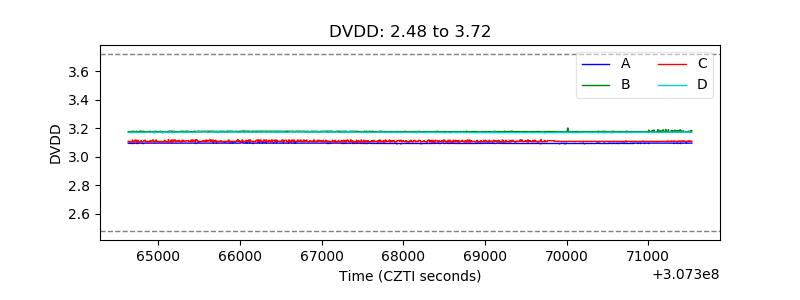 |
| Temperature 1 | 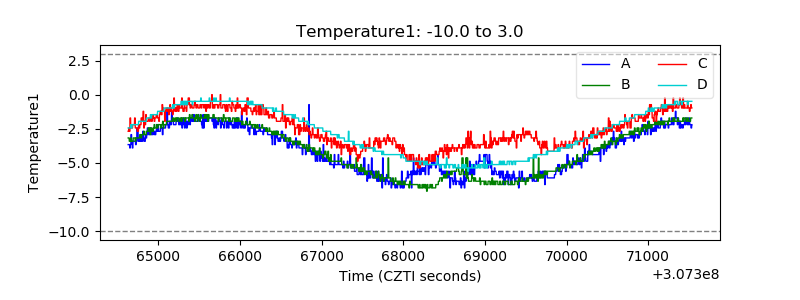 |
| Veto HV Monitor | 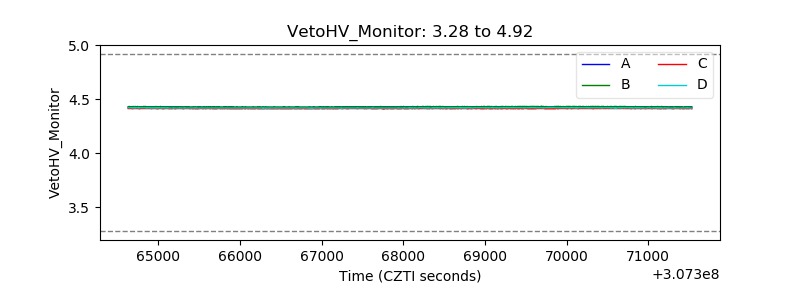 |
| Veto LLD |  |
| Alpha Counter | 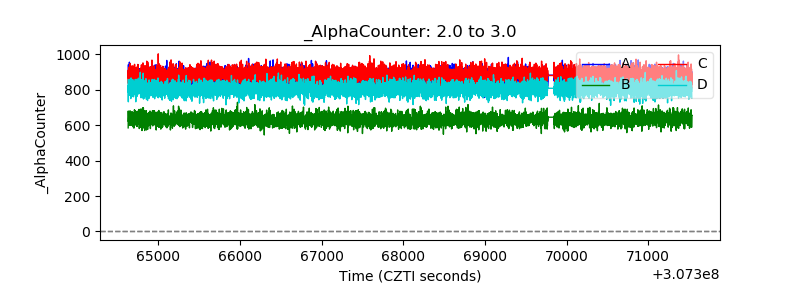 |
| _CPM_Rate | 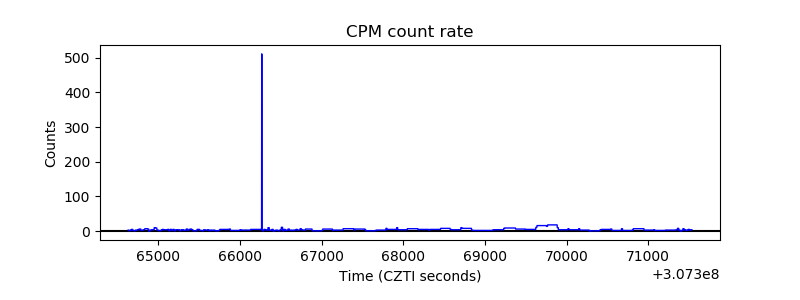 |
| CZT Counter | 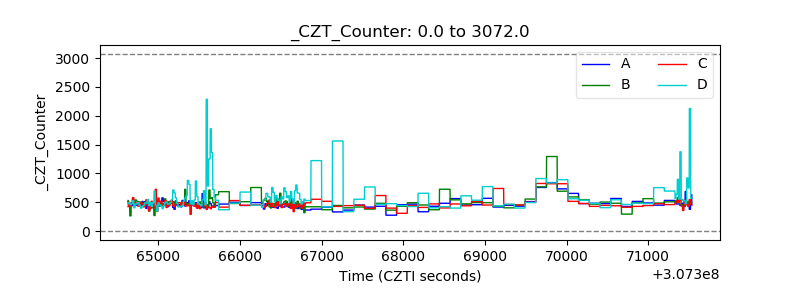 |
| +2.5 Volts monitor |  |
| +5 Volts monitor | 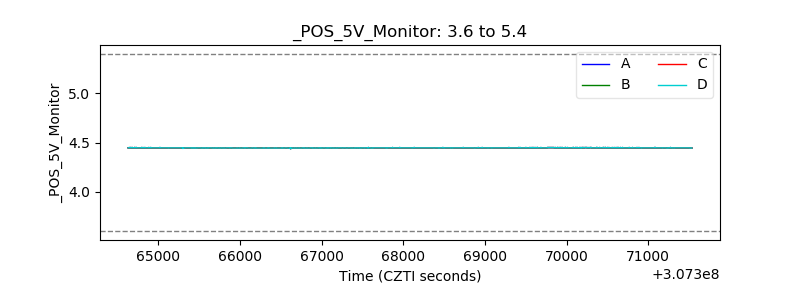 |
| _ROLL_ROT | 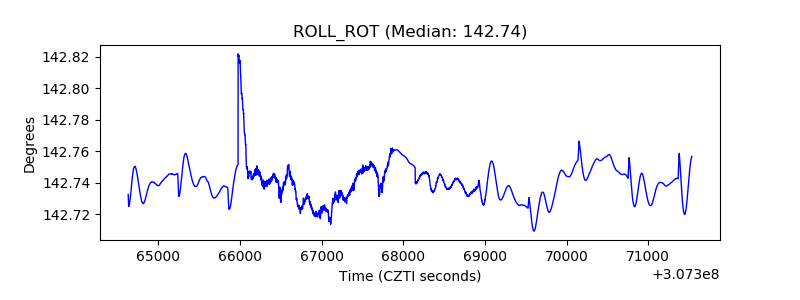 |
| _Roll_DEC | 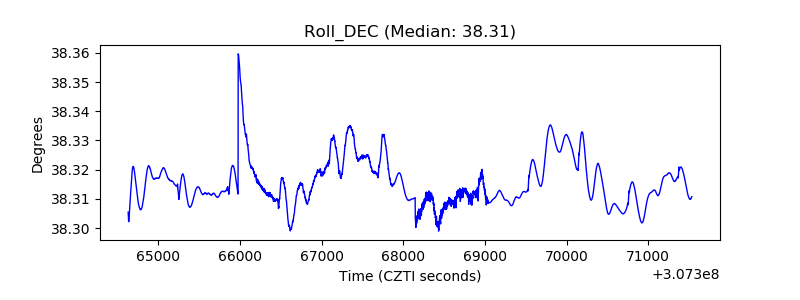 |
| _Roll_RA | 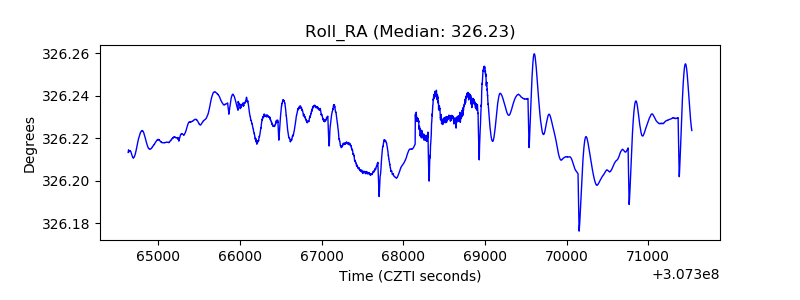 |
| Veto Counter | 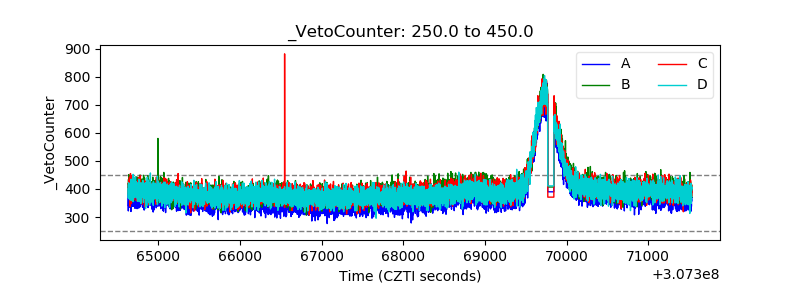 |