| Param | Original file | Final file |
|---|---|---|
| Filename | modeM0/AS1A06_002T02_9000003206_21637cztM0_level2.evt | modeM0/AS1A06_002T02_9000003206_21637cztM0_level2_quad_clean.evt |
| Size (bytes) | 452,885,760 | 94,608,000 |
| Size | 431.9 MB | 90.2 MB |
| Events in quadrant A | 2,989,877 | 615,310 |
| Events in quadrant B | 3,339,932 | 635,236 |
| Events in quadrant C | 3,079,963 | 605,761 |
| Events in quadrant D | 3,878,906 | 570,209 |
| Mode M0 | |||
|---|---|---|---|
| Quadrant | BADHDUFLAG | Total packets | Discarded packets |
| A | 0 | 13015 | 2 |
| B | 0 | 13943 | 3 |
| C | 0 | 13201 | 2 |
| D | 0 | 15816 | 2 |
| Mode M9 | |||
|---|---|---|---|
| Quadrant | BADHDUFLAG | Total packets | Discarded packets |
| A | 0 | 21 | 0 |
| B | 0 | 22 | 0 |
| C | 0 | 22 | 0 |
| D | 0 | 22 | 0 |
| Mode SS | |||
|---|---|---|---|
| Quadrant | BADHDUFLAG | Total packets | Discarded packets |
| A | 0 | 128 | 0 |
| B | 0 | 128 | 0 |
| C | 0 | 128 | 0 |
| D | 0 | 128 | 0 |
| Quadrant | Total seconds | Saturated seconds | Saturation percentage |
|---|---|---|---|
| A | 6284 | 23 | 0.366009% |
| B | 6283 | 51 | 0.811714% |
| C | 6283 | 63 | 1.002706% |
| D | 6283 | 114 | 1.814420% |
Noise dominated data is calculated using 1-second bins in cleaned event files. If a bin has >2000 counts, and if more than 50% of those come from <1% of pixels, then it is considered to be noise-dominated and hence unusable.
| Quadrant | # 1 sec bins | Bins with >0 counts | Bins with >2000 counts | High rate bins dominated by noise | Noise dominated (total time) | Noise dominated (detector-on time) | Marked lightcurve |
|---|---|---|---|---|---|---|---|
| A | 7489 | 6285 | 0 | 0 | 0.00% | 0.00% | 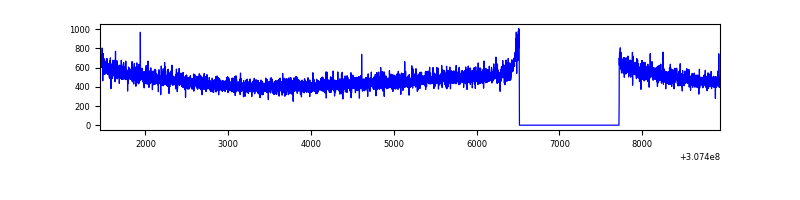 |
| B | 7488 | 6284 | 7 | 7 | 0.09% | 0.11% | 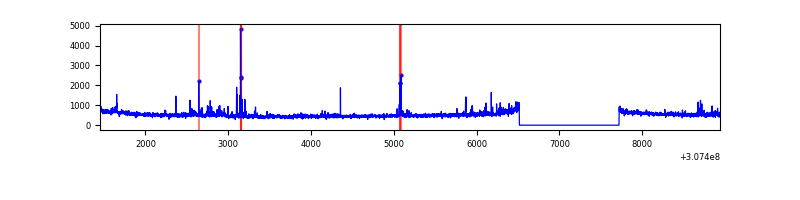 |
| C | 7488 | 6284 | 0 | 0 | 0.00% | 0.00% | 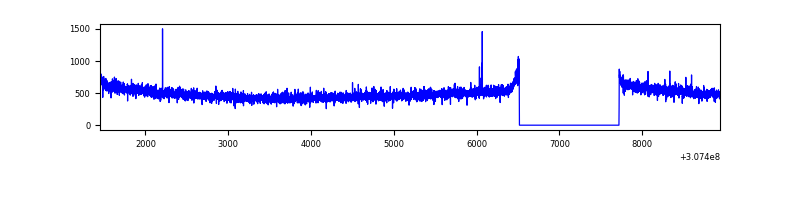 |
| D | 7488 | 6284 | 62 | 62 | 0.83% | 0.99% | 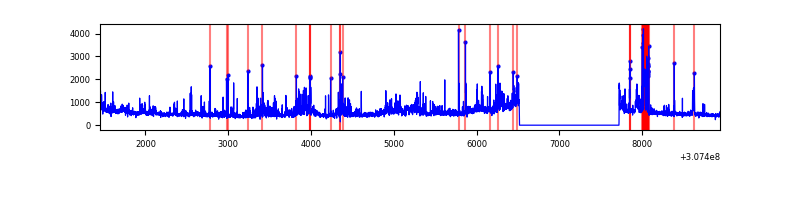 |
Top three noisy pixels from each quadrant. If the there are fewer than three noisy pixels in the level2.evt file, extra rows are filled as -1
| Pixel properties | Quadrant properties | ||||||
|---|---|---|---|---|---|---|---|
| Quadrant | DetID | PixID | Counts | Sigma | Mean | Median | Sigma |
| A | 13 | 254 | 9684 | 57.63 | 774 | 758 | 154.9 |
| A | 0 | 226 | 6679 | 38.23 | 774 | 758 | 154.9 |
| A | 3 | 137 | 6369 | 36.23 | 774 | 758 | 154.9 |
| B | 0 | 229 | 107176 | 730.79 | 782 | 762 | 145.6 |
| B | 3 | 64 | 59357 | 402.4 | 782 | 762 | 145.6 |
| B | 0 | 230 | 41742 | 281.43 | 782 | 762 | 145.6 |
| C | 14 | 238 | 120229 | 676.67 | 756 | 761 | 176.6 |
| C | 10 | 22 | 9798 | 51.19 | 756 | 761 | 176.6 |
| C | 13 | 61 | 5193 | 25.1 | 756 | 761 | 176.6 |
| D | 7 | 238 | 382733 | 2107.02 | 747 | 726 | 181.3 |
| D | 1 | 52 | 267809 | 1473.14 | 747 | 726 | 181.3 |
| D | 7 | 223 | 126682 | 694.73 | 747 | 726 | 181.3 |
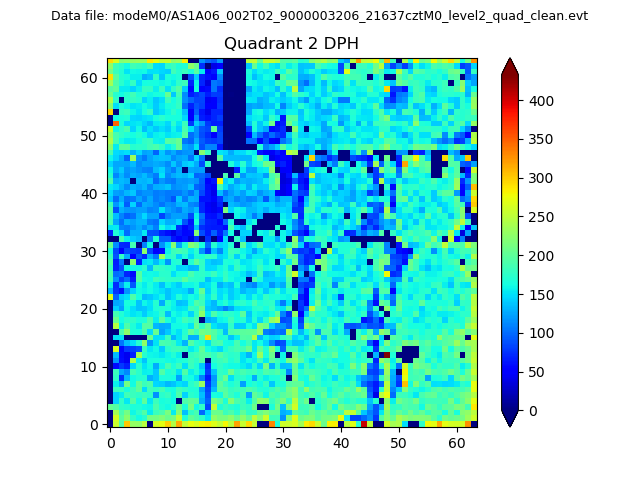
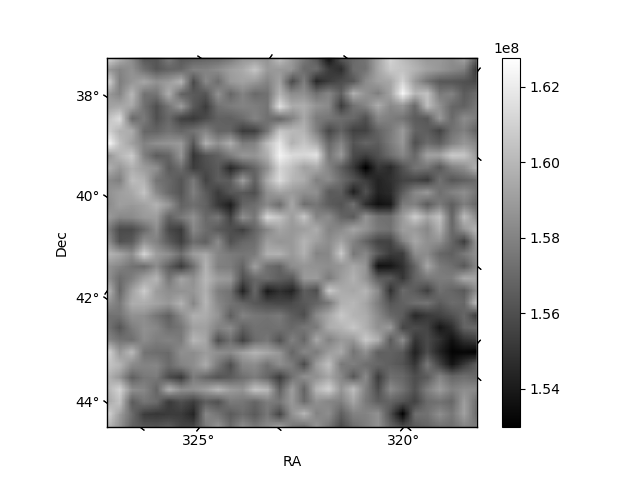
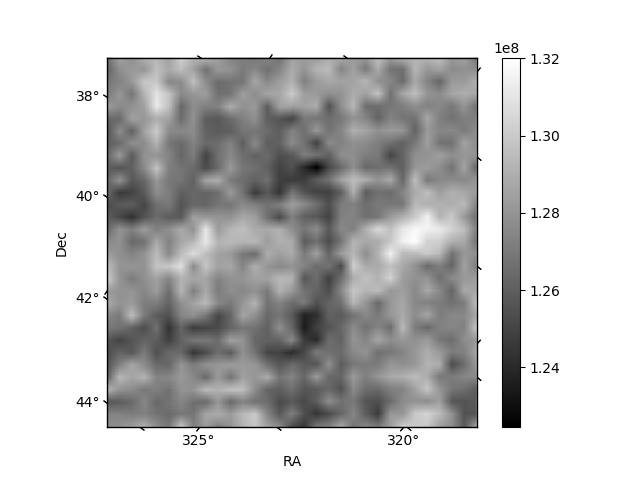
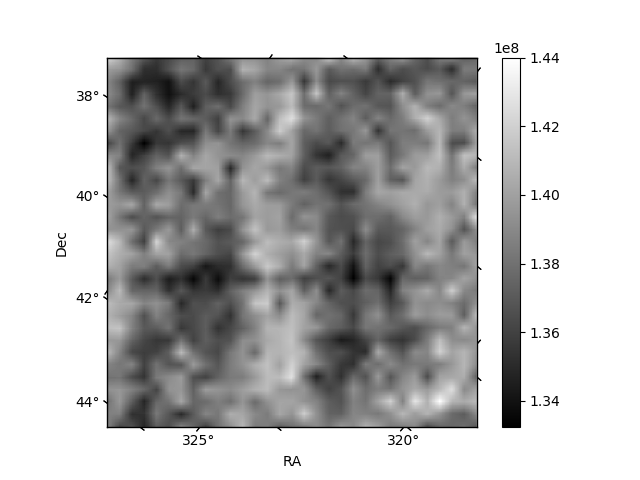
Histogram calculated using DETX and DETY for each event in the final _common_clean file
| Quadrant A | 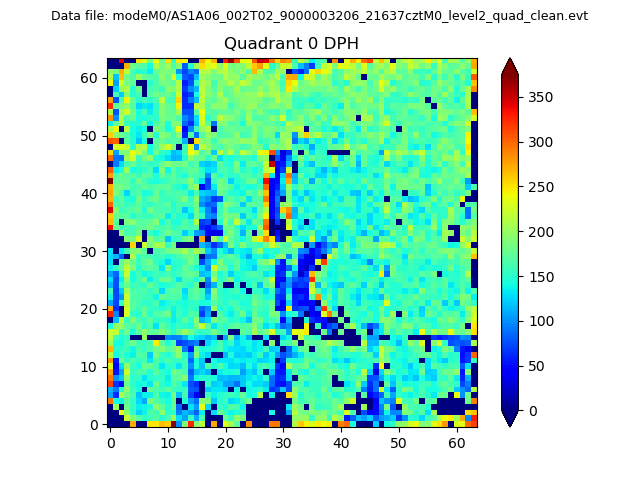 |
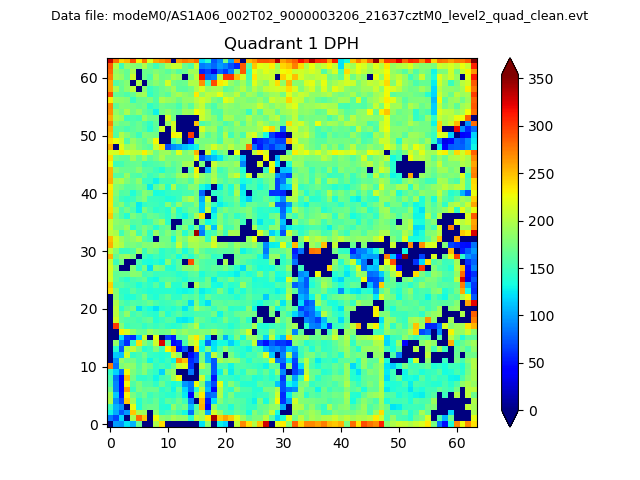 |
Quadrant B |
|---|---|---|---|
| Quadrant D | 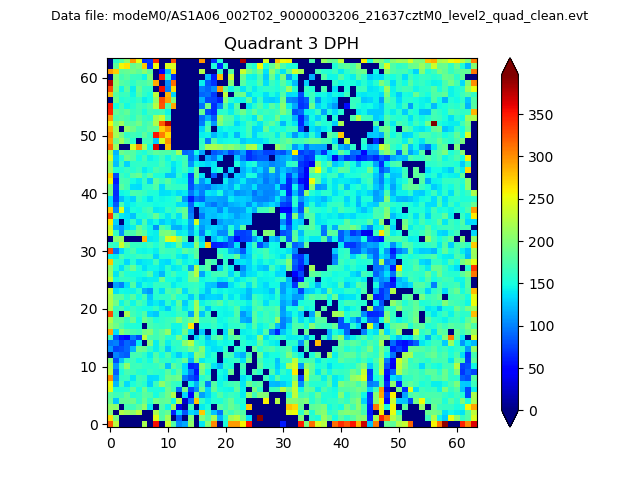 |
 |
Quadrant C |
| Plot type | Count rate plots | Images |
|---|---|---|
| Comparison with Poisson distribution Blue bars denote a histogram of data divided into 1 sec bins. Red curve is a Poisson curve with rate = median count rate of data. |
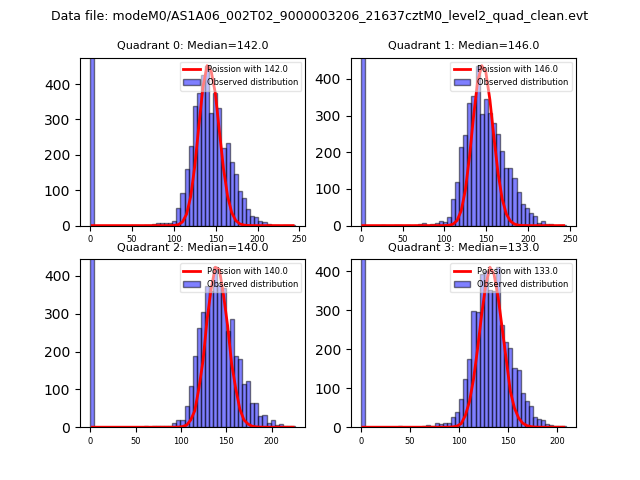 |
 |
| Quadrant-wise count rates Data is divided into 100 sec bins |
 |
|
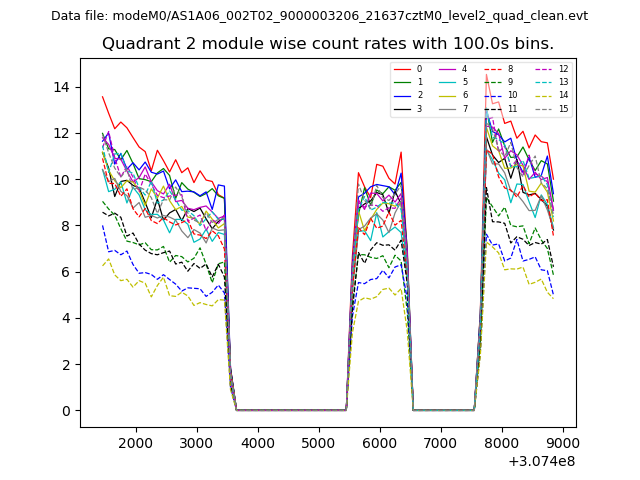
| Module-wise count rates for Quadrant A Data is divided into 100 sec bins |
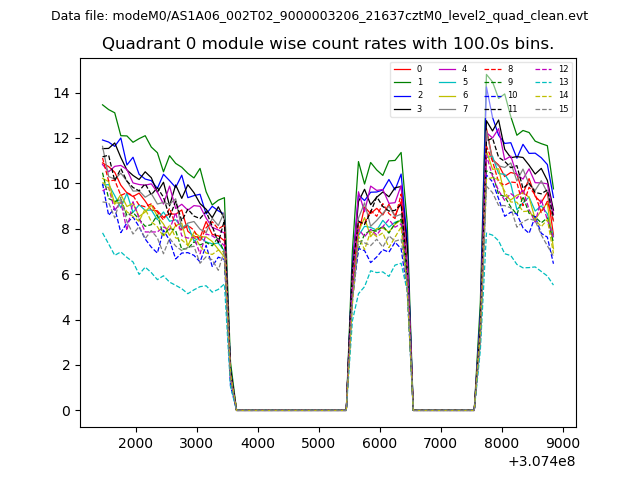 |
 |
| Module-wise count rates for Quadrant B Data is divided into 100 sec bins |
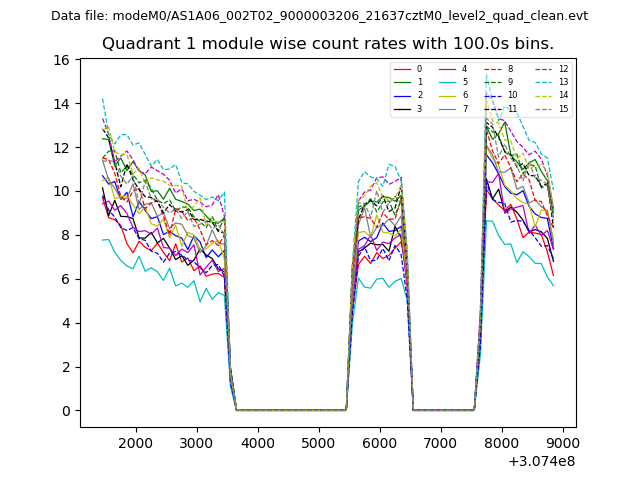 |
 |
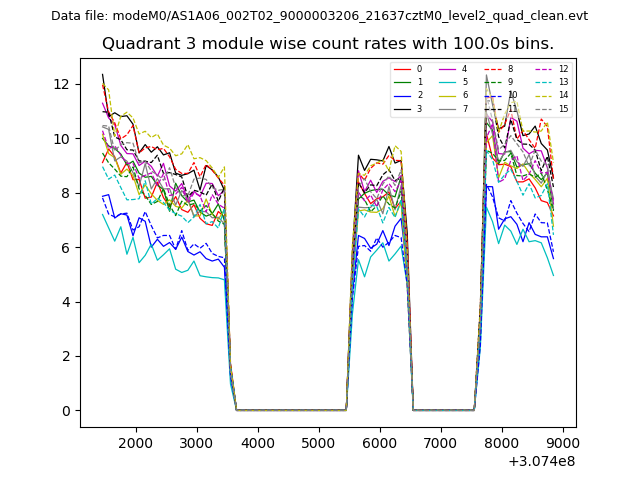
| Module-wise count rates for Quadrant C Data is divided into 100 sec bins |
 |
 |
| Module-wise count rates for Quadrant D Data is divided into 100 sec bins |
 |
 |
| Parameter | Plot |
|---|---|
| CZT HV Monitor | 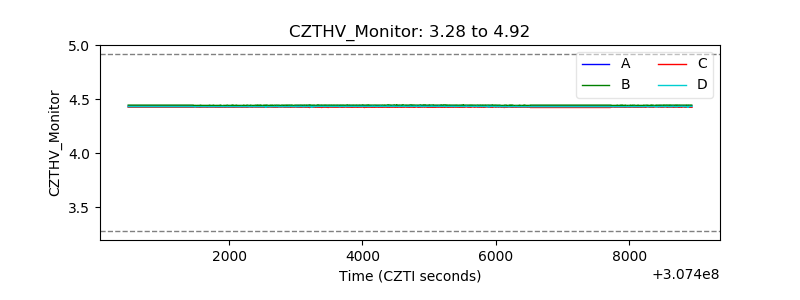 |
| D_VDD | 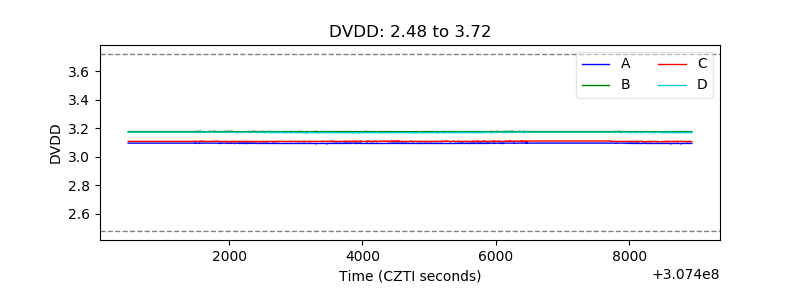 |
| Temperature 1 | 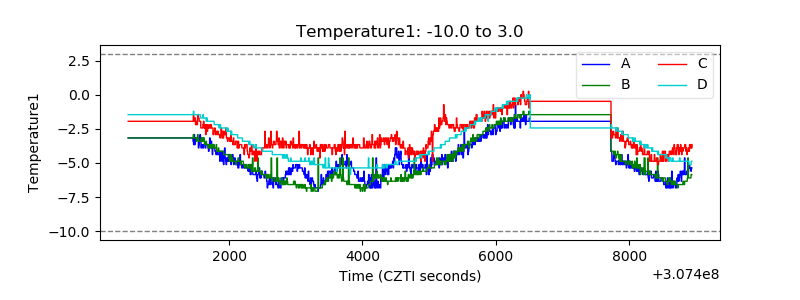 |
| Veto HV Monitor | 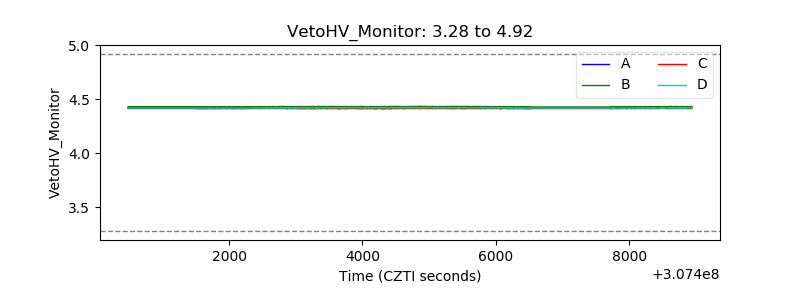 |
| Veto LLD | 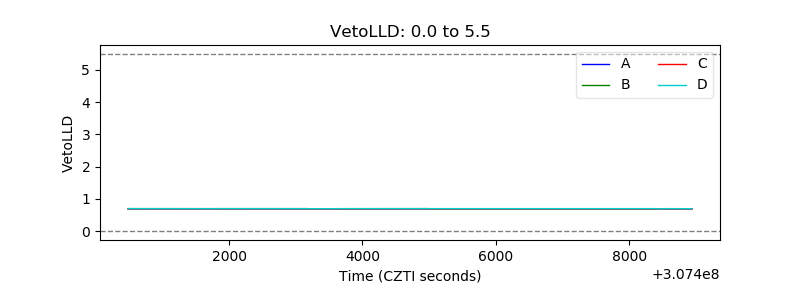 |
| Alpha Counter | 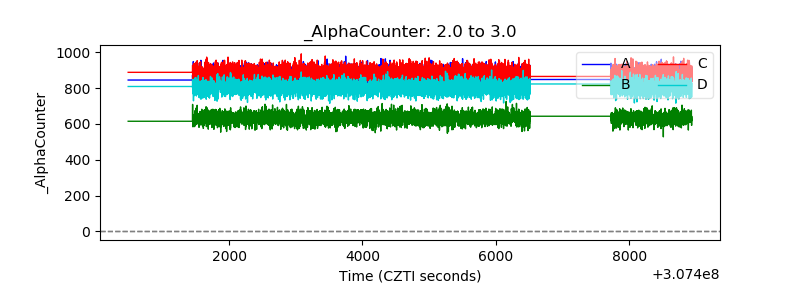 |
| _CPM_Rate | 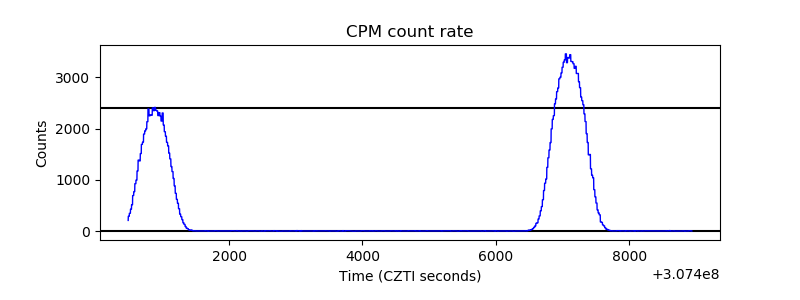 |
| CZT Counter | 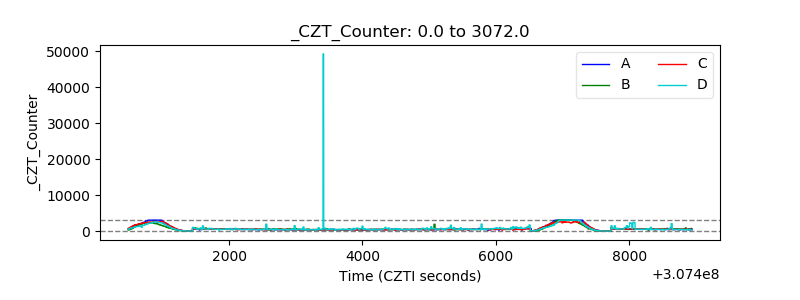 |
| +2.5 Volts monitor |  |
| +5 Volts monitor |  |
| _ROLL_ROT | 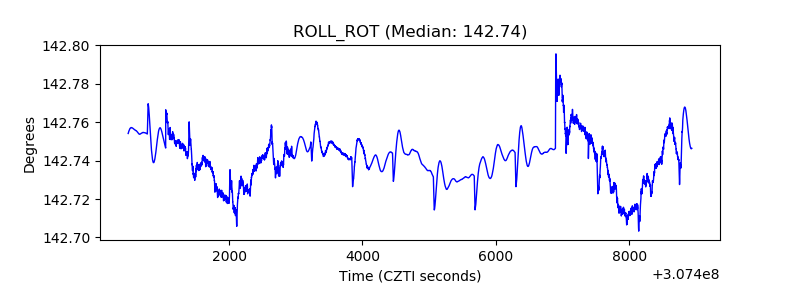 |
| _Roll_DEC | 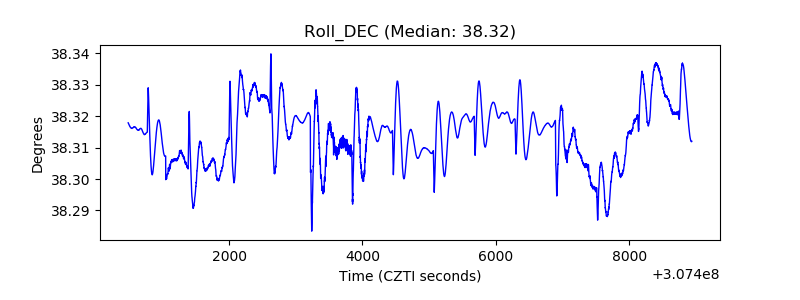 |
| _Roll_RA | 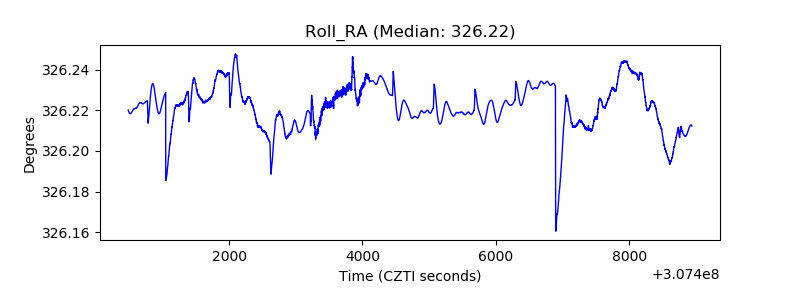 |
| Veto Counter | 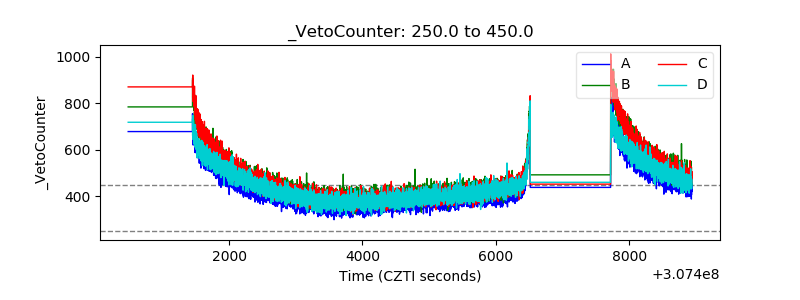 |