| Param | Original file | Final file |
|---|---|---|
| Filename | modeM0/AS1A06_002T02_9000003206_21638cztM0_level2.evt | modeM0/AS1A06_002T02_9000003206_21638cztM0_level2_quad_clean.evt |
| Size (bytes) | 441,175,680 | 95,569,920 |
| Size | 420.7 MB | 91.1 MB |
| Events in quadrant A | 3,019,611 | 628,446 |
| Events in quadrant B | 3,286,975 | 653,247 |
| Events in quadrant C | 3,102,952 | 615,192 |
| Events in quadrant D | 3,534,432 | 568,806 |
| Mode M0 | |||
|---|---|---|---|
| Quadrant | BADHDUFLAG | Total packets | Discarded packets |
| A | 0 | 12835 | 2 |
| B | 0 | 13668 | 2 |
| C | 0 | 13003 | 2 |
| D | 0 | 14571 | 4 |
| Mode M9 | |||
|---|---|---|---|
| Quadrant | BADHDUFLAG | Total packets | Discarded packets |
| A | 0 | 25 | 0 |
| B | 0 | 25 | 0 |
| C | 0 | 25 | 0 |
| D | 0 | 25 | 0 |
| Mode SS | |||
|---|---|---|---|
| Quadrant | BADHDUFLAG | Total packets | Discarded packets |
| A | 0 | 126 | 0 |
| B | 0 | 126 | 0 |
| C | 0 | 126 | 0 |
| D | 0 | 126 | 0 |
| Quadrant | Total seconds | Saturated seconds | Saturation percentage |
|---|---|---|---|
| A | 6140 | 37 | 0.602606% |
| B | 6140 | 63 | 1.026059% |
| C | 6141 | 59 | 0.960756% |
| D | 6140 | 208 | 3.387622% |
Noise dominated data is calculated using 1-second bins in cleaned event files. If a bin has >2000 counts, and if more than 50% of those come from <1% of pixels, then it is considered to be noise-dominated and hence unusable.
| Quadrant | # 1 sec bins | Bins with >0 counts | Bins with >2000 counts | High rate bins dominated by noise | Noise dominated (total time) | Noise dominated (detector-on time) | Marked lightcurve |
|---|---|---|---|---|---|---|---|
| A | 8660 | 6142 | 0 | 0 | 0.00% | 0.00% | 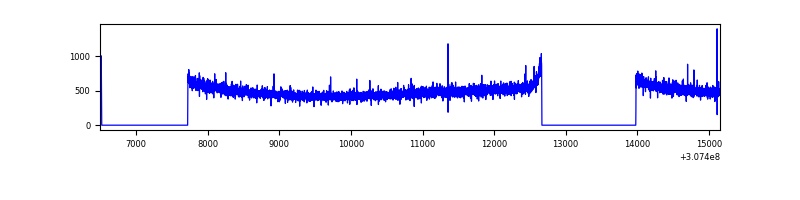 |
| B | 8660 | 6142 | 4 | 4 | 0.05% | 0.07% | 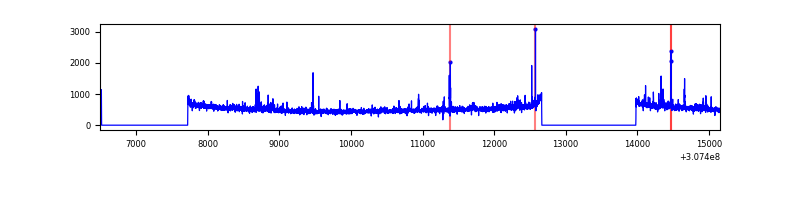 |
| C | 8661 | 6143 | 0 | 0 | 0.00% | 0.00% | 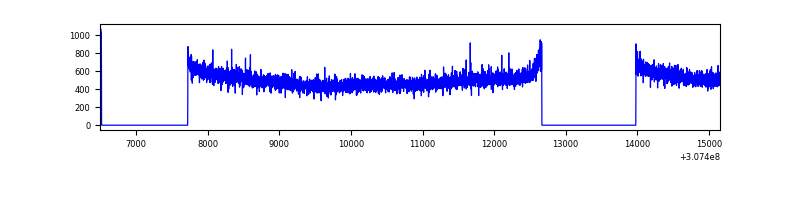 |
| D | 8659 | 6141 | 157 | 157 | 1.81% | 2.56% | 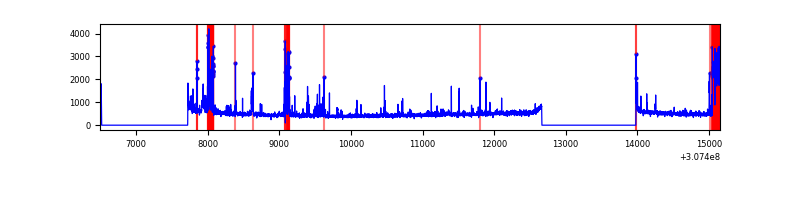 |
Top three noisy pixels from each quadrant. If the there are fewer than three noisy pixels in the level2.evt file, extra rows are filled as -1
| Pixel properties | Quadrant properties | ||||||
|---|---|---|---|---|---|---|---|
| Quadrant | DetID | PixID | Counts | Sigma | Mean | Median | Sigma |
| A | 13 | 254 | 8331 | 48.32 | 782 | 767 | 156.5 |
| A | 0 | 226 | 6844 | 38.82 | 782 | 767 | 156.5 |
| A | 10 | 253 | 6417 | 36.09 | 782 | 767 | 156.5 |
| B | 3 | 64 | 53053 | 356.7 | 793 | 774 | 146.6 |
| B | 0 | 230 | 37047 | 247.49 | 793 | 774 | 146.6 |
| B | 0 | 229 | 32026 | 213.23 | 793 | 774 | 146.6 |
| C | 14 | 238 | 119936 | 671.79 | 762 | 768 | 177.4 |
| C | 10 | 22 | 8288 | 42.39 | 762 | 768 | 177.4 |
| C | 13 | 61 | 5456 | 26.43 | 762 | 768 | 177.4 |
| D | 1 | 52 | 248903 | 1382.57 | 742 | 720 | 179.5 |
| D | 7 | 223 | 161889 | 897.83 | 742 | 720 | 179.5 |
| D | 2 | 136 | 122587 | 678.89 | 742 | 720 | 179.5 |
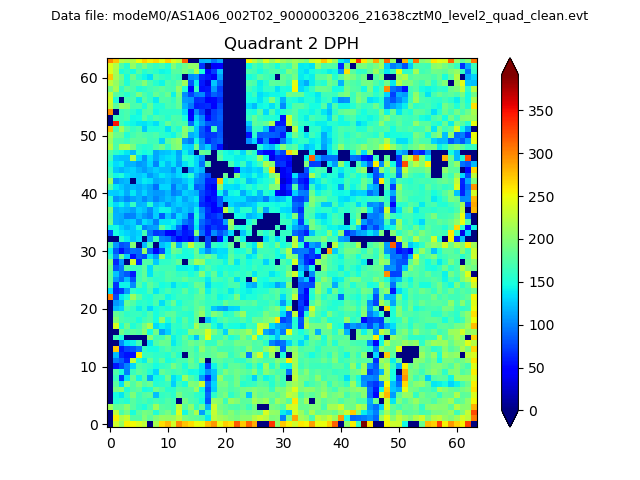
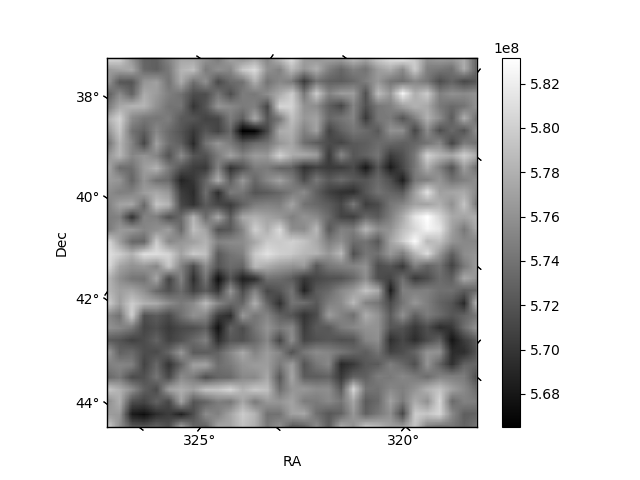
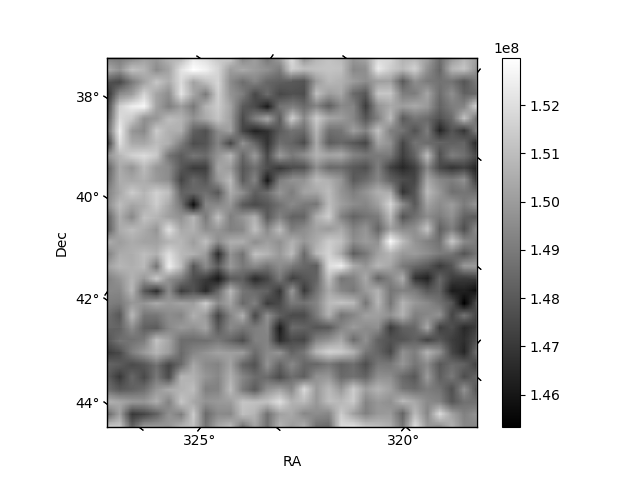
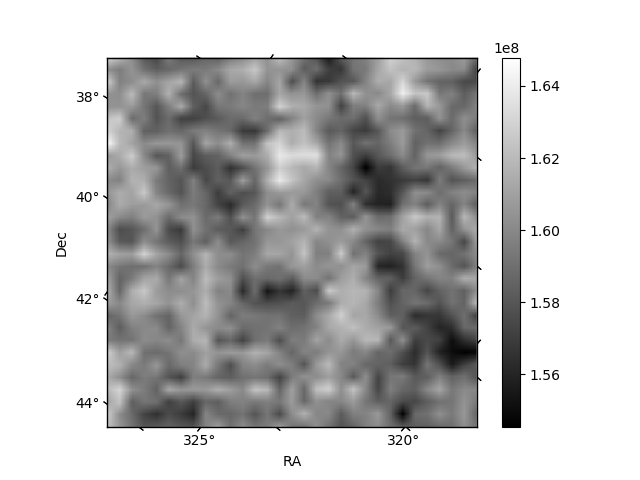
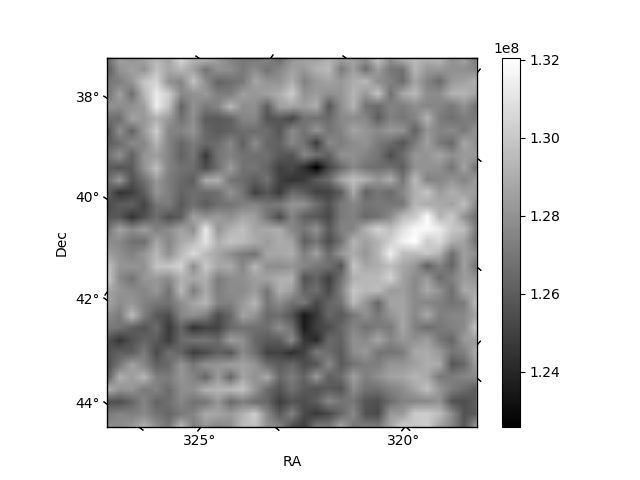
Histogram calculated using DETX and DETY for each event in the final _common_clean file
| Quadrant A | 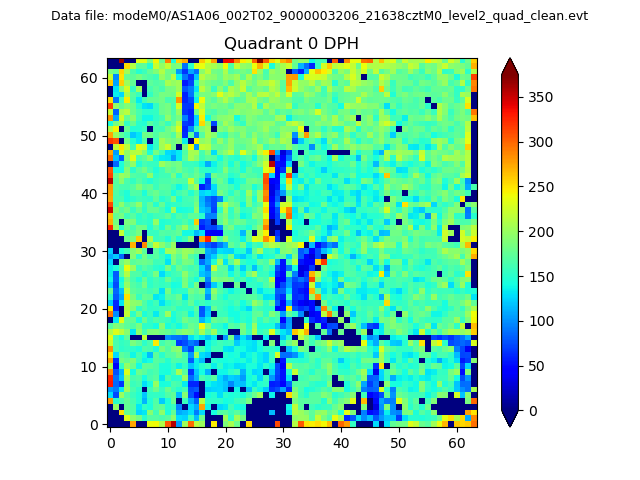 |
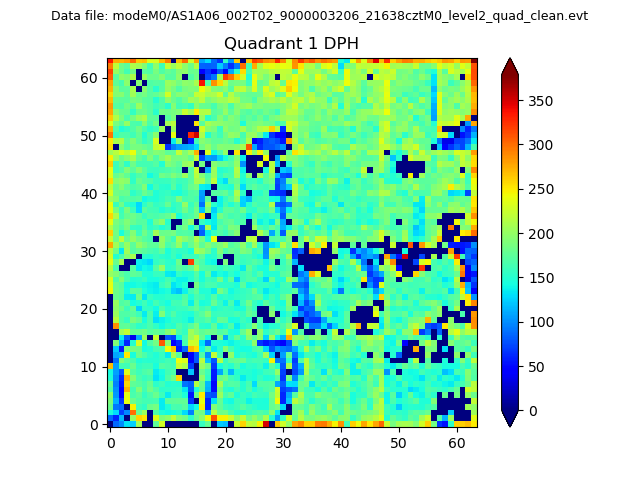 |
Quadrant B |
|---|---|---|---|
| Quadrant D | 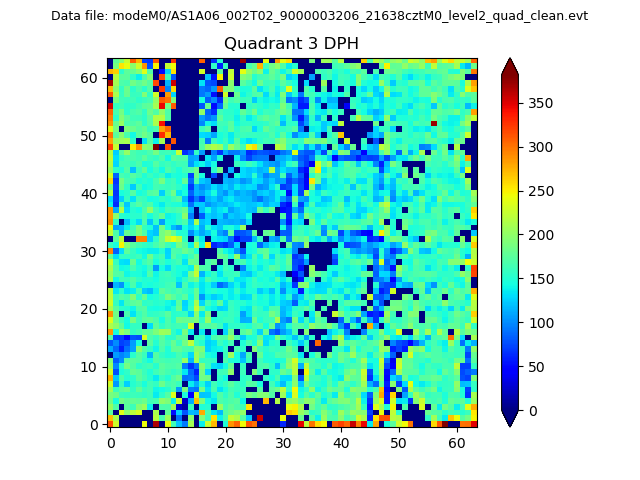 |
 |
Quadrant C |
| Plot type | Count rate plots | Images |
|---|---|---|
| Comparison with Poisson distribution Blue bars denote a histogram of data divided into 1 sec bins. Red curve is a Poisson curve with rate = median count rate of data. |
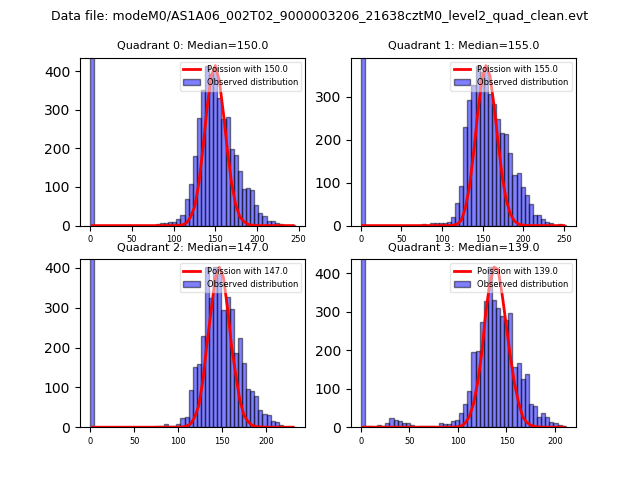 |
 |
| Quadrant-wise count rates Data is divided into 100 sec bins |
 |
|
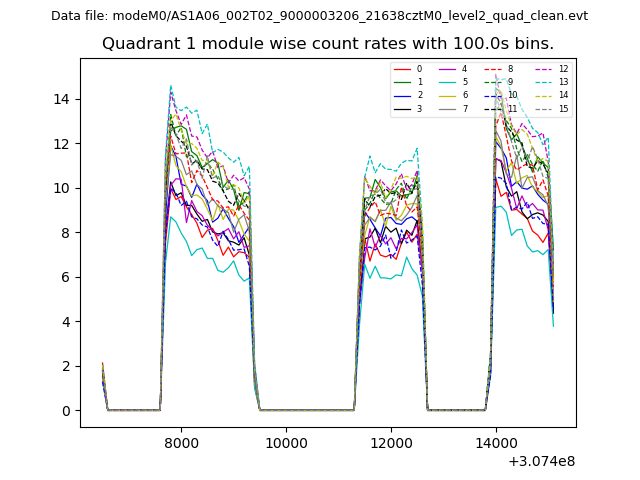
| Module-wise count rates for Quadrant A Data is divided into 100 sec bins |
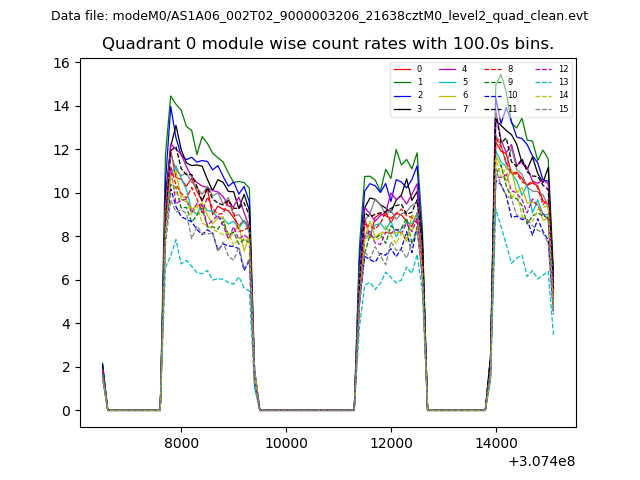 |
 |
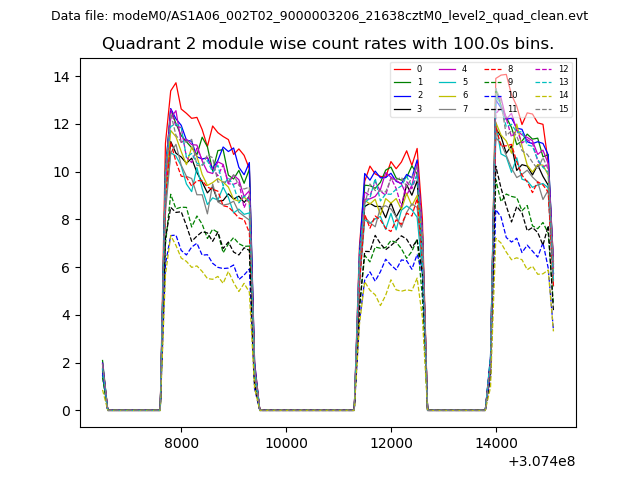
| Module-wise count rates for Quadrant B Data is divided into 100 sec bins |
 |
 |
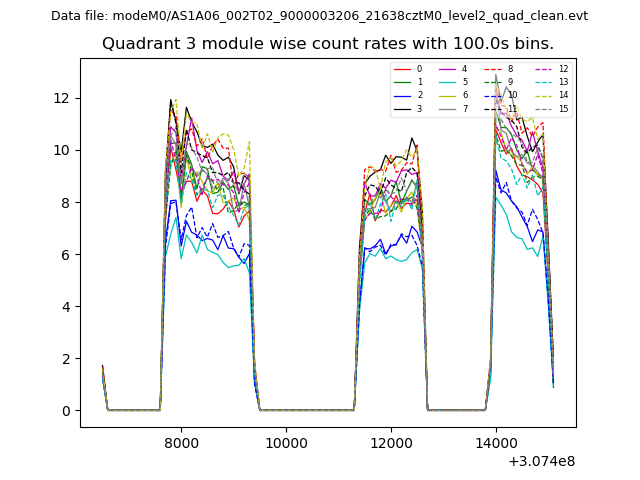
| Module-wise count rates for Quadrant C Data is divided into 100 sec bins |
 |
 |
| Module-wise count rates for Quadrant D Data is divided into 100 sec bins |
 |
 |
| Parameter | Plot |
|---|---|
| CZT HV Monitor | 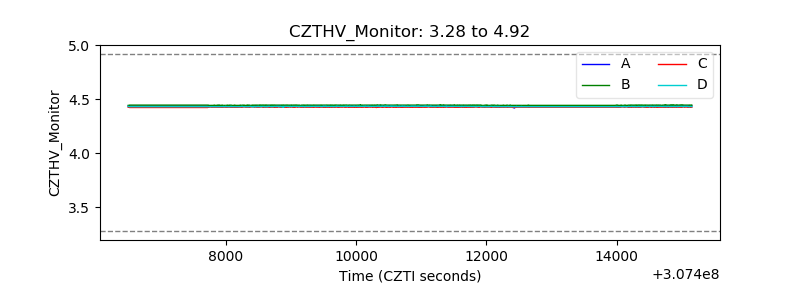 |
| D_VDD | 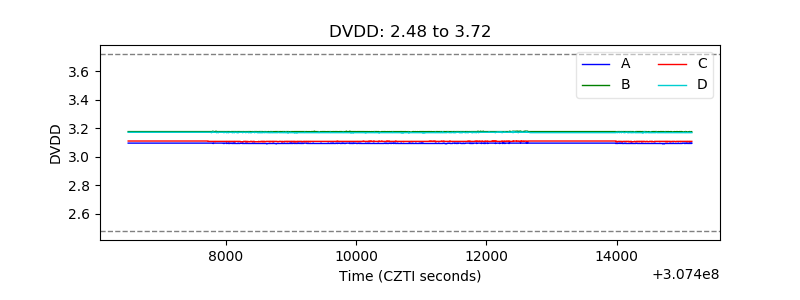 |
| Temperature 1 | 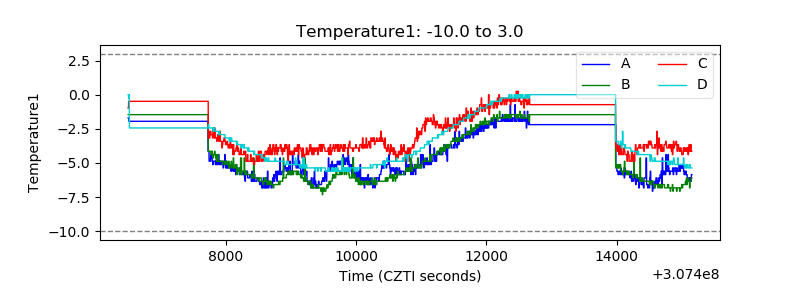 |
| Veto HV Monitor | 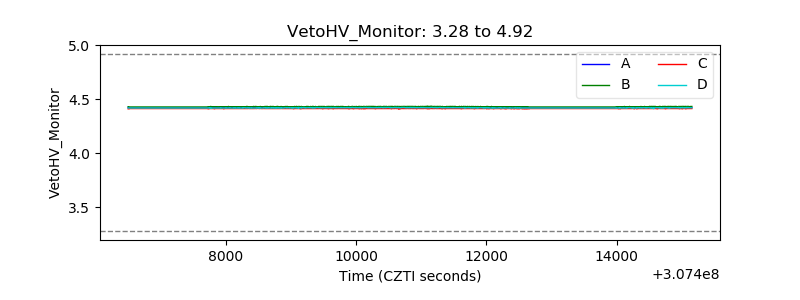 |
| Veto LLD | 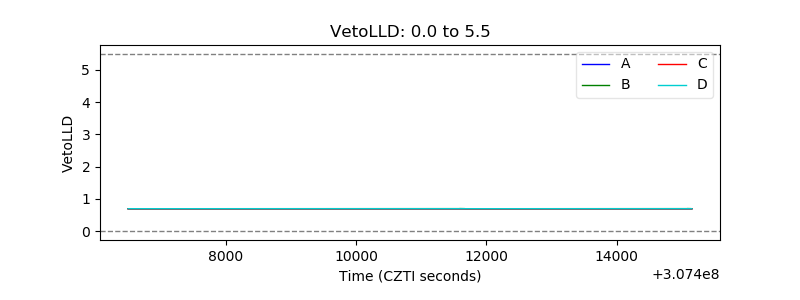 |
| Alpha Counter |  |
| _CPM_Rate | 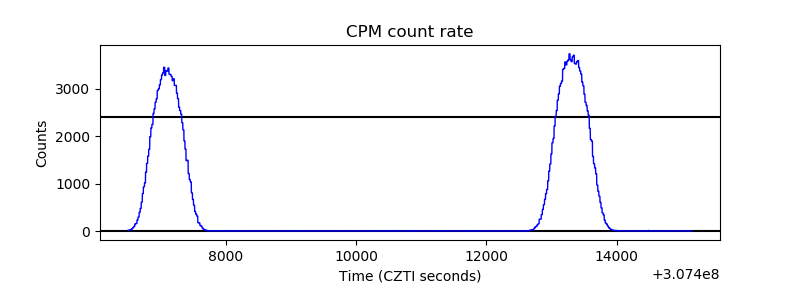 |
| CZT Counter | 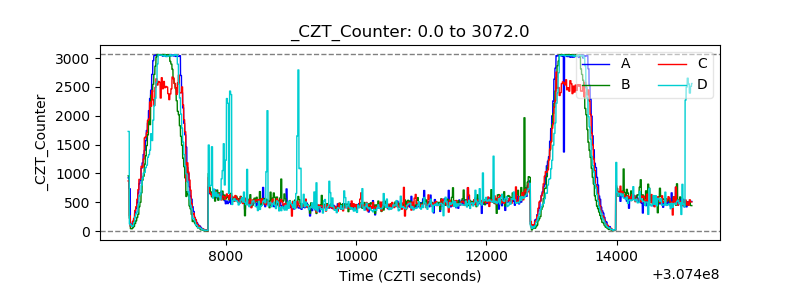 |
| +2.5 Volts monitor |  |
| +5 Volts monitor |  |
| _ROLL_ROT | 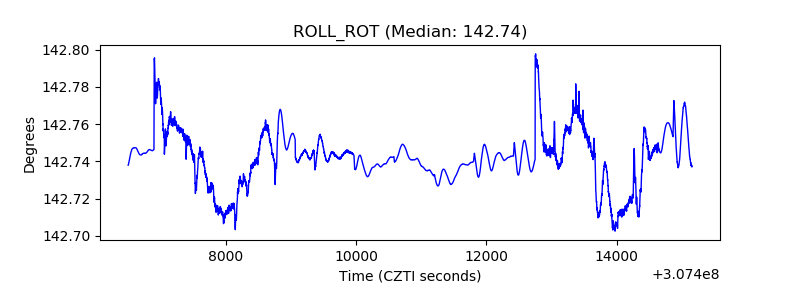 |
| _Roll_DEC | 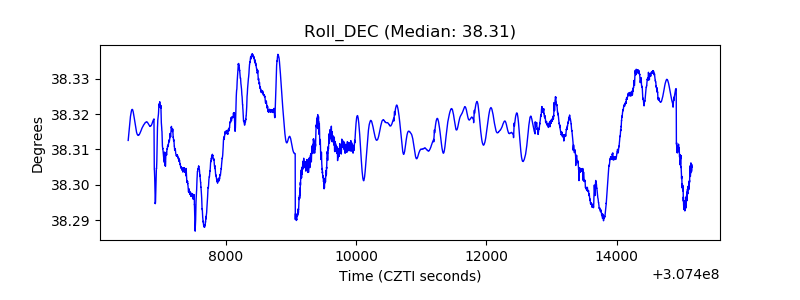 |
| _Roll_RA | 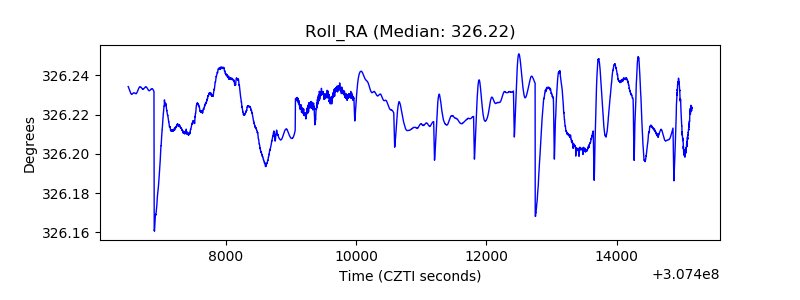 |
| Veto Counter | 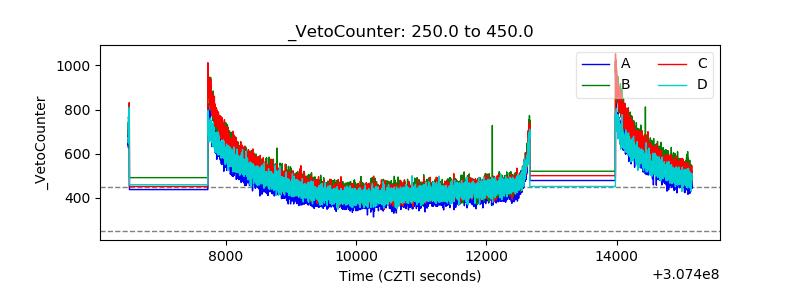 |