| Param | Original file | Final file |
|---|---|---|
| Filename | modeM0/AS1A06_002T02_9000003206_21639cztM0_level2.evt | modeM0/AS1A06_002T02_9000003206_21639cztM0_level2_quad_clean.evt |
| Size (bytes) | 517,556,160 | 90,213,120 |
| Size | 493.6 MB | 86.0 MB |
| Events in quadrant A | 3,166,683 | 592,305 |
| Events in quadrant B | 3,602,392 | 611,830 |
| Events in quadrant C | 3,162,236 | 573,828 |
| Events in quadrant D | 5,325,884 | 524,842 |
| Mode M0 | |||
|---|---|---|---|
| Quadrant | BADHDUFLAG | Total packets | Discarded packets |
| A | 0 | 13109 | 2 |
| B | 0 | 14632 | 2 |
| C | 0 | 13071 | 3 |
| D | 0 | 19670 | 2 |
| Mode M9 | |||
|---|---|---|---|
| Quadrant | BADHDUFLAG | Total packets | Discarded packets |
| A | 0 | 16 | 0 |
| B | 0 | 17 | 0 |
| C | 0 | 17 | 0 |
| D | 0 | 17 | 0 |
| Mode SS | |||
|---|---|---|---|
| Quadrant | BADHDUFLAG | Total packets | Discarded packets |
| A | 0 | 124 | 0 |
| B | 0 | 124 | 0 |
| C | 0 | 124 | 0 |
| D | 0 | 124 | 0 |
| Quadrant | Total seconds | Saturated seconds | Saturation percentage |
|---|---|---|---|
| A | 6150 | 46 | 0.747967% |
| B | 6150 | 107 | 1.739837% |
| C | 6149 | 78 | 1.268499% |
| D | 6149 | 955 | 15.530981% |
Noise dominated data is calculated using 1-second bins in cleaned event files. If a bin has >2000 counts, and if more than 50% of those come from <1% of pixels, then it is considered to be noise-dominated and hence unusable.
| Quadrant | # 1 sec bins | Bins with >0 counts | Bins with >2000 counts | High rate bins dominated by noise | Noise dominated (total time) | Noise dominated (detector-on time) | Marked lightcurve |
|---|---|---|---|---|---|---|---|
| A | 7500 | 6151 | 8 | 8 | 0.11% | 0.13% | 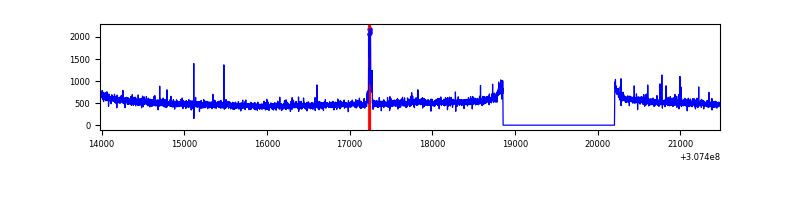 |
| B | 7500 | 6151 | 39 | 39 | 0.52% | 0.63% | 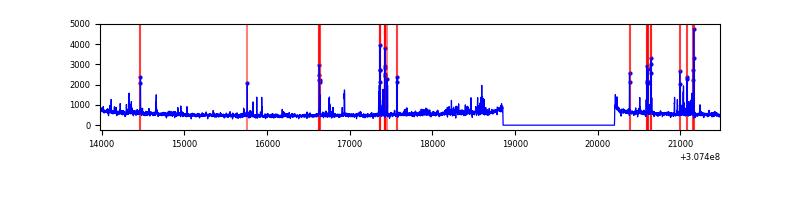 |
| C | 7499 | 6150 | 1 | 1 | 0.01% | 0.02% | 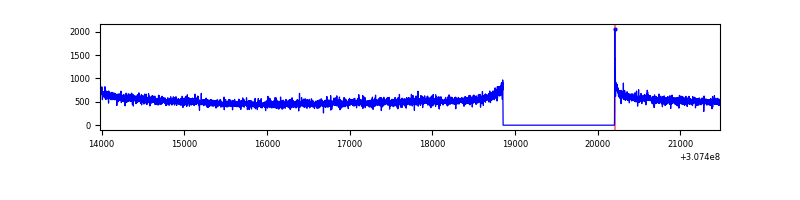 |
| D | 7499 | 6150 | 803 | 803 | 10.71% | 13.06% | 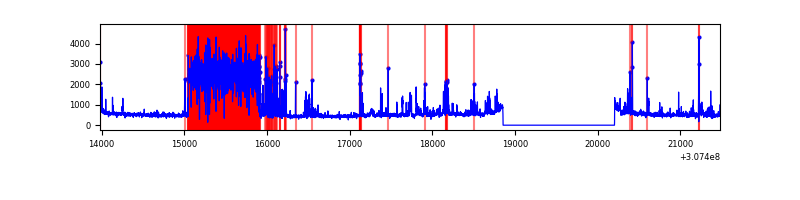 |
Top three noisy pixels from each quadrant. If the there are fewer than three noisy pixels in the level2.evt file, extra rows are filled as -1
| Pixel properties | Quadrant properties | ||||||
|---|---|---|---|---|---|---|---|
| Quadrant | DetID | PixID | Counts | Sigma | Mean | Median | Sigma |
| A | 5 | 98 | 49055 | 301.62 | 805 | 791 | 160.0 |
| A | 10 | 253 | 17843 | 106.56 | 805 | 791 | 160.0 |
| A | 13 | 254 | 9190 | 52.49 | 805 | 791 | 160.0 |
| B | 3 | 64 | 210176 | 1400.97 | 811 | 794 | 149.5 |
| B | 0 | 229 | 68287 | 451.59 | 811 | 794 | 149.5 |
| B | 6 | 36 | 29691 | 193.35 | 811 | 794 | 149.5 |
| C | 14 | 238 | 126346 | 701.21 | 775 | 782 | 179.1 |
| C | 9 | 54 | 5810 | 28.08 | 775 | 782 | 179.1 |
| C | 13 | 61 | 5521 | 26.47 | 775 | 782 | 179.1 |
| D | 1 | 52 | 2395281 | 14080.35 | 708 | 687 | 170.1 |
| D | 2 | 136 | 72125 | 420.06 | 708 | 687 | 170.1 |
| D | 12 | 235 | 66114 | 384.71 | 708 | 687 | 170.1 |
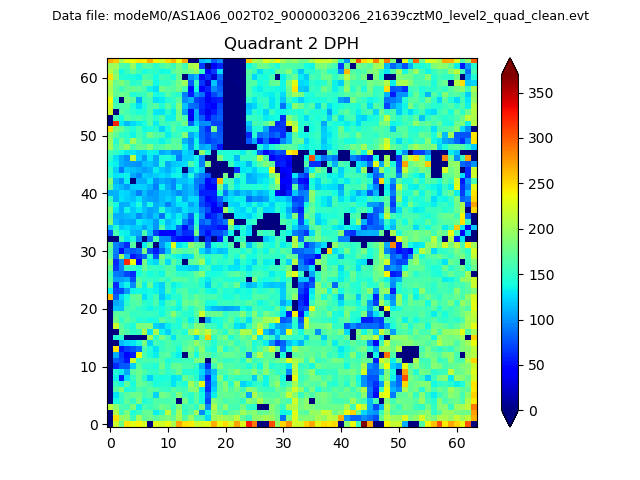
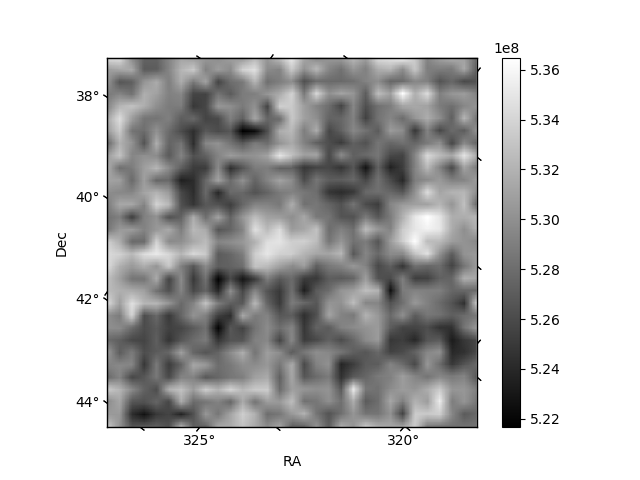
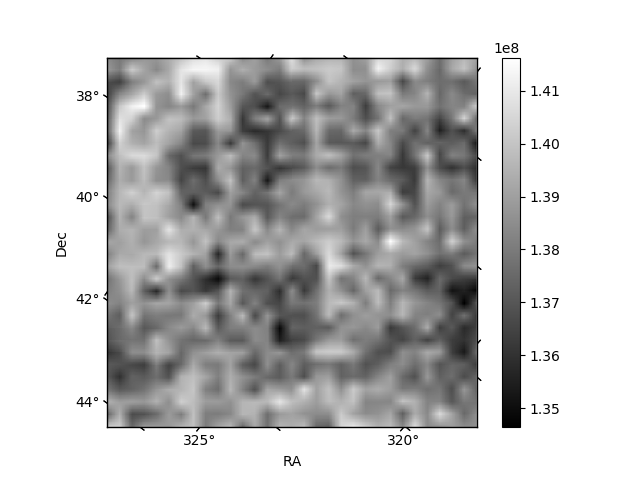
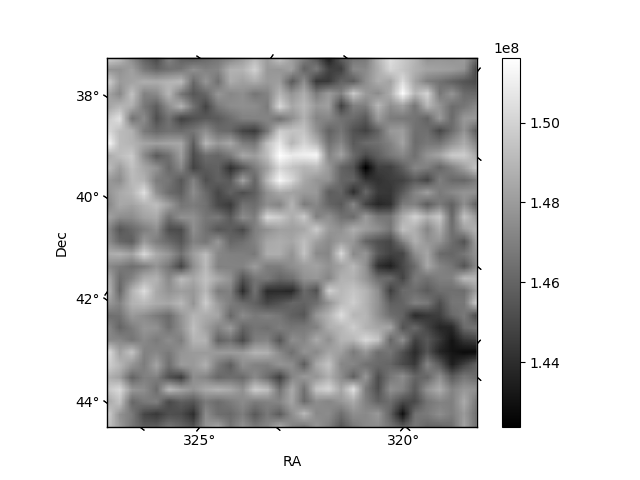
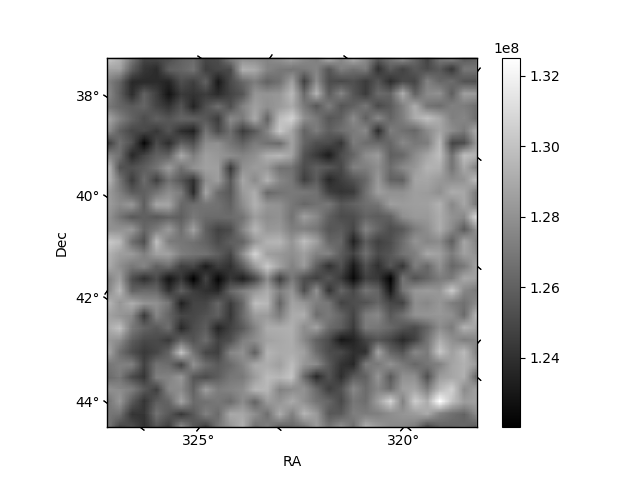
Histogram calculated using DETX and DETY for each event in the final _common_clean file
| Quadrant A | 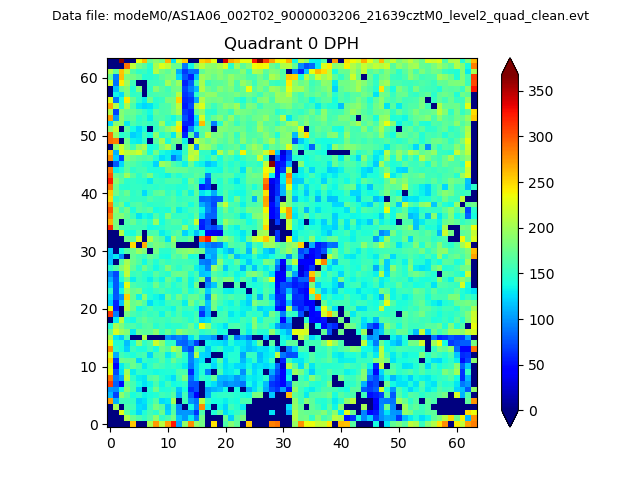 |
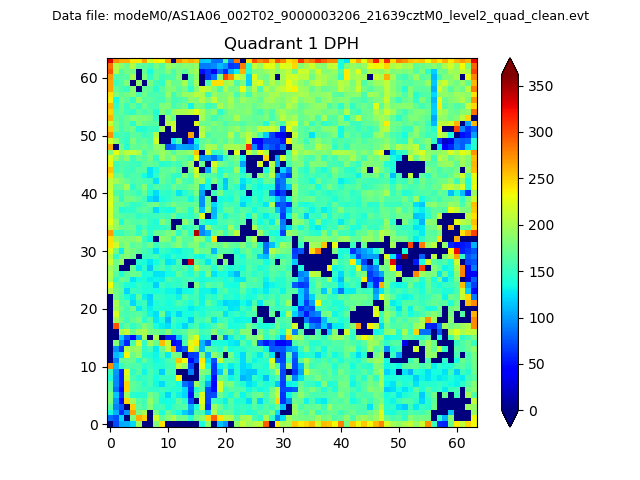 |
Quadrant B |
|---|---|---|---|
| Quadrant D | 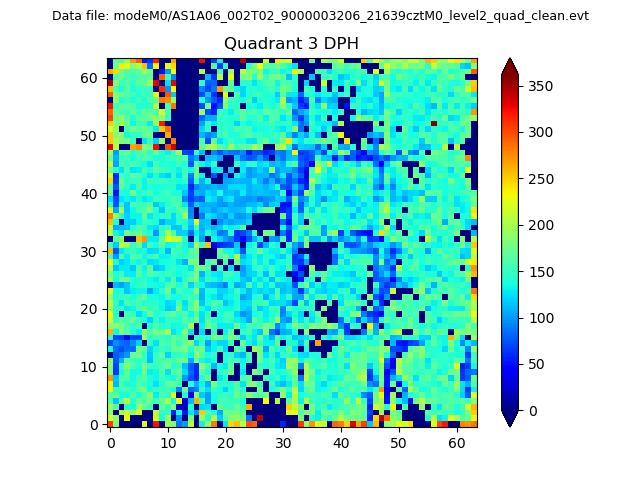 |
 |
Quadrant C |
| Plot type | Count rate plots | Images |
|---|---|---|
| Comparison with Poisson distribution Blue bars denote a histogram of data divided into 1 sec bins. Red curve is a Poisson curve with rate = median count rate of data. |
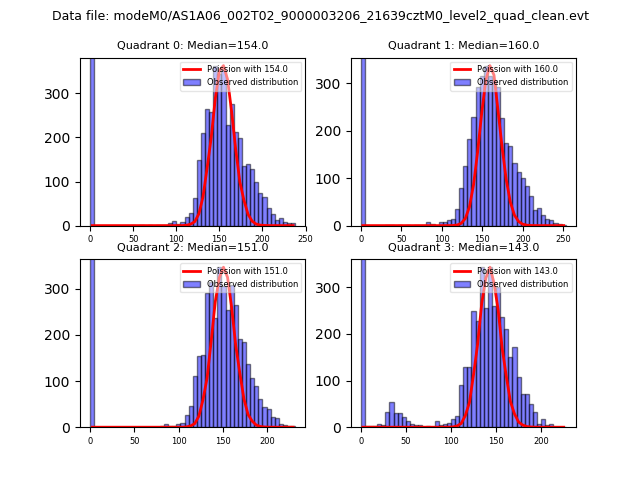 |
 |
| Quadrant-wise count rates Data is divided into 100 sec bins |
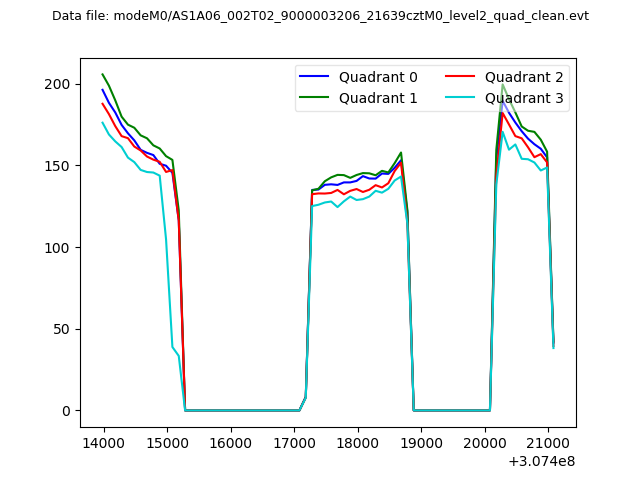 |
|
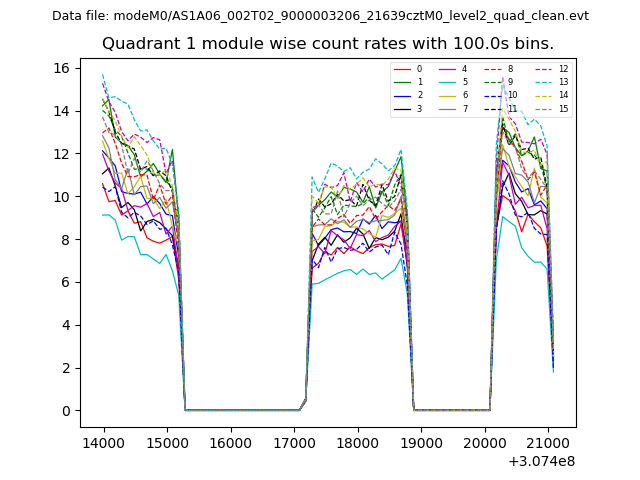
| Module-wise count rates for Quadrant A Data is divided into 100 sec bins |
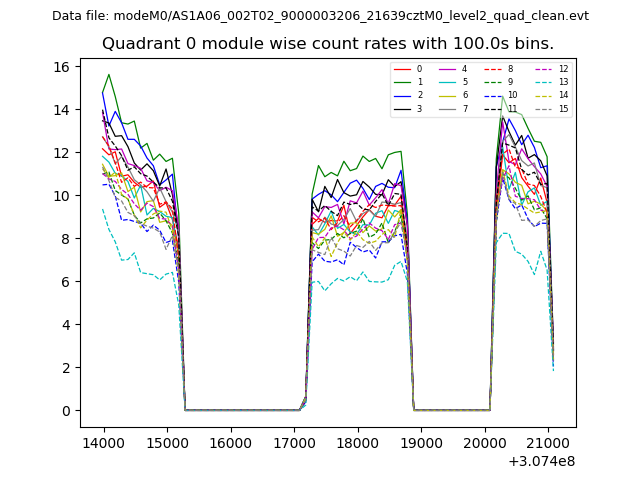 |
 |
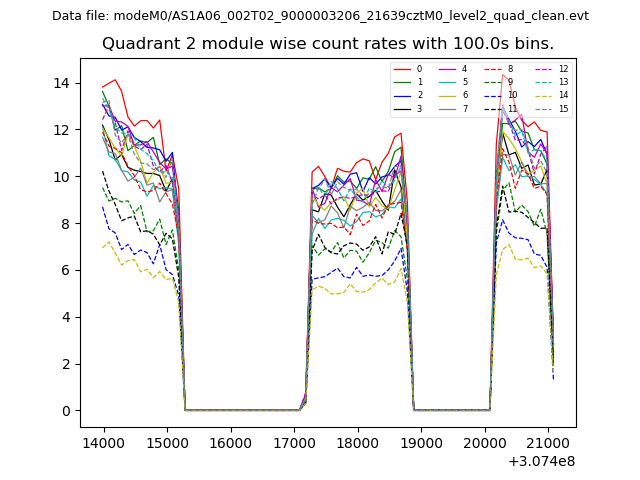
| Module-wise count rates for Quadrant B Data is divided into 100 sec bins |
 |
 |
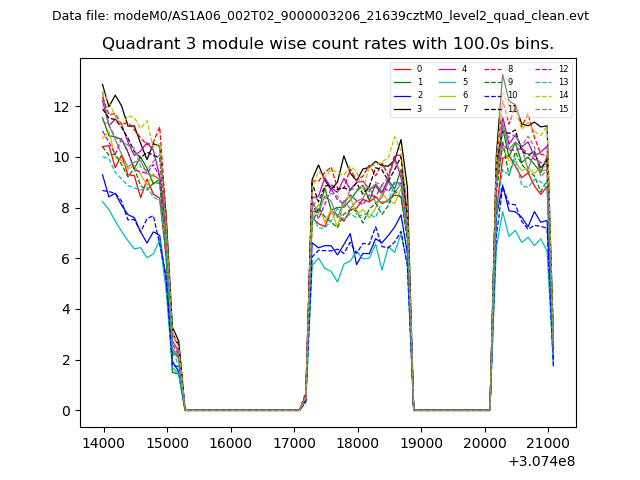
| Module-wise count rates for Quadrant C Data is divided into 100 sec bins |
 |
 |
| Module-wise count rates for Quadrant D Data is divided into 100 sec bins |
 |
 |
| Parameter | Plot |
|---|---|
| CZT HV Monitor | 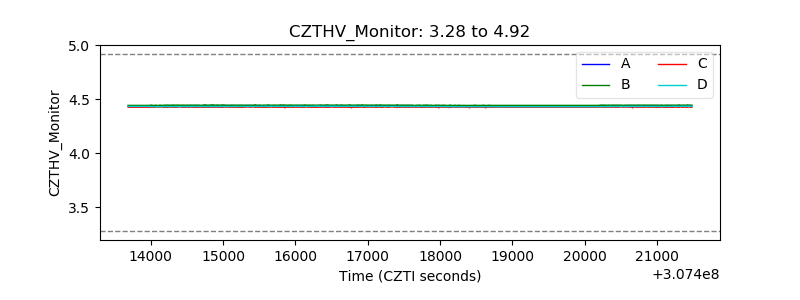 |
| D_VDD | 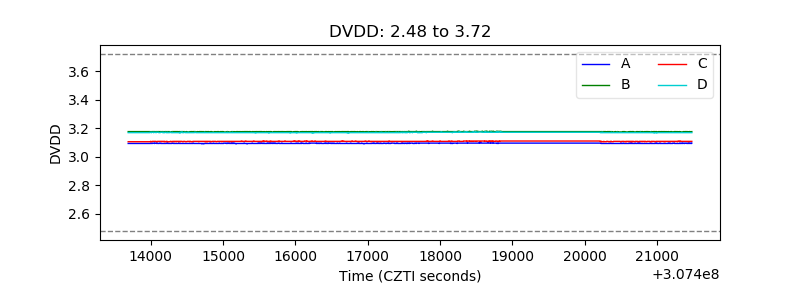 |
| Temperature 1 | 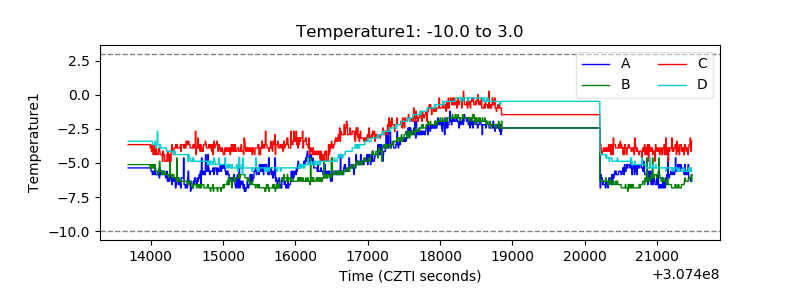 |
| Veto HV Monitor | 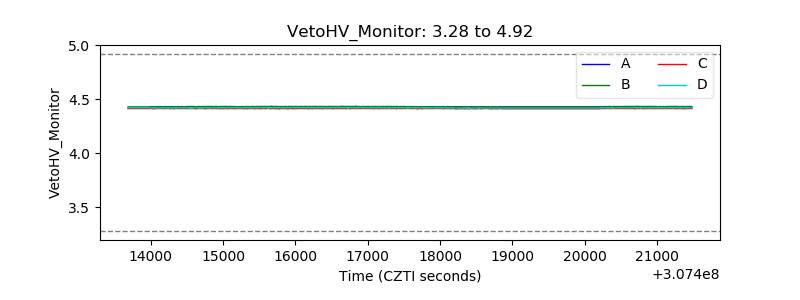 |
| Veto LLD | 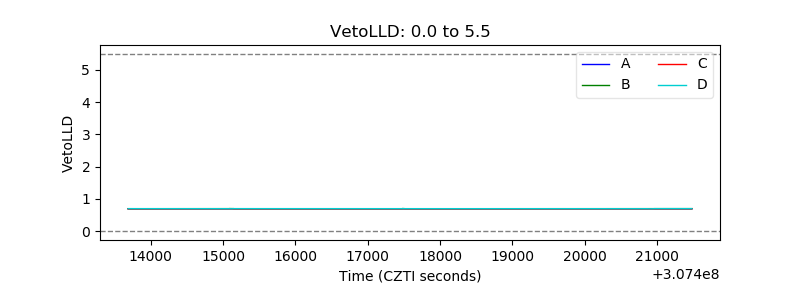 |
| Alpha Counter | 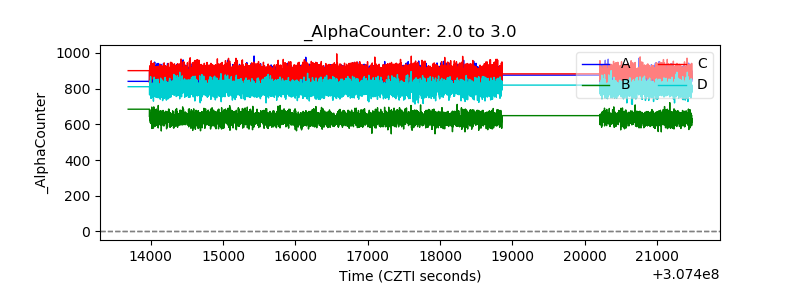 |
| _CPM_Rate | 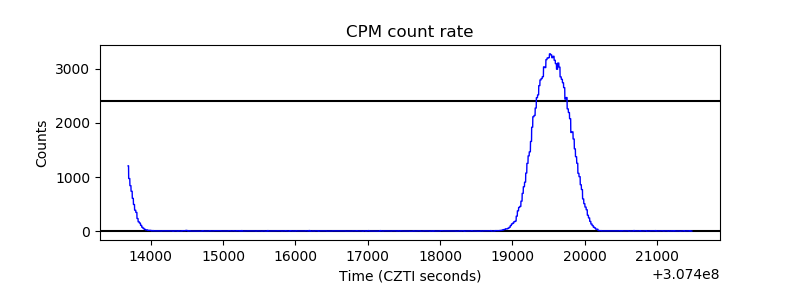 |
| CZT Counter | 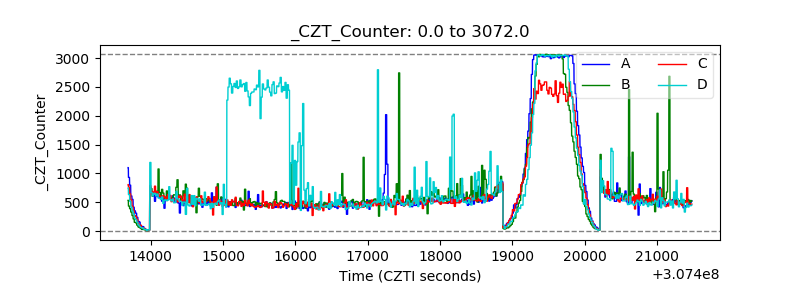 |
| +2.5 Volts monitor | 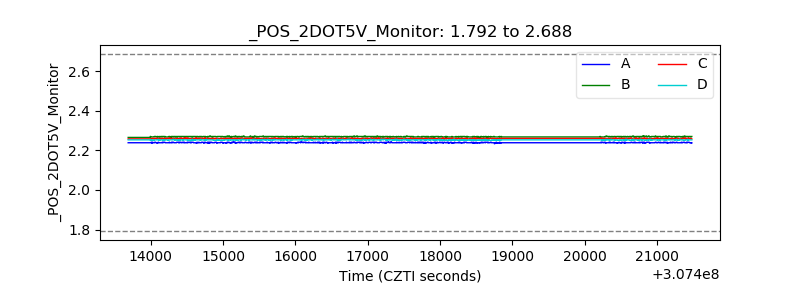 |
| +5 Volts monitor |  |
| _ROLL_ROT | 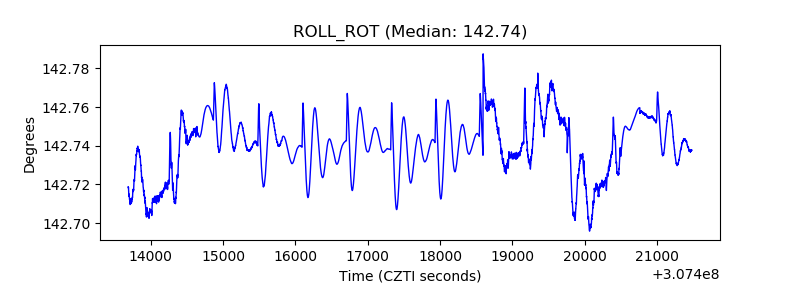 |
| _Roll_DEC | 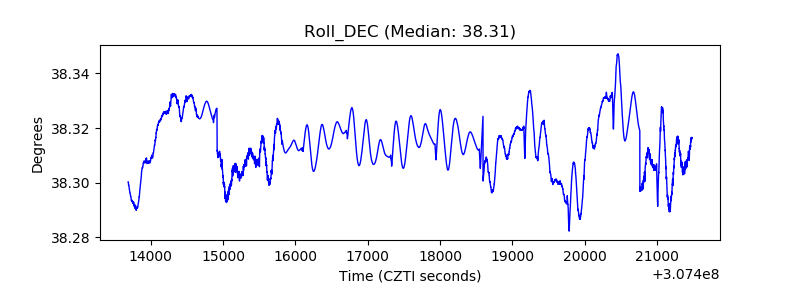 |
| _Roll_RA | 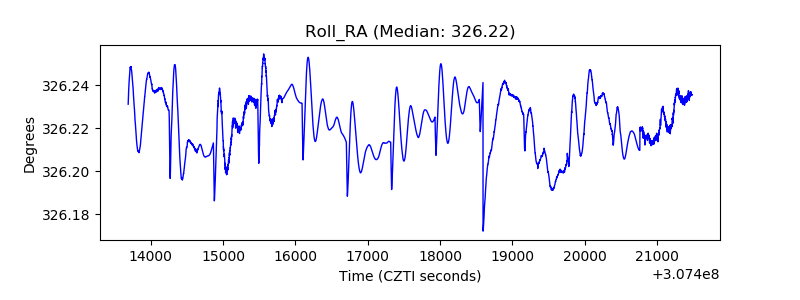 |
| Veto Counter | 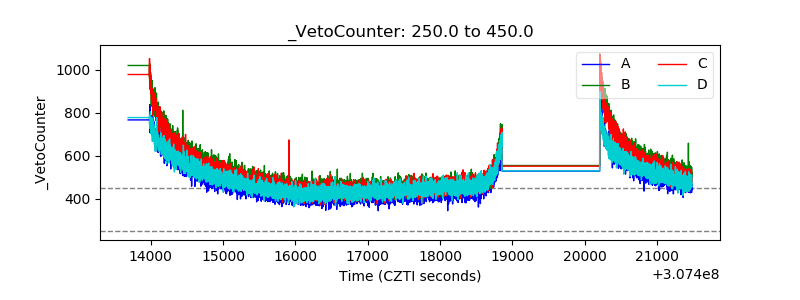 |