| Param | Original file | Final file |
|---|---|---|
| Filename | modeM0/AS1A06_002T02_9000003206_21640cztM0_level2.evt | modeM0/AS1A06_002T02_9000003206_21640cztM0_level2_quad_clean.evt |
| Size (bytes) | 490,726,080 | 82,025,280 |
| Size | 468.0 MB | 78.2 MB |
| Events in quadrant A | 3,296,152 | 520,052 |
| Events in quadrant B | 3,771,295 | 535,264 |
| Events in quadrant C | 3,315,334 | 499,049 |
| Events in quadrant D | 4,038,939 | 477,183 |
| Mode M0 | |||
|---|---|---|---|
| Quadrant | BADHDUFLAG | Total packets | Discarded packets |
| A | 0 | 13599 | 2 |
| B | 0 | 15206 | 2 |
| C | 0 | 13647 | 2 |
| D | 0 | 16111 | 2 |
| Mode M9 | |||
|---|---|---|---|
| Quadrant | BADHDUFLAG | Total packets | Discarded packets |
| A | 0 | 20 | 0 |
| B | 0 | 21 | 0 |
| C | 0 | 21 | 0 |
| D | 0 | 21 | 0 |
| Mode SS | |||
|---|---|---|---|
| Quadrant | BADHDUFLAG | Total packets | Discarded packets |
| A | 0 | 130 | 0 |
| B | 0 | 130 | 0 |
| C | 0 | 130 | 0 |
| D | 0 | 130 | 0 |
| Quadrant | Total seconds | Saturated seconds | Saturation percentage |
|---|---|---|---|
| A | 6491 | 21 | 0.323525% |
| B | 6491 | 103 | 1.586813% |
| C | 6490 | 71 | 1.093991% |
| D | 6490 | 52 | 0.801233% |
Noise dominated data is calculated using 1-second bins in cleaned event files. If a bin has >2000 counts, and if more than 50% of those come from <1% of pixels, then it is considered to be noise-dominated and hence unusable.
| Quadrant | # 1 sec bins | Bins with >0 counts | Bins with >2000 counts | High rate bins dominated by noise | Noise dominated (total time) | Noise dominated (detector-on time) | Marked lightcurve |
|---|---|---|---|---|---|---|---|
| A | 7876 | 6492 | 0 | 0 | 0.00% | 0.00% | 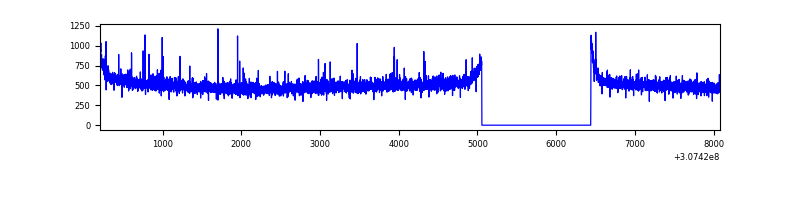 |
| B | 7876 | 6492 | 50 | 50 | 0.63% | 0.77% | 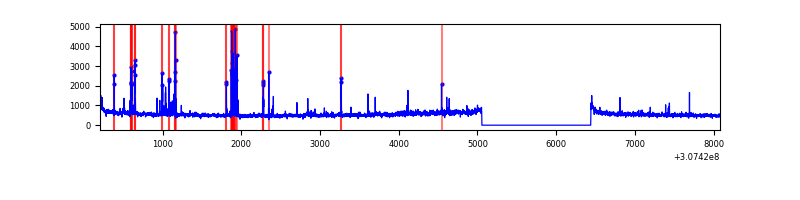 |
| C | 7875 | 6491 | 1 | 1 | 0.01% | 0.02% | 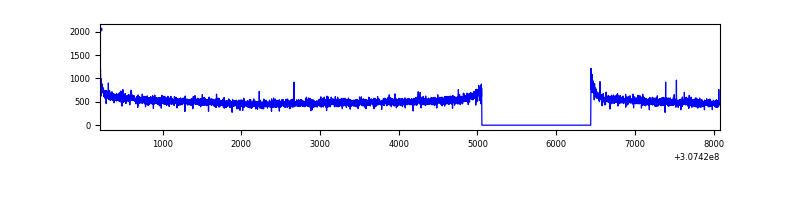 |
| D | 7875 | 6491 | 32 | 32 | 0.41% | 0.49% | 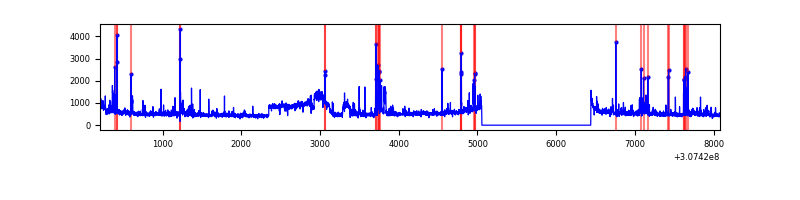 |
Top three noisy pixels from each quadrant. If the there are fewer than three noisy pixels in the level2.evt file, extra rows are filled as -1
| Pixel properties | Quadrant properties | ||||||
|---|---|---|---|---|---|---|---|
| Quadrant | DetID | PixID | Counts | Sigma | Mean | Median | Sigma |
| A | 10 | 253 | 24236 | 139.01 | 850 | 834 | 168.3 |
| A | 13 | 254 | 9276 | 50.15 | 850 | 834 | 168.3 |
| A | 0 | 226 | 7407 | 39.04 | 850 | 834 | 168.3 |
| B | 3 | 64 | 220619 | 1399.53 | 853 | 835 | 157.0 |
| B | 0 | 229 | 72138 | 454.04 | 853 | 835 | 157.0 |
| B | 6 | 36 | 43581 | 272.2 | 853 | 835 | 157.0 |
| C | 14 | 238 | 132296 | 697.05 | 813 | 820 | 188.6 |
| C | 13 | 61 | 5719 | 25.97 | 813 | 820 | 188.6 |
| C | 10 | 34 | 5206 | 23.25 | 813 | 820 | 188.6 |
| D | 13 | 104 | 446223 | 2328.99 | 807 | 786 | 191.3 |
| D | 1 | 52 | 166567 | 866.79 | 807 | 786 | 191.3 |
| D | 2 | 136 | 132356 | 687.92 | 807 | 786 | 191.3 |
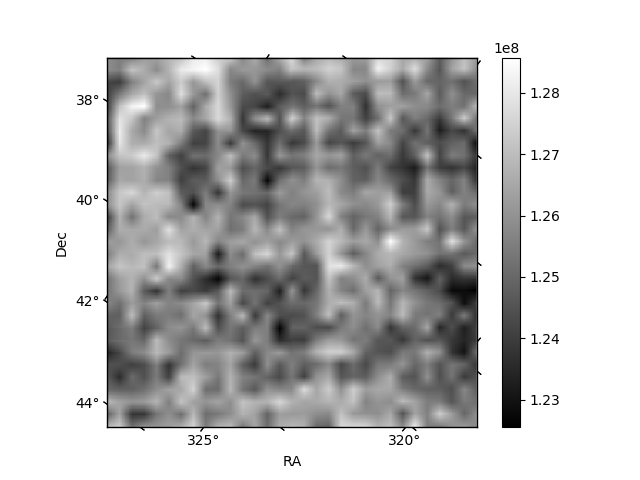
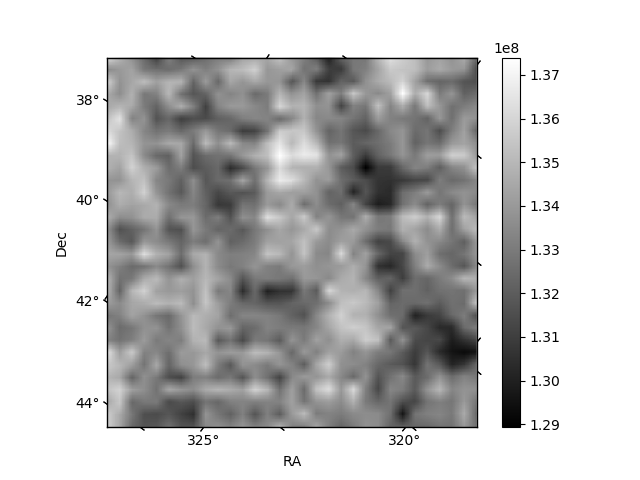
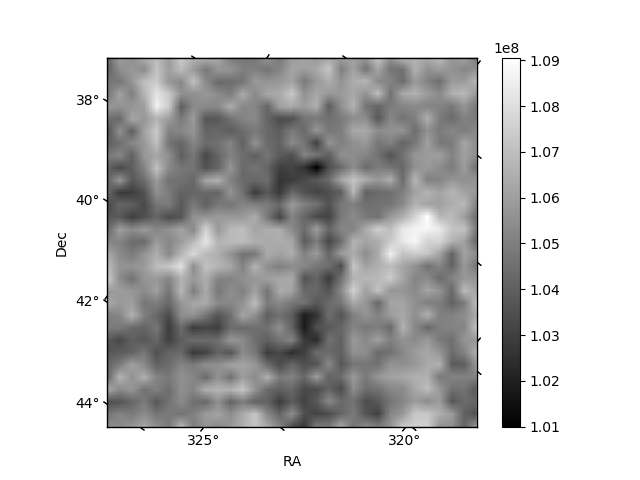
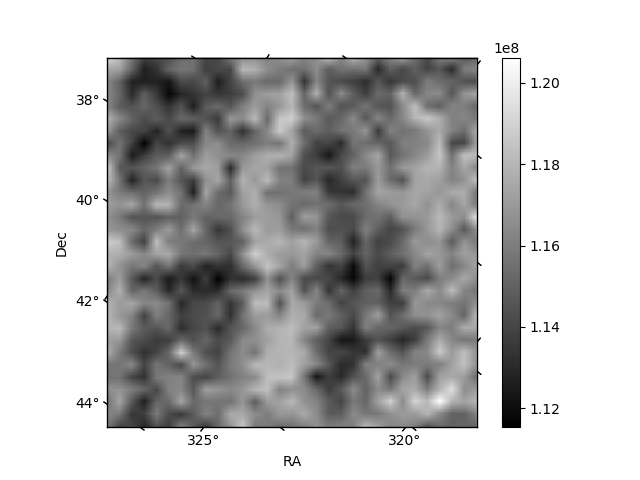
Histogram calculated using DETX and DETY for each event in the final _common_clean file
| Quadrant A | 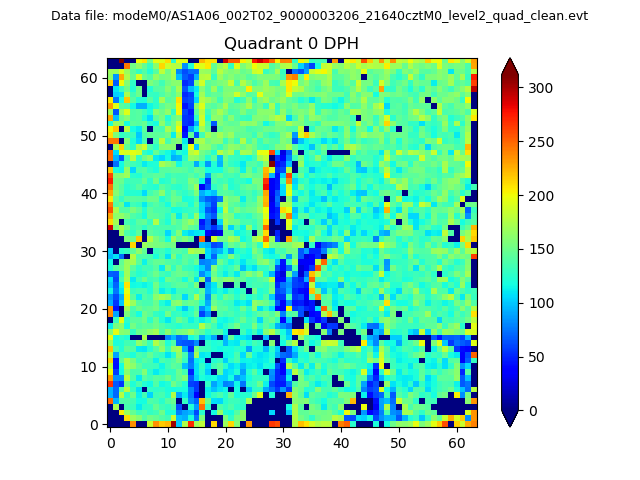 |
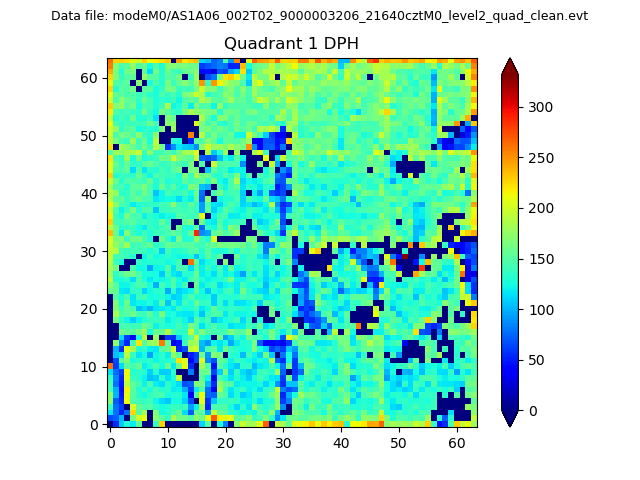 |
Quadrant B |
|---|---|---|---|
| Quadrant D | 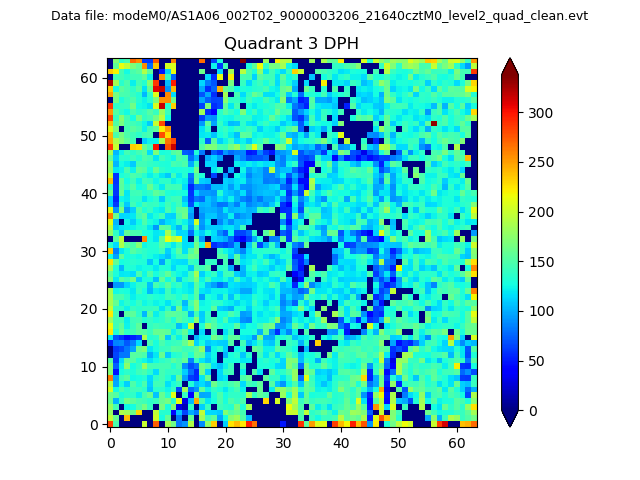 |
 |
Quadrant C |
| Plot type | Count rate plots | Images |
|---|---|---|
| Comparison with Poisson distribution Blue bars denote a histogram of data divided into 1 sec bins. Red curve is a Poisson curve with rate = median count rate of data. |
 |
 |
| Quadrant-wise count rates Data is divided into 100 sec bins |
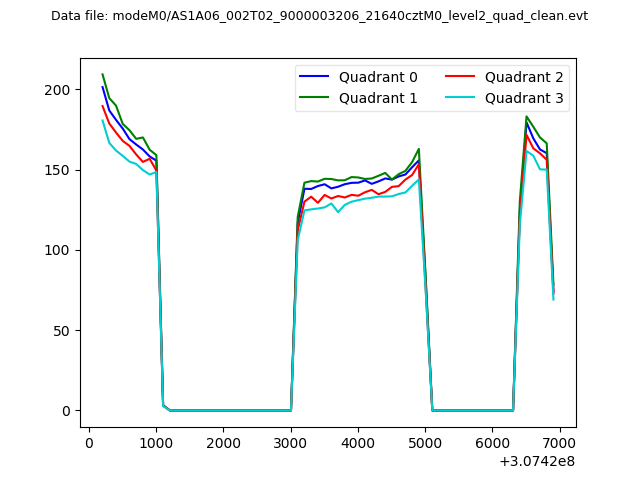 |
|
| Module-wise count rates for Quadrant A Data is divided into 100 sec bins |
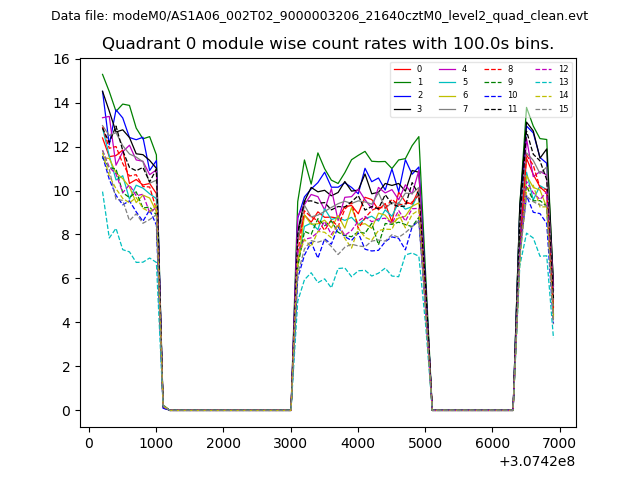 |
 |
| Module-wise count rates for Quadrant B Data is divided into 100 sec bins |
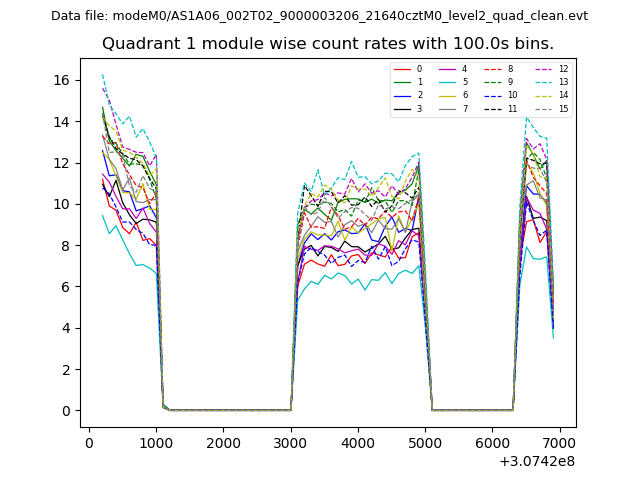 |
 |
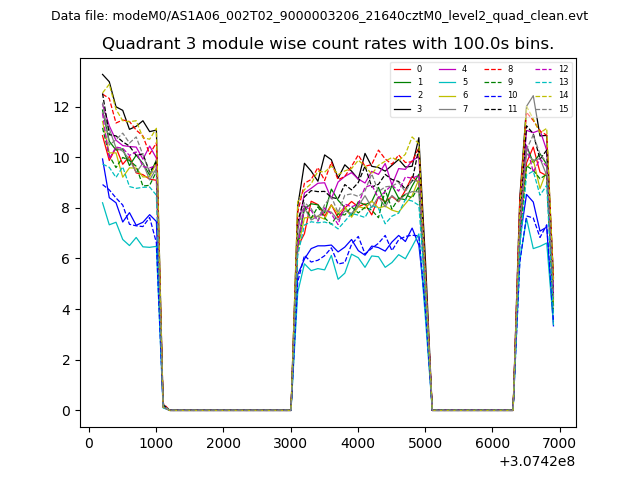
| Module-wise count rates for Quadrant C Data is divided into 100 sec bins |
 |
 |
| Module-wise count rates for Quadrant D Data is divided into 100 sec bins |
 |
 |
| Parameter | Plot |
|---|---|
| CZT HV Monitor |  |
| D_VDD | 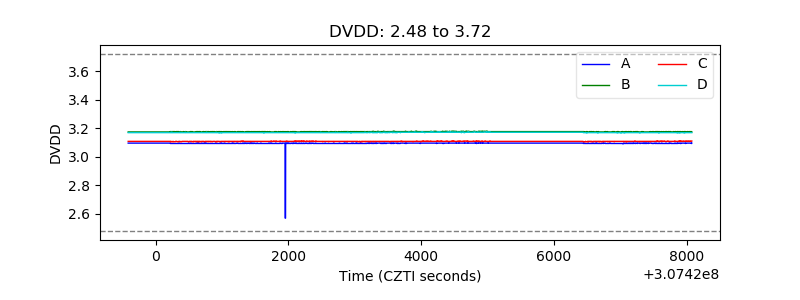 |
| Temperature 1 | 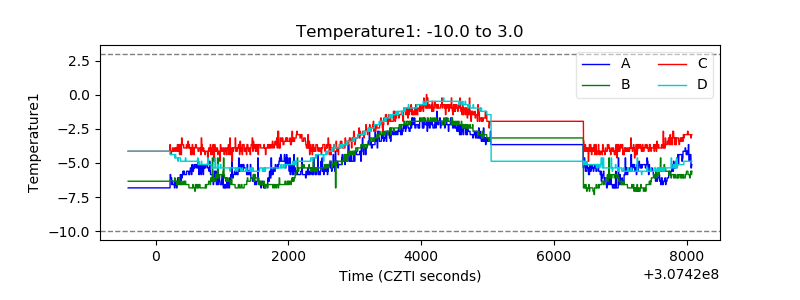 |
| Veto HV Monitor | 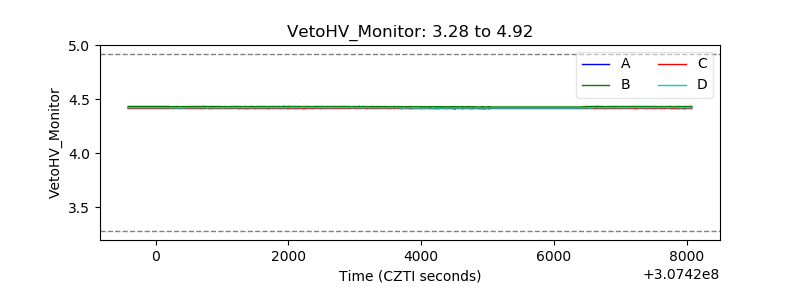 |
| Veto LLD | 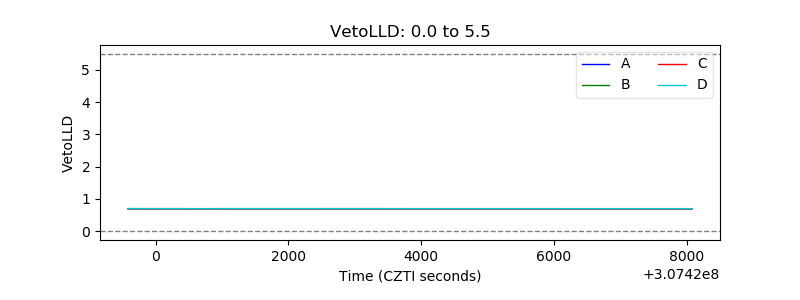 |
| Alpha Counter | 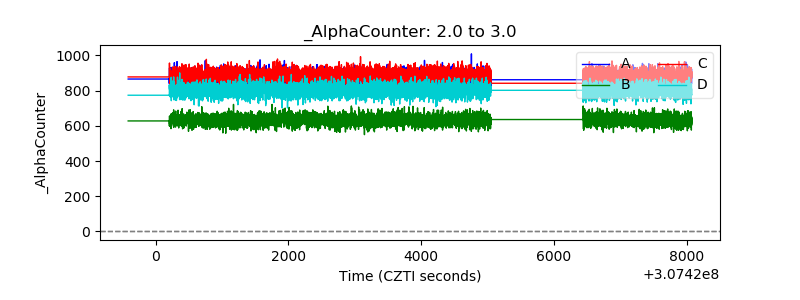 |
| _CPM_Rate | 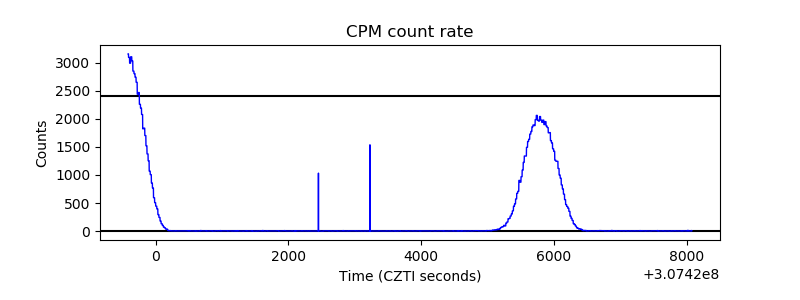 |
| CZT Counter | 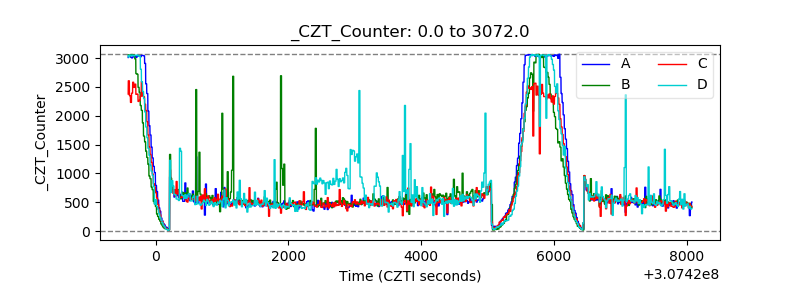 |
| +2.5 Volts monitor |  |
| +5 Volts monitor |  |
| _ROLL_ROT | 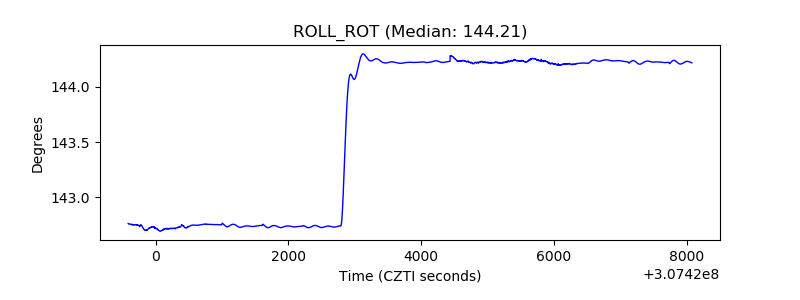 |
| _Roll_DEC | 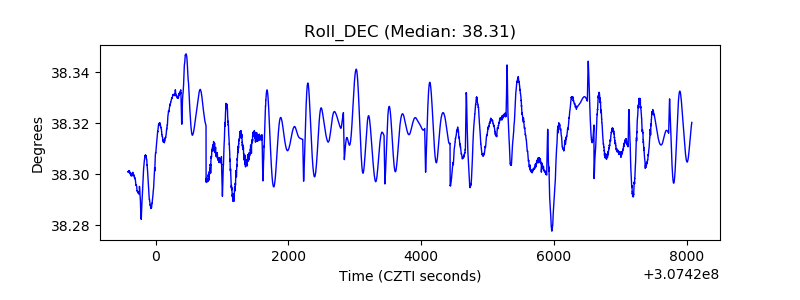 |
| _Roll_RA | 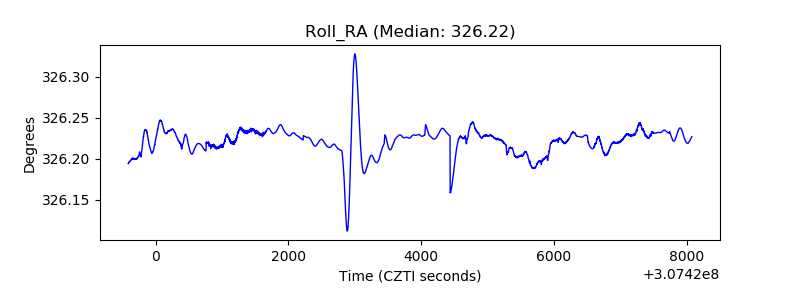 |
| Veto Counter | 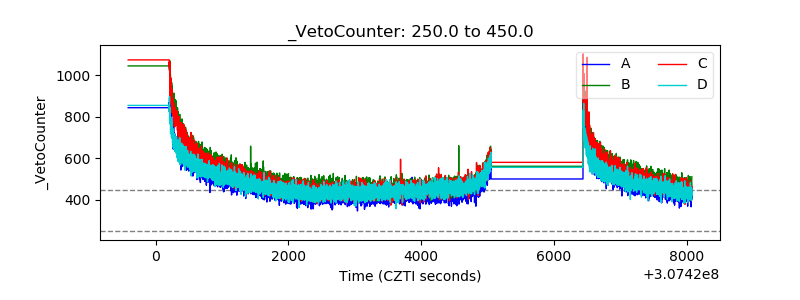 |