| Param | Original file | Final file |
|---|---|---|
| Filename | modeM0/AS1A06_002T02_9000003206_21642cztM0_level2.evt | modeM0/AS1A06_002T02_9000003206_21642cztM0_level2_quad_clean.evt |
| Size (bytes) | 463,645,440 | 74,473,920 |
| Size | 442.2 MB | 71.0 MB |
| Events in quadrant A | 3,284,231 | 454,393 |
| Events in quadrant B | 3,556,712 | 463,396 |
| Events in quadrant C | 3,322,139 | 437,102 |
| Events in quadrant D | 3,417,226 | 427,120 |
| Mode M0 | |||
|---|---|---|---|
| Quadrant | BADHDUFLAG | Total packets | Discarded packets |
| A | 0 | 13978 | 2 |
| B | 0 | 14563 | 2 |
| C | 0 | 14052 | 2 |
| D | 0 | 14552 | 2 |
| Mode M9 | |||
|---|---|---|---|
| Quadrant | BADHDUFLAG | Total packets | Discarded packets |
| A | 0 | 15 | 0 |
| B | 0 | 16 | 0 |
| C | 0 | 16 | 0 |
| D | 0 | 16 | 0 |
| Mode SS | |||
|---|---|---|---|
| Quadrant | BADHDUFLAG | Total packets | Discarded packets |
| A | 0 | 138 | 0 |
| B | 0 | 138 | 0 |
| C | 0 | 138 | 0 |
| D | 0 | 138 | 0 |
| Quadrant | Total seconds | Saturated seconds | Saturation percentage |
|---|---|---|---|
| A | 6786 | 98 | 1.444150% |
| B | 6785 | 130 | 1.915991% |
| C | 6785 | 117 | 1.724392% |
| D | 6785 | 63 | 0.928519% |
Noise dominated data is calculated using 1-second bins in cleaned event files. If a bin has >2000 counts, and if more than 50% of those come from <1% of pixels, then it is considered to be noise-dominated and hence unusable.
| Quadrant | # 1 sec bins | Bins with >0 counts | Bins with >2000 counts | High rate bins dominated by noise | Noise dominated (total time) | Noise dominated (detector-on time) | Marked lightcurve |
|---|---|---|---|---|---|---|---|
| A | 7666 | 6787 | 0 | 0 | 0.00% | 0.00% | 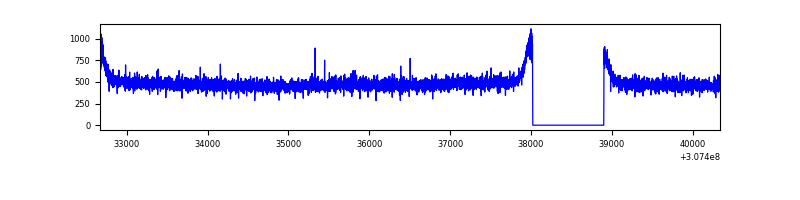 |
| B | 7665 | 6786 | 4 | 4 | 0.05% | 0.06% | 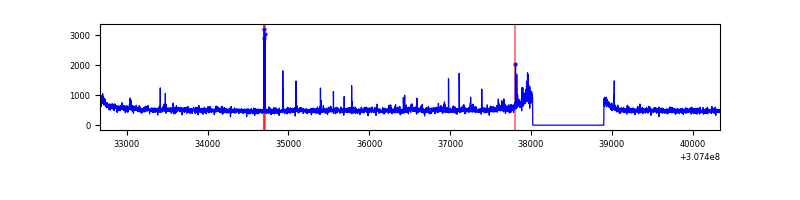 |
| C | 7665 | 6786 | 1 | 1 | 0.01% | 0.01% | 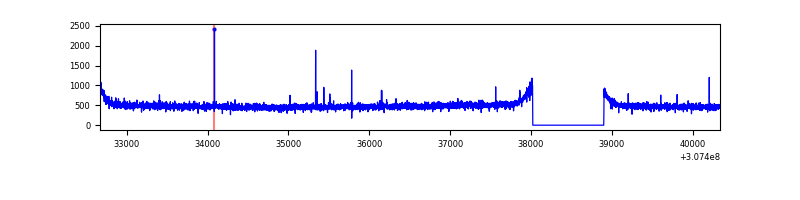 |
| D | 7665 | 6786 | 14 | 14 | 0.18% | 0.21% | 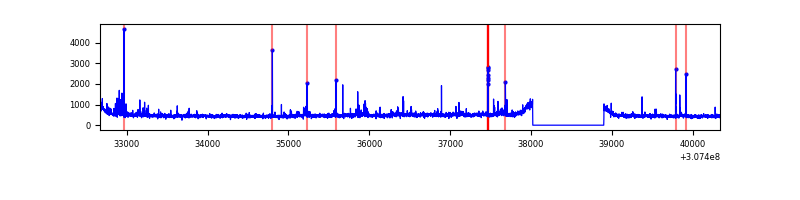 |
Top three noisy pixels from each quadrant. If the there are fewer than three noisy pixels in the level2.evt file, extra rows are filled as -1
| Pixel properties | Quadrant properties | ||||||
|---|---|---|---|---|---|---|---|
| Quadrant | DetID | PixID | Counts | Sigma | Mean | Median | Sigma |
| A | 13 | 254 | 10192 | 54.96 | 851 | 835 | 170.3 |
| A | 0 | 226 | 7485 | 39.06 | 851 | 835 | 170.3 |
| A | 3 | 137 | 7122 | 36.93 | 851 | 835 | 170.3 |
| B | 0 | 229 | 69380 | 418.09 | 853 | 831 | 164.0 |
| B | 3 | 64 | 42408 | 253.58 | 853 | 831 | 164.0 |
| B | 0 | 219 | 36276 | 216.18 | 853 | 831 | 164.0 |
| C | 14 | 238 | 126707 | 657.91 | 816 | 818 | 191.3 |
| C | 10 | 22 | 8034 | 37.71 | 816 | 818 | 191.3 |
| C | 13 | 61 | 5870 | 26.4 | 816 | 818 | 191.3 |
| D | 1 | 52 | 184306 | 906.27 | 825 | 802 | 202.5 |
| D | 2 | 136 | 59144 | 288.13 | 825 | 802 | 202.5 |
| D | 13 | 153 | 30376 | 146.06 | 825 | 802 | 202.5 |
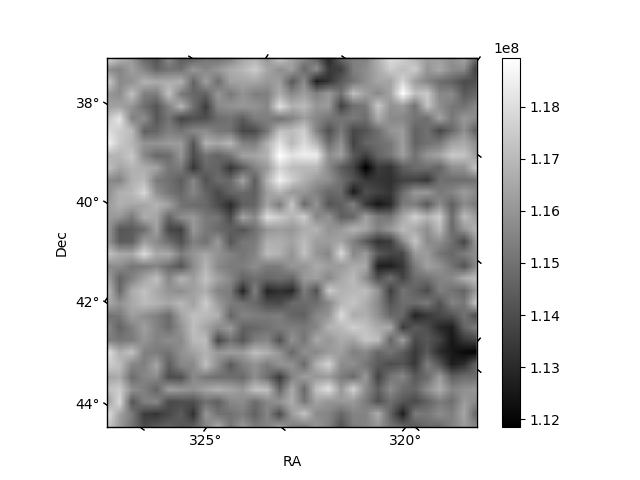
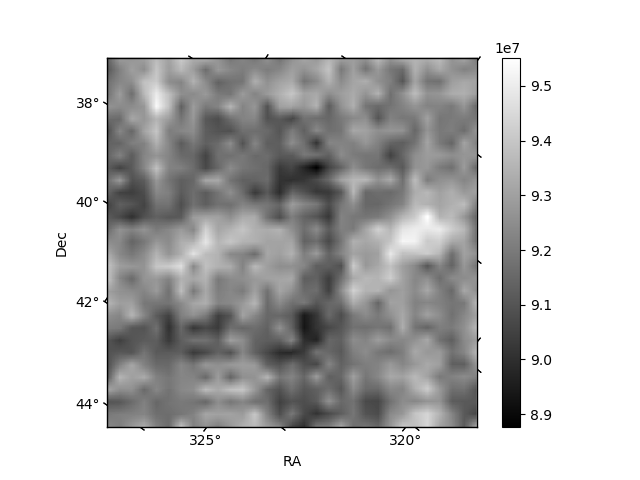
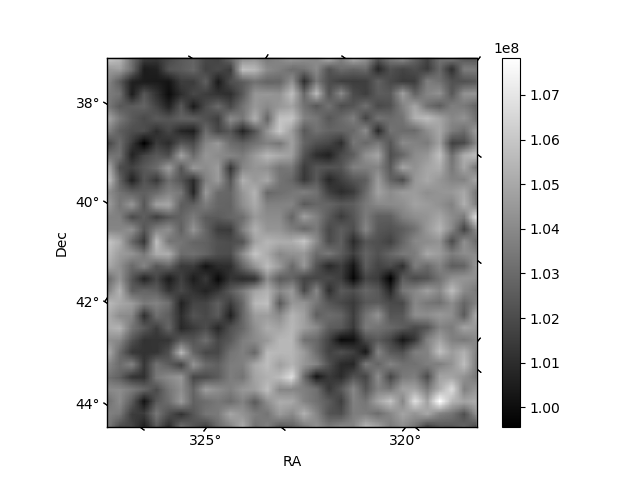
Histogram calculated using DETX and DETY for each event in the final _common_clean file
| Quadrant A | 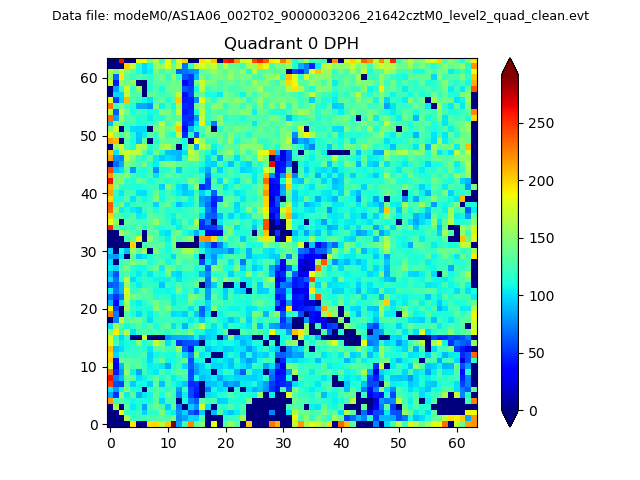 |
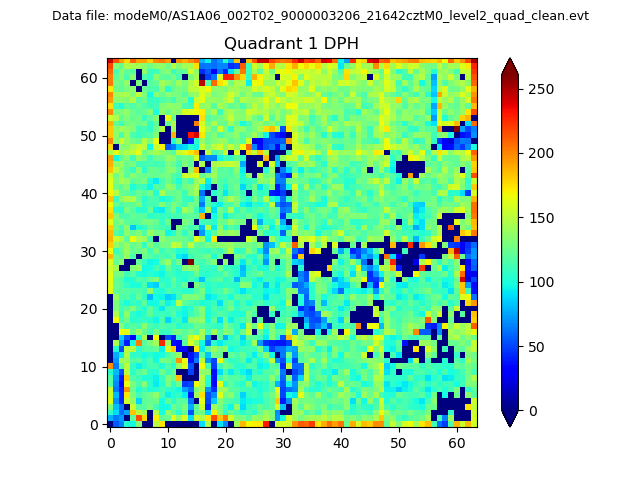 |
Quadrant B |
|---|---|---|---|
| Quadrant D | 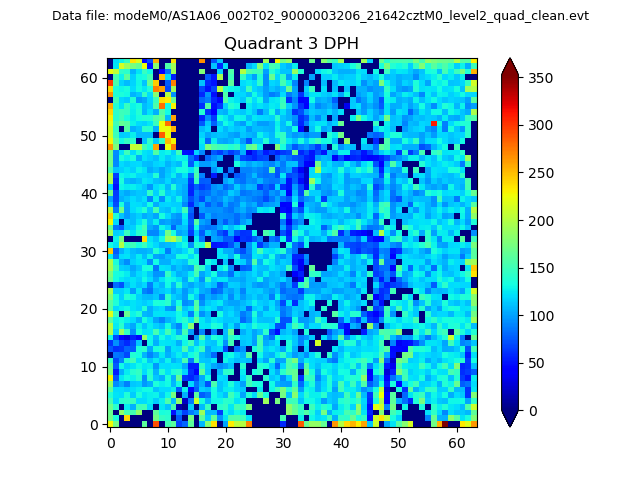 |
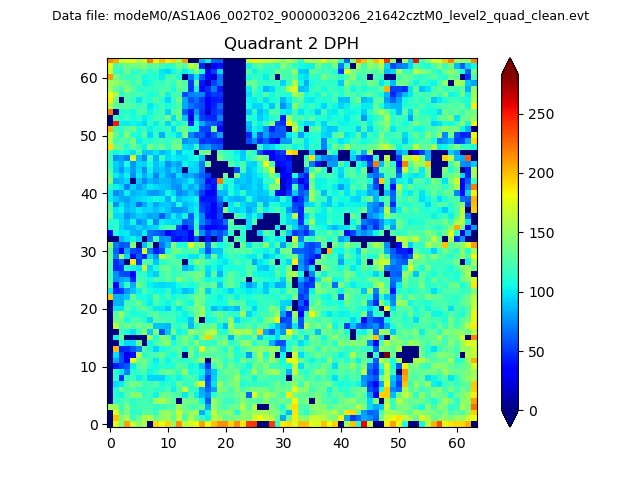 |
Quadrant C |
| Plot type | Count rate plots | Images |
|---|---|---|
| Comparison with Poisson distribution Blue bars denote a histogram of data divided into 1 sec bins. Red curve is a Poisson curve with rate = median count rate of data. |
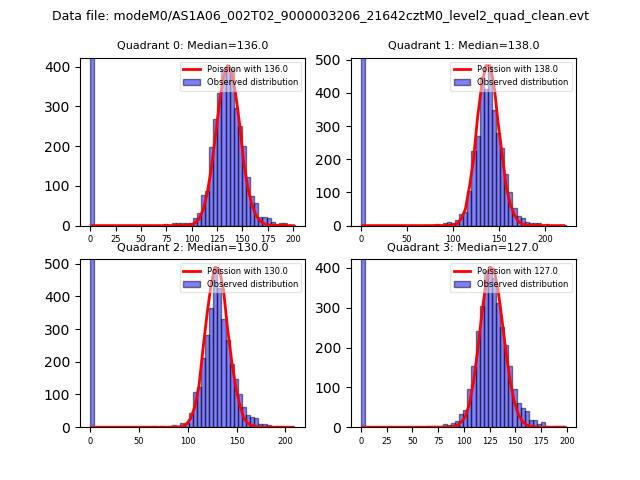 |
 |
| Quadrant-wise count rates Data is divided into 100 sec bins |
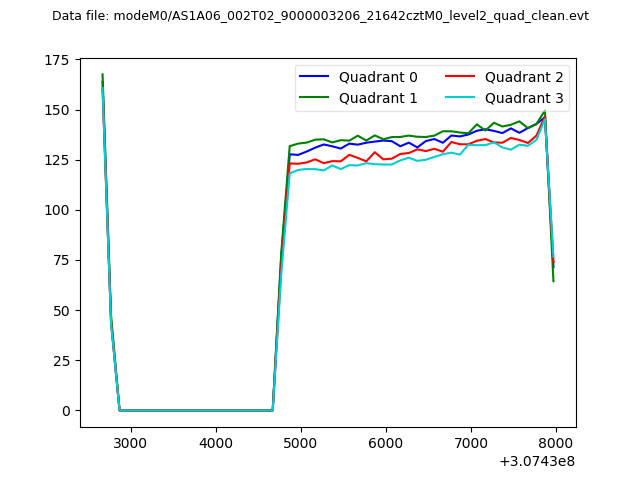 |
|
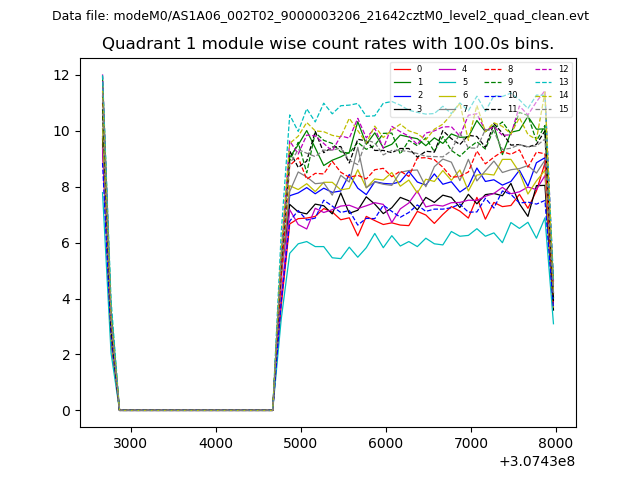
| Module-wise count rates for Quadrant A Data is divided into 100 sec bins |
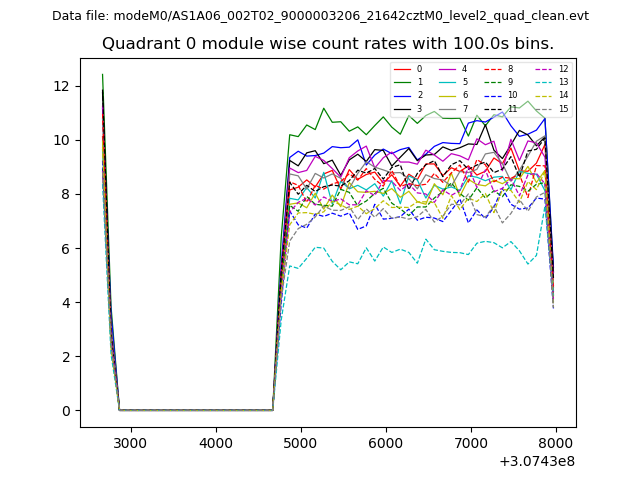 |
 |
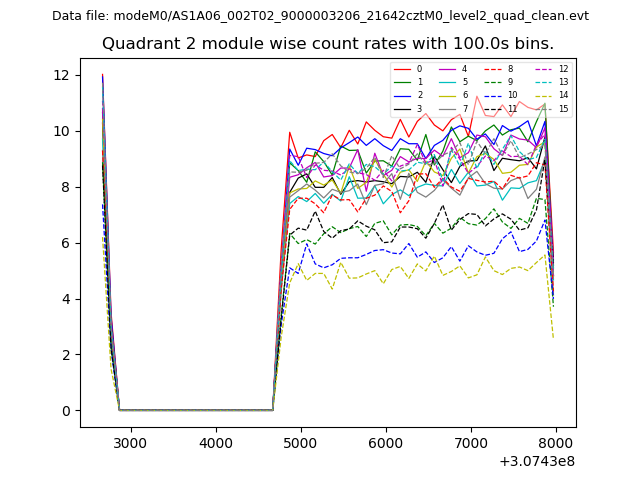
| Module-wise count rates for Quadrant B Data is divided into 100 sec bins |
 |
 |
| Module-wise count rates for Quadrant C Data is divided into 100 sec bins |
 |
 |
| Module-wise count rates for Quadrant D Data is divided into 100 sec bins |
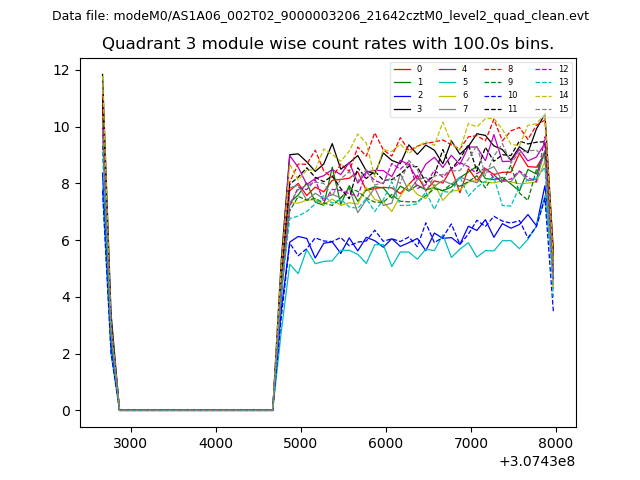 |
 |
| Parameter | Plot |
|---|---|
| CZT HV Monitor | 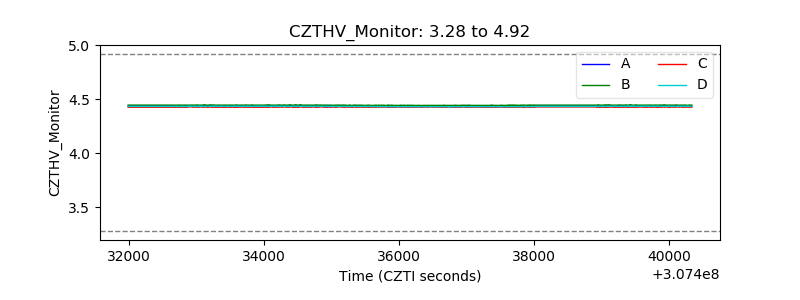 |
| D_VDD | 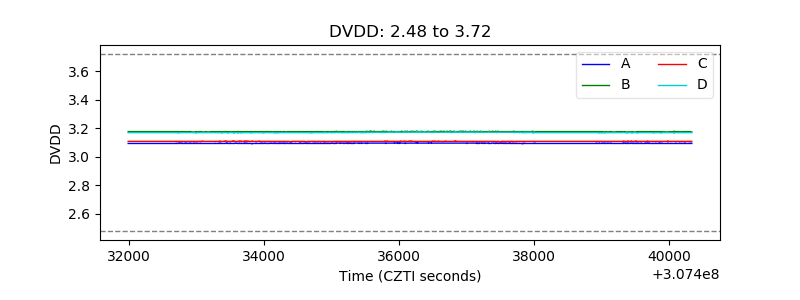 |
| Temperature 1 | 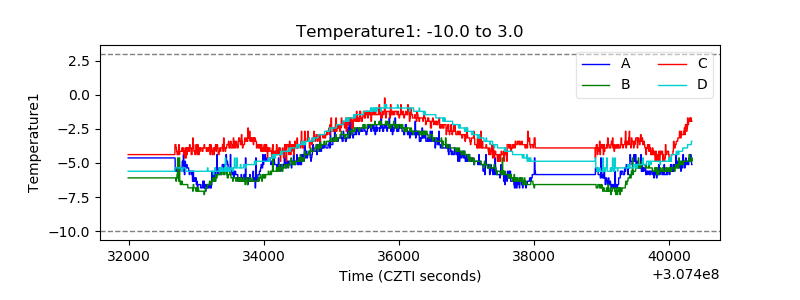 |
| Veto HV Monitor | 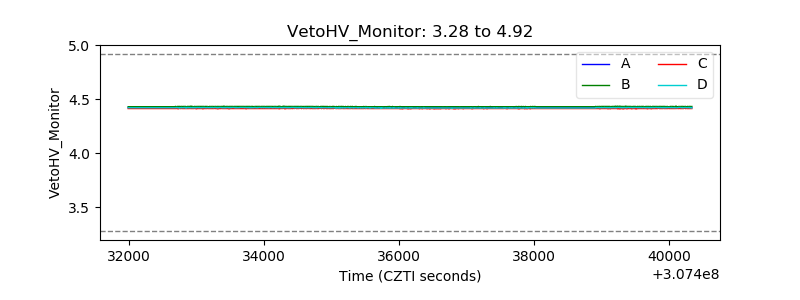 |
| Veto LLD | 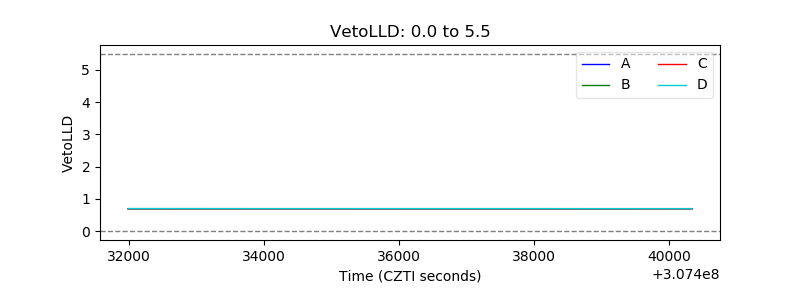 |
| Alpha Counter | 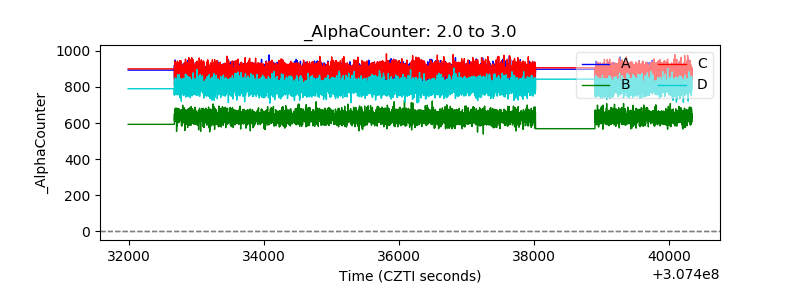 |
| _CPM_Rate |  |
| CZT Counter |  |
| +2.5 Volts monitor |  |
| +5 Volts monitor |  |
| _ROLL_ROT | 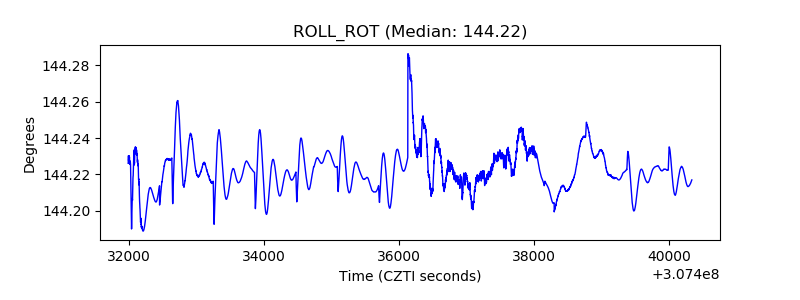 |
| _Roll_DEC | 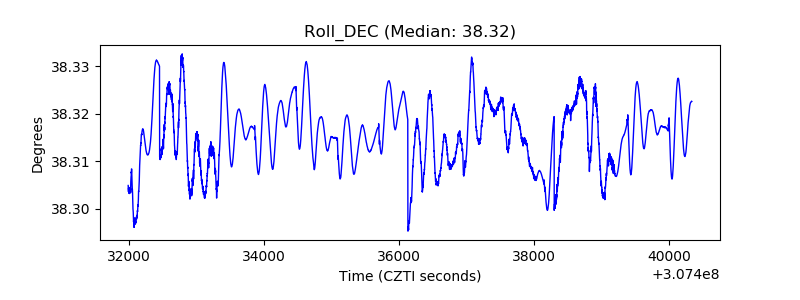 |
| _Roll_RA |  |
| Veto Counter | 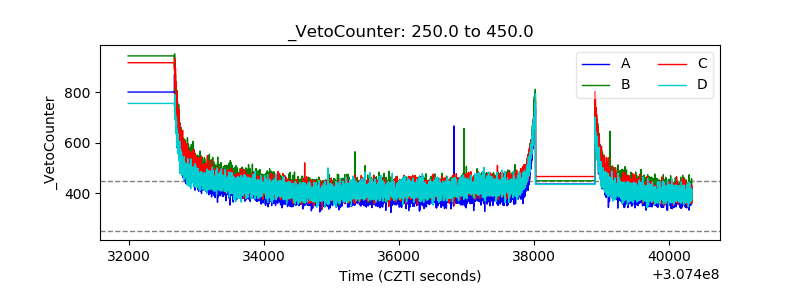 |