| Param | Original file | Final file |
|---|---|---|
| Filename | modeM0/AS1A06_002T02_9000003206_21643cztM0_level2.evt | modeM0/AS1A06_002T02_9000003206_21643cztM0_level2_quad_clean.evt |
| Size (bytes) | 488,655,360 | 83,206,080 |
| Size | 466.0 MB | 79.4 MB |
| Events in quadrant A | 3,442,450 | 511,091 |
| Events in quadrant B | 3,762,156 | 520,851 |
| Events in quadrant C | 3,485,849 | 496,127 |
| Events in quadrant D | 3,611,758 | 482,830 |
| Mode M0 | |||
|---|---|---|---|
| Quadrant | BADHDUFLAG | Total packets | Discarded packets |
| A | 0 | 14976 | 2 |
| B | 0 | 15544 | 2 |
| C | 0 | 15020 | 2 |
| D | 0 | 15624 | 2 |
| Mode M9 | |||
|---|---|---|---|
| Quadrant | BADHDUFLAG | Total packets | Discarded packets |
| A | 0 | 9 | 0 |
| B | 0 | 10 | 0 |
| C | 0 | 10 | 0 |
| D | 0 | 10 | 0 |
| Mode SS | |||
|---|---|---|---|
| Quadrant | BADHDUFLAG | Total packets | Discarded packets |
| A | 0 | 148 | 0 |
| B | 0 | 148 | 0 |
| C | 0 | 148 | 0 |
| D | 0 | 148 | 0 |
| Quadrant | Total seconds | Saturated seconds | Saturation percentage |
|---|---|---|---|
| A | 7314 | 137 | 1.873120% |
| B | 7314 | 181 | 2.474706% |
| C | 7314 | 154 | 2.105551% |
| D | 7314 | 122 | 1.668034% |
Noise dominated data is calculated using 1-second bins in cleaned event files. If a bin has >2000 counts, and if more than 50% of those come from <1% of pixels, then it is considered to be noise-dominated and hence unusable.
| Quadrant | # 1 sec bins | Bins with >0 counts | Bins with >2000 counts | High rate bins dominated by noise | Noise dominated (total time) | Noise dominated (detector-on time) | Marked lightcurve |
|---|---|---|---|---|---|---|---|
| A | 7749 | 7316 | 0 | 0 | 0.00% | 0.00% | 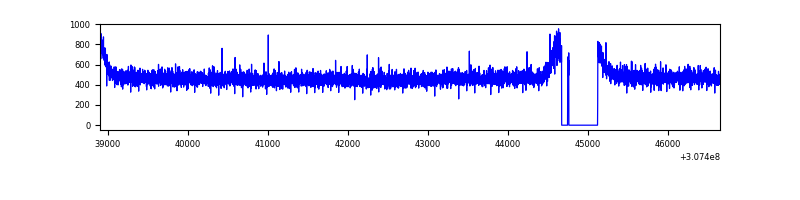 |
| B | 7749 | 7316 | 3 | 3 | 0.04% | 0.04% | 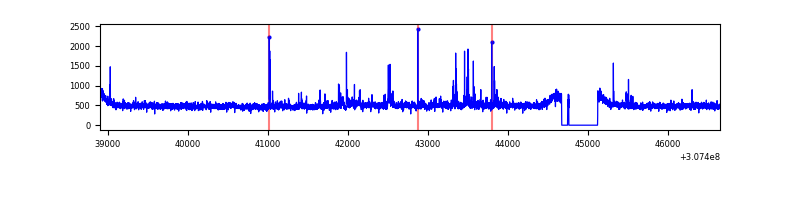 |
| C | 7749 | 7316 | 0 | 0 | 0.00% | 0.00% | 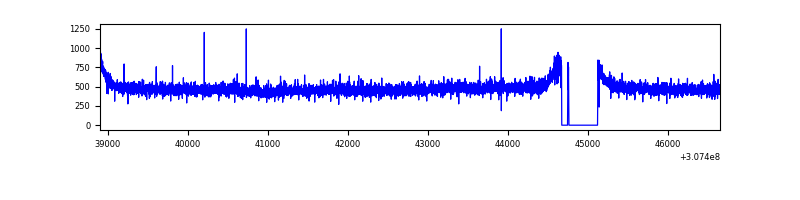 |
| D | 7749 | 7316 | 26 | 26 | 0.34% | 0.36% | 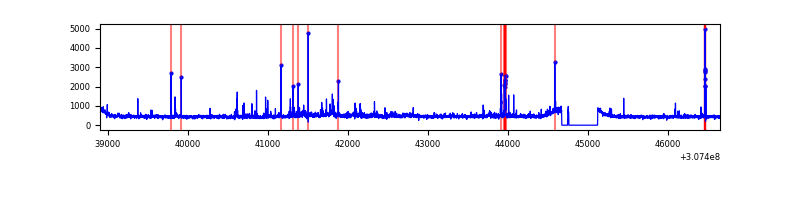 |
Top three noisy pixels from each quadrant. If the there are fewer than three noisy pixels in the level2.evt file, extra rows are filled as -1
| Pixel properties | Quadrant properties | ||||||
|---|---|---|---|---|---|---|---|
| Quadrant | DetID | PixID | Counts | Sigma | Mean | Median | Sigma |
| A | 13 | 254 | 11214 | 57.25 | 893 | 873 | 180.6 |
| A | 0 | 226 | 7864 | 38.71 | 893 | 873 | 180.6 |
| A | 3 | 137 | 7702 | 37.81 | 893 | 873 | 180.6 |
| B | 0 | 229 | 71796 | 415.81 | 895 | 873 | 170.6 |
| B | 3 | 64 | 48385 | 278.55 | 895 | 873 | 170.6 |
| B | 0 | 189 | 44206 | 254.05 | 895 | 873 | 170.6 |
| C | 14 | 238 | 136724 | 675.68 | 857 | 858 | 201.1 |
| C | 10 | 22 | 8196 | 36.49 | 857 | 858 | 201.1 |
| C | 13 | 61 | 5901 | 25.08 | 857 | 858 | 201.1 |
| D | 2 | 136 | 115839 | 546.88 | 867 | 841 | 210.3 |
| D | 1 | 52 | 108052 | 509.85 | 867 | 841 | 210.3 |
| D | 13 | 172 | 33928 | 157.35 | 867 | 841 | 210.3 |
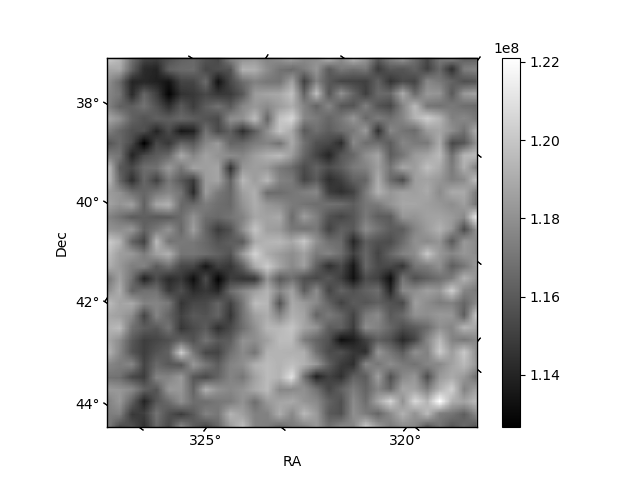
Histogram calculated using DETX and DETY for each event in the final _common_clean file
| Quadrant A |  |
 |
Quadrant B |
|---|---|---|---|
| Quadrant D |  |
 |
Quadrant C |
| Plot type | Count rate plots | Images |
|---|---|---|
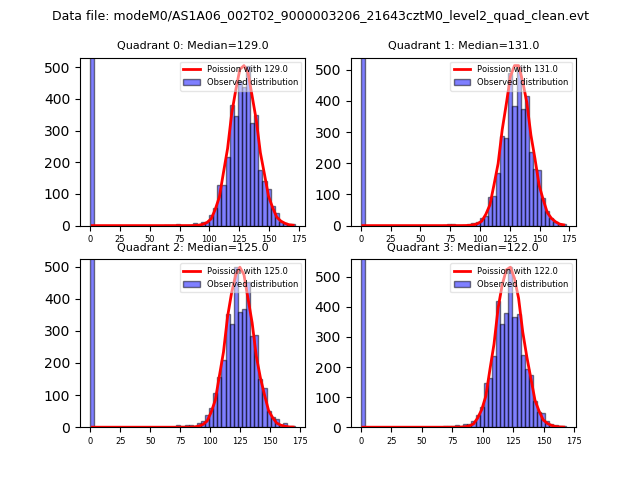
| Comparison with Poisson distribution Blue bars denote a histogram of data divided into 1 sec bins. Red curve is a Poisson curve with rate = median count rate of data. |
 |
 |
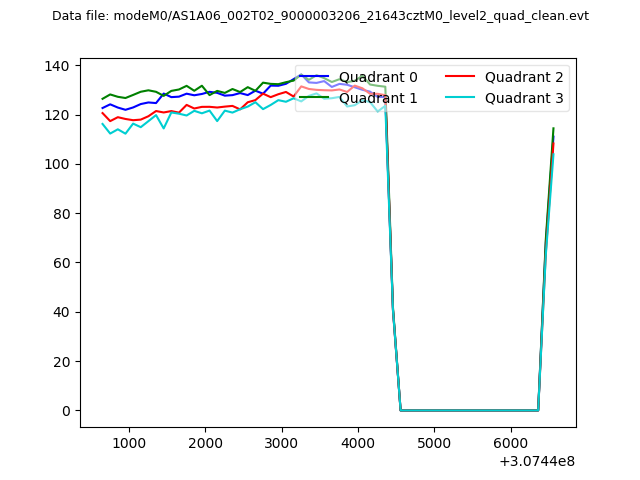
| Quadrant-wise count rates Data is divided into 100 sec bins |
 |
|
| Module-wise count rates for Quadrant A Data is divided into 100 sec bins |
 |
 |
| Module-wise count rates for Quadrant B Data is divided into 100 sec bins |
 |
 |
| Module-wise count rates for Quadrant C Data is divided into 100 sec bins |
 |
 |
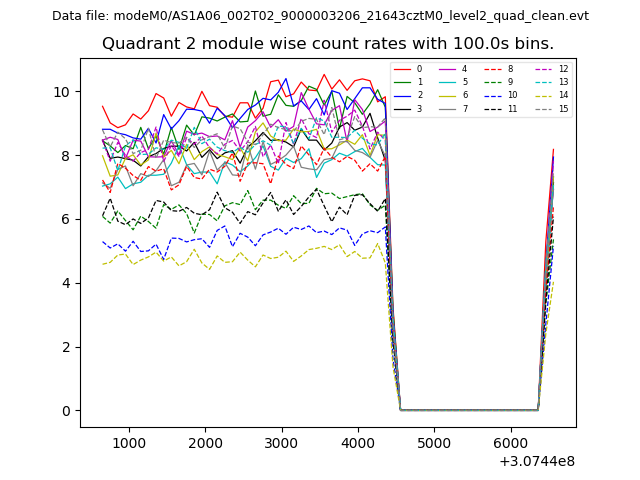
| Module-wise count rates for Quadrant D Data is divided into 100 sec bins |
 |
 |
| Parameter | Plot |
|---|---|
| CZT HV Monitor | 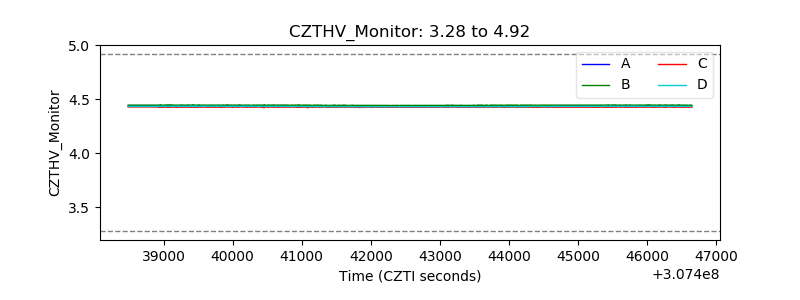 |
| D_VDD |  |
| Temperature 1 |  |
| Veto HV Monitor |  |
| Veto LLD |  |
| Alpha Counter | 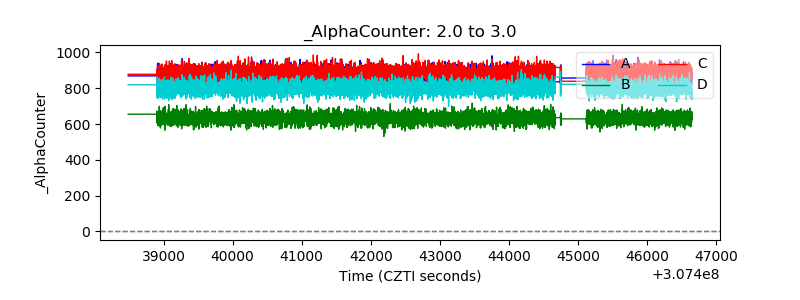 |
| _CPM_Rate | 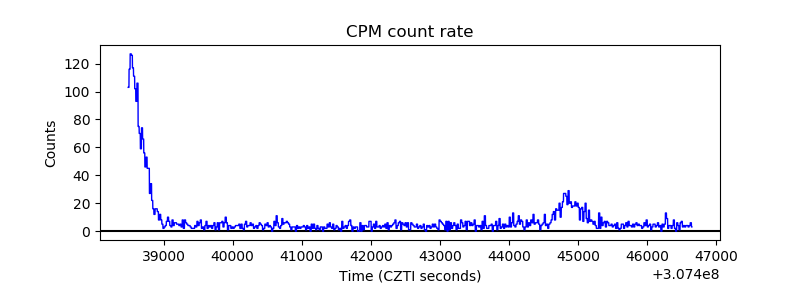 |
| CZT Counter |  |
| +2.5 Volts monitor |  |
| +5 Volts monitor |  |
| _ROLL_ROT |  |
| _Roll_DEC |  |
| _Roll_RA |  |
| Veto Counter |  |