| Param | Original file | Final file |
|---|---|---|
| Filename | modeM0/AS1A06_002T02_9000003206_21645cztM0_level2.evt | modeM0/AS1A06_002T02_9000003206_21645cztM0_level2_quad_clean.evt |
| Size (bytes) | 869,359,680 | 169,453,440 |
| Size | 829.1 MB | 161.6 MB |
| Events in quadrant A | 5,819,347 | 1,091,518 |
| Events in quadrant B | 6,363,096 | 1,111,326 |
| Events in quadrant C | 6,211,000 | 1,047,979 |
| Events in quadrant D | 7,087,349 | 1,016,511 |
| Mode M0 | |||
|---|---|---|---|
| Quadrant | BADHDUFLAG | Total packets | Discarded packets |
| A | 0 | 25678 | 1 |
| B | 0 | 26601 | 1 |
| C | 0 | 26550 | 1 |
| D | 0 | 29625 | 1 |
| Mode M9 | |||
|---|---|---|---|
| Quadrant | BADHDUFLAG | Total packets | Discarded packets |
| A | 0 | 3 | 0 |
| B | 0 | 3 | 0 |
| C | 0 | 3 | 0 |
| D | 0 | 3 | 0 |
| Mode SS | |||
|---|---|---|---|
| Quadrant | BADHDUFLAG | Total packets | Discarded packets |
| A | 0 | 254 | 0 |
| B | 0 | 254 | 0 |
| C | 0 | 254 | 0 |
| D | 0 | 254 | 0 |
| Quadrant | Total seconds | Saturated seconds | Saturation percentage |
|---|---|---|---|
| A | 12505 | 333 | 2.662935% |
| B | 12506 | 392 | 3.134495% |
| C | 12506 | 448 | 3.582281% |
| D | 12506 | 464 | 3.710219% |
Noise dominated data is calculated using 1-second bins in cleaned event files. If a bin has >2000 counts, and if more than 50% of those come from <1% of pixels, then it is considered to be noise-dominated and hence unusable.
| Quadrant | # 1 sec bins | Bins with >0 counts | Bins with >2000 counts | High rate bins dominated by noise | Noise dominated (total time) | Noise dominated (detector-on time) | Marked lightcurve |
|---|---|---|---|---|---|---|---|
| A | 12835 | 12507 | 0 | 0 | 0.00% | 0.00% | 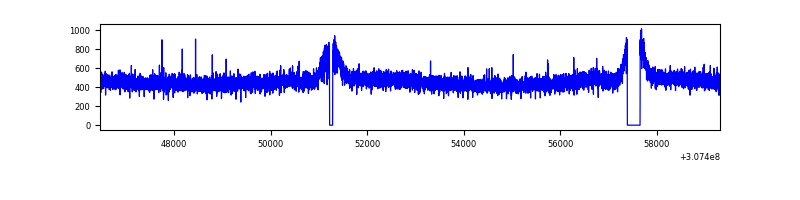 |
| B | 12836 | 12508 | 23 | 23 | 0.18% | 0.18% | 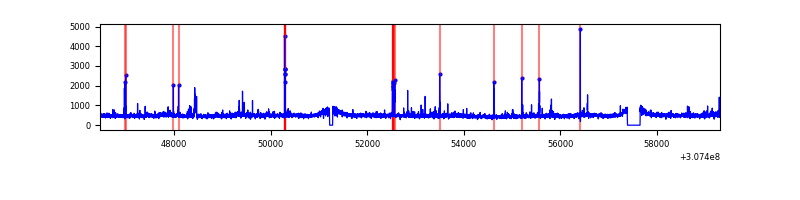 |
| C | 12836 | 12508 | 59 | 59 | 0.46% | 0.47% | 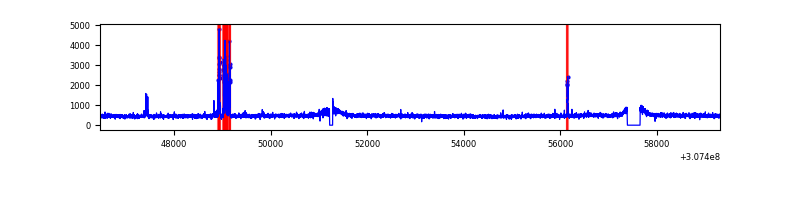 |
| D | 12836 | 12508 | 137 | 137 | 1.07% | 1.10% | 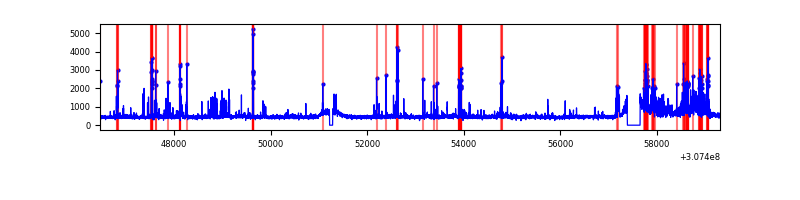 |
Top three noisy pixels from each quadrant. If the there are fewer than three noisy pixels in the level2.evt file, extra rows are filled as -1
| Pixel properties | Quadrant properties | ||||||
|---|---|---|---|---|---|---|---|
| Quadrant | DetID | PixID | Counts | Sigma | Mean | Median | Sigma |
| A | 13 | 254 | 17722 | 53.39 | 1508 | 1472 | 304.4 |
| A | 0 | 226 | 13059 | 38.07 | 1508 | 1472 | 304.4 |
| A | 3 | 137 | 13033 | 37.99 | 1508 | 1472 | 304.4 |
| B | 0 | 229 | 111954 | 385.69 | 1503 | 1460 | 286.5 |
| B | 3 | 64 | 104497 | 359.66 | 1503 | 1460 | 286.5 |
| B | 0 | 189 | 70060 | 239.45 | 1503 | 1460 | 286.5 |
| C | 3 | 233 | 258849 | 759.9 | 1447 | 1456 | 338.7 |
| C | 14 | 238 | 226684 | 664.94 | 1447 | 1456 | 338.7 |
| C | 10 | 23 | 51069 | 146.47 | 1447 | 1456 | 338.7 |
| D | 7 | 238 | 717938 | 2034.2 | 1458 | 1414 | 352.2 |
| D | 13 | 153 | 193631 | 545.7 | 1458 | 1414 | 352.2 |
| D | 1 | 52 | 190506 | 536.83 | 1458 | 1414 | 352.2 |
Histogram calculated using DETX and DETY for each event in the final _common_clean file
| Quadrant A | 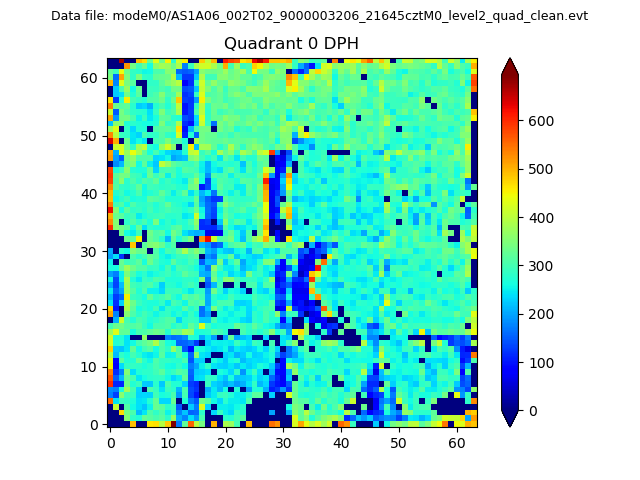 |
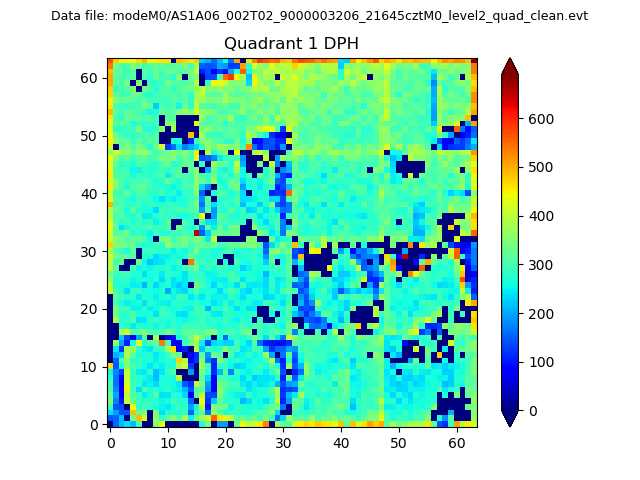 |
Quadrant B |
|---|---|---|---|
| Quadrant D |  |
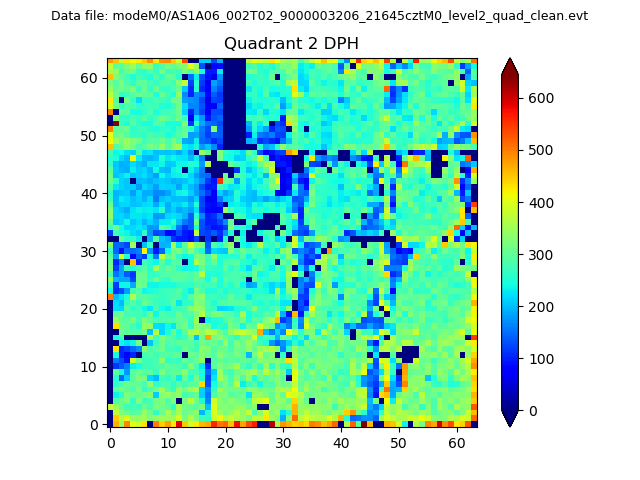 |
Quadrant C |
| Plot type | Count rate plots | Images |
|---|---|---|
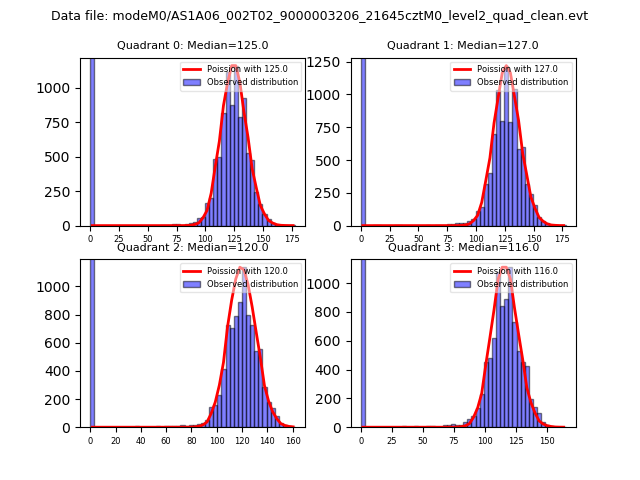
| Comparison with Poisson distribution Blue bars denote a histogram of data divided into 1 sec bins. Red curve is a Poisson curve with rate = median count rate of data. |
 |
 |
| Quadrant-wise count rates Data is divided into 100 sec bins |
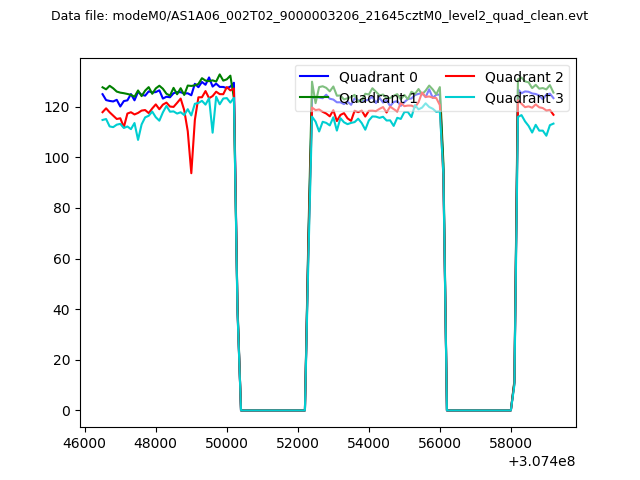 |
|
| Module-wise count rates for Quadrant A Data is divided into 100 sec bins |
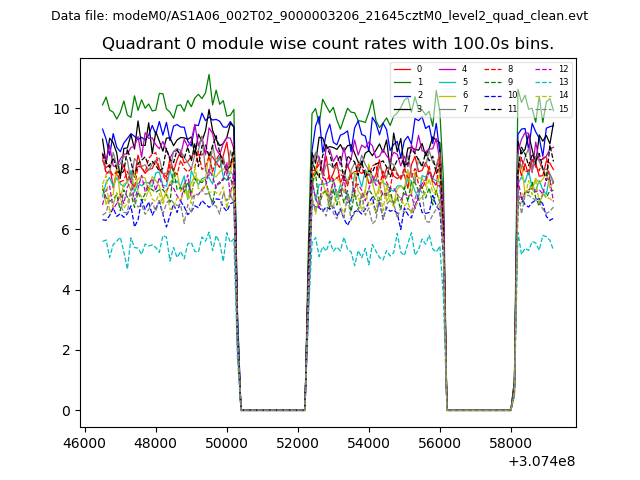 |
 |
| Module-wise count rates for Quadrant B Data is divided into 100 sec bins |
 |
 |
| Module-wise count rates for Quadrant C Data is divided into 100 sec bins |
 |
 |
| Module-wise count rates for Quadrant D Data is divided into 100 sec bins |
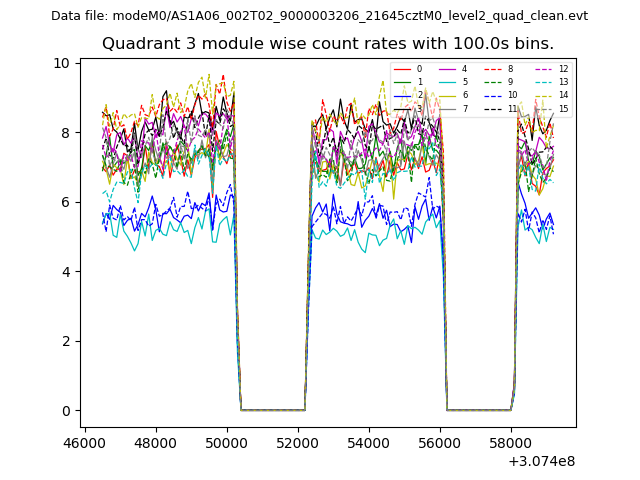 |
 |
| Parameter | Plot |
|---|---|
| CZT HV Monitor | 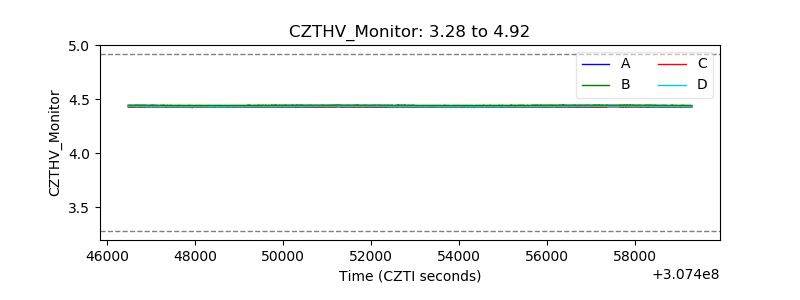 |
| D_VDD | 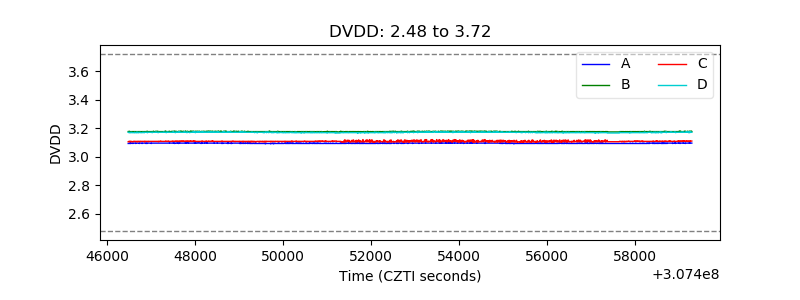 |
| Temperature 1 | 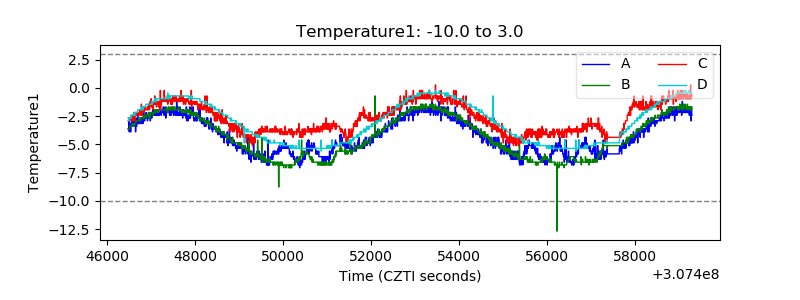 |
| Veto HV Monitor | 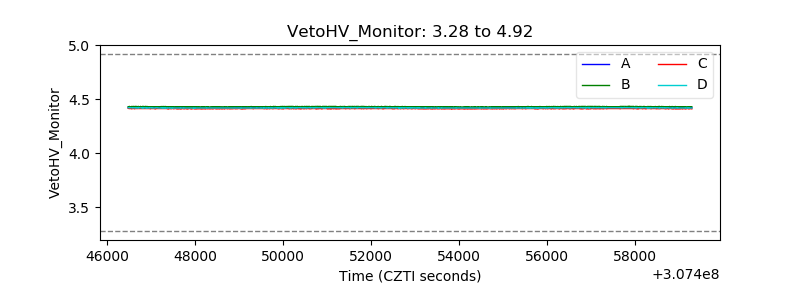 |
| Veto LLD | 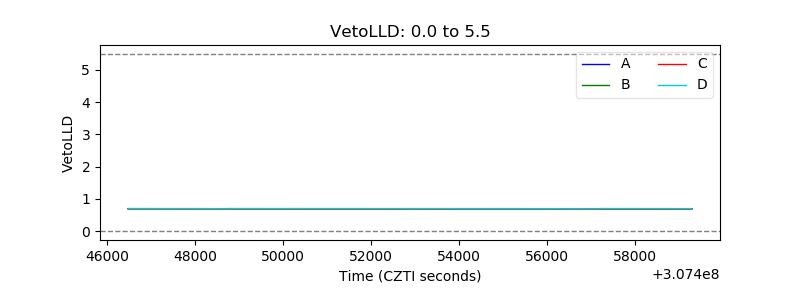 |
| Alpha Counter | 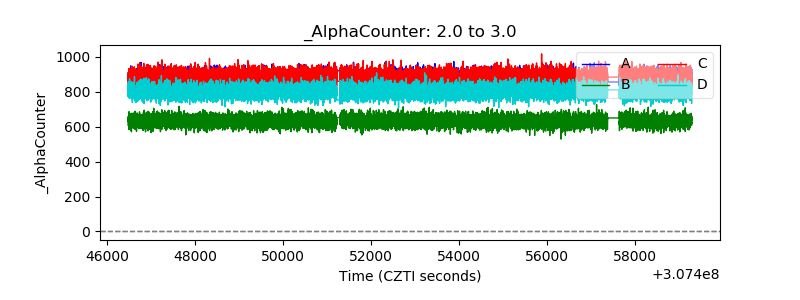 |
| _CPM_Rate | 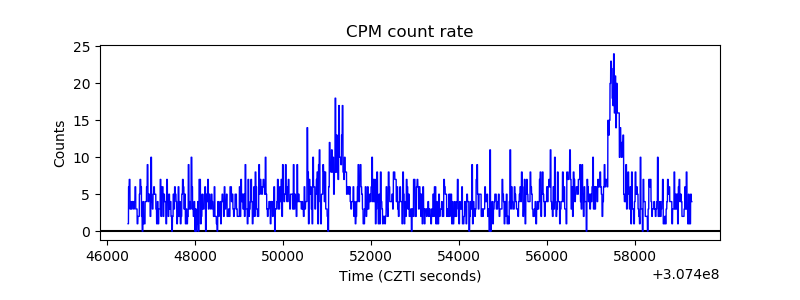 |
| CZT Counter | 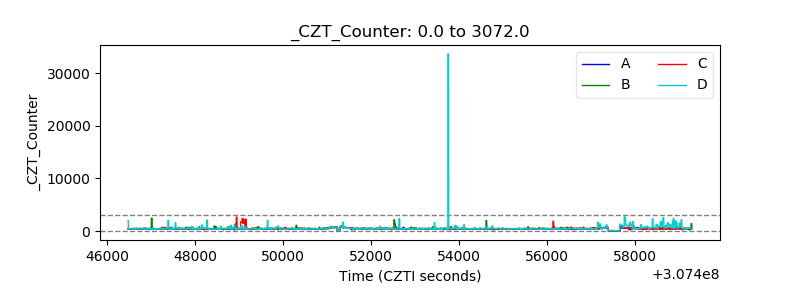 |
| +2.5 Volts monitor |  |
| +5 Volts monitor | 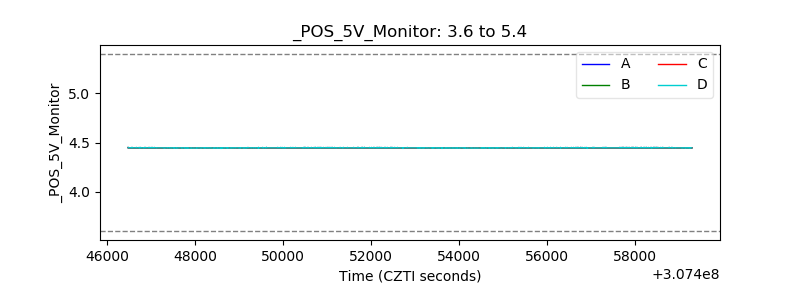 |
| _ROLL_ROT | 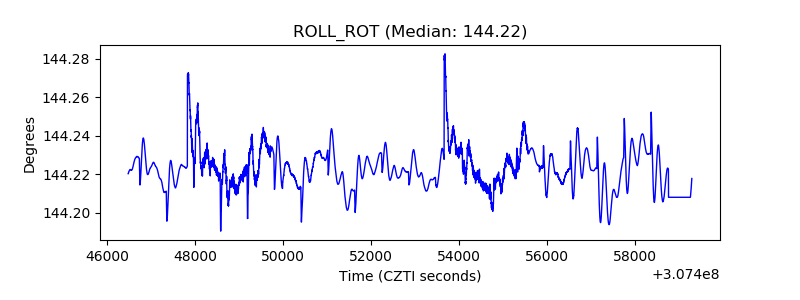 |
| _Roll_DEC | 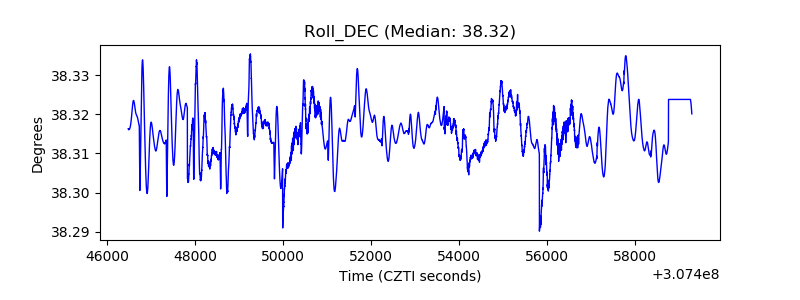 |
| _Roll_RA | 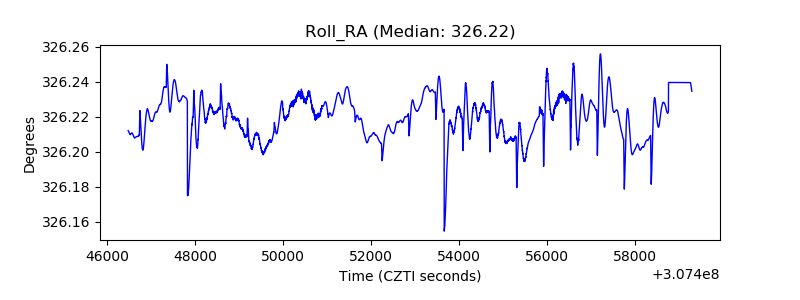 |
| Veto Counter | 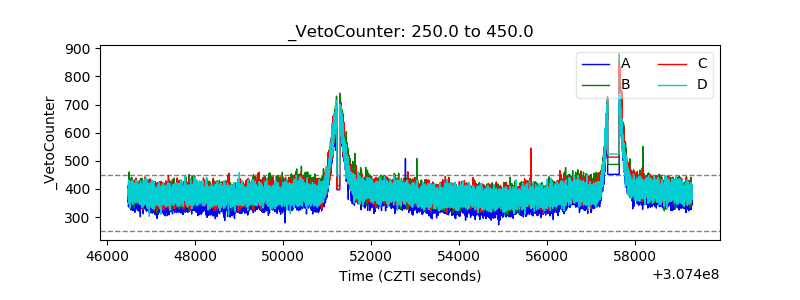 |