| Param | Original file | Final file |
|---|---|---|
| Filename | modeM0/AS1A06_002T02_9000003206_21647cztM0_level2.evt | modeM0/AS1A06_002T02_9000003206_21647cztM0_level2_quad_clean.evt |
| Size (bytes) | 896,575,680 | 170,331,840 |
| Size | 855.0 MB | 162.4 MB |
| Events in quadrant A | 5,775,746 | 1,101,617 |
| Events in quadrant B | 6,237,016 | 1,116,905 |
| Events in quadrant C | 5,737,731 | 1,071,443 |
| Events in quadrant D | 8,571,910 | 1,020,314 |
| Mode M0 | |||
|---|---|---|---|
| Quadrant | BADHDUFLAG | Total packets | Discarded packets |
| A | 0 | 25455 | 2 |
| B | 0 | 26261 | 2 |
| C | 0 | 25065 | 2 |
| D | 0 | 33902 | 2 |
| Mode M9 | |||
|---|---|---|---|
| Quadrant | BADHDUFLAG | Total packets | Discarded packets |
| A | 0 | 12 | 0 |
| B | 0 | 12 | 0 |
| C | 0 | 12 | 0 |
| D | 0 | 12 | 0 |
| Mode SS | |||
|---|---|---|---|
| Quadrant | BADHDUFLAG | Total packets | Discarded packets |
| A | 0 | 248 | 0 |
| B | 0 | 248 | 0 |
| C | 0 | 248 | 0 |
| D | 0 | 248 | 0 |
| Quadrant | Total seconds | Saturated seconds | Saturation percentage |
|---|---|---|---|
| A | 12279 | 150 | 1.221598% |
| B | 12280 | 155 | 1.262215% |
| C | 12280 | 184 | 1.498371% |
| D | 12280 | 484 | 3.941368% |
Noise dominated data is calculated using 1-second bins in cleaned event files. If a bin has >2000 counts, and if more than 50% of those come from <1% of pixels, then it is considered to be noise-dominated and hence unusable.
| Quadrant | # 1 sec bins | Bins with >0 counts | Bins with >2000 counts | High rate bins dominated by noise | Noise dominated (total time) | Noise dominated (detector-on time) | Marked lightcurve |
|---|---|---|---|---|---|---|---|
| A | 13389 | 12281 | 9 | 9 | 0.07% | 0.07% | 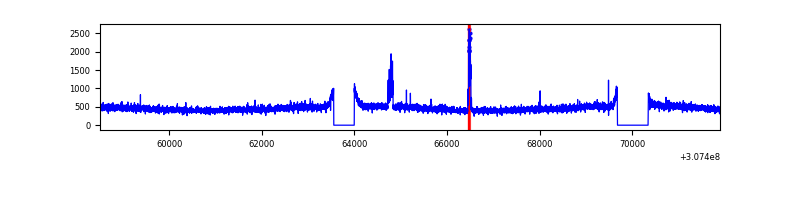 |
| B | 13390 | 12282 | 10 | 10 | 0.07% | 0.08% | 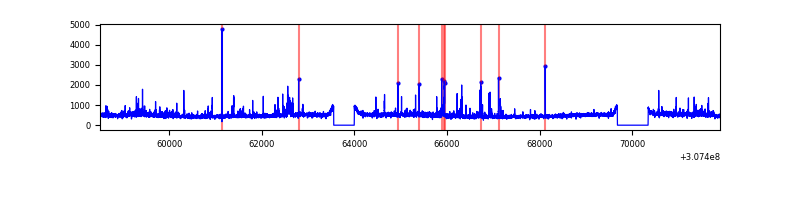 |
| C | 13390 | 12282 | 1 | 1 | 0.01% | 0.01% | 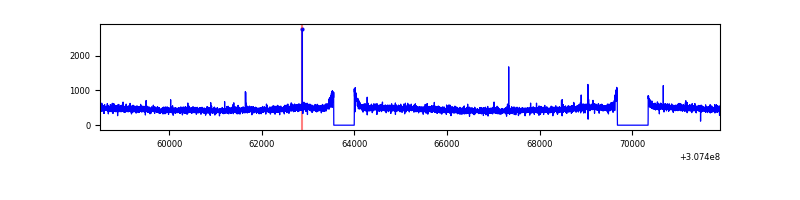 |
| D | 13390 | 12282 | 350 | 350 | 2.61% | 2.85% | 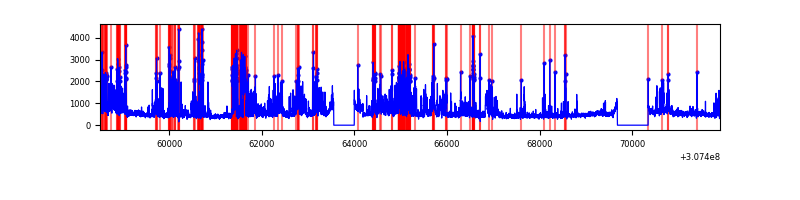 |
Top three noisy pixels from each quadrant. If the there are fewer than three noisy pixels in the level2.evt file, extra rows are filled as -1
| Pixel properties | Quadrant properties | ||||||
|---|---|---|---|---|---|---|---|
| Quadrant | DetID | PixID | Counts | Sigma | Mean | Median | Sigma |
| A | 15 | 236 | 136890 | 460.28 | 1462 | 1426 | 294.3 |
| A | 13 | 254 | 16771 | 52.14 | 1462 | 1426 | 294.3 |
| A | 3 | 137 | 12648 | 38.13 | 1462 | 1426 | 294.3 |
| B | 3 | 64 | 202286 | 715.54 | 1461 | 1421 | 280.7 |
| B | 0 | 245 | 124693 | 439.13 | 1461 | 1421 | 280.7 |
| B | 0 | 229 | 57127 | 198.44 | 1461 | 1421 | 280.7 |
| C | 14 | 238 | 223896 | 674.07 | 1411 | 1420 | 330.1 |
| C | 13 | 61 | 9821 | 25.45 | 1411 | 1420 | 330.1 |
| C | 10 | 22 | 9002 | 22.97 | 1411 | 1420 | 330.1 |
| D | 7 | 238 | 2364585 | 6871.8 | 1413 | 1368 | 343.9 |
| D | 13 | 104 | 312058 | 903.43 | 1413 | 1368 | 343.9 |
| D | 2 | 136 | 233010 | 673.57 | 1413 | 1368 | 343.9 |
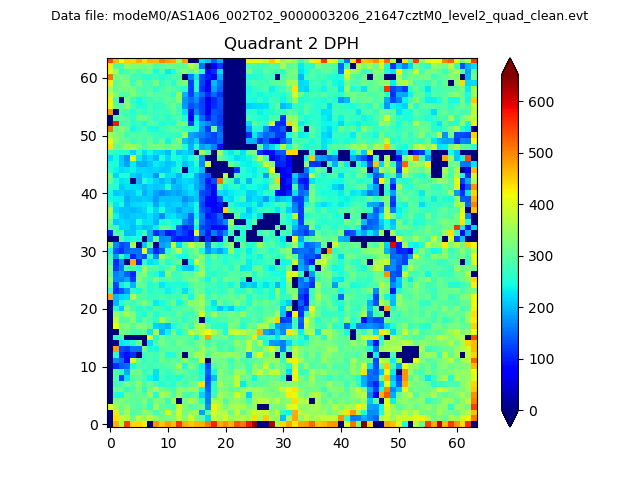
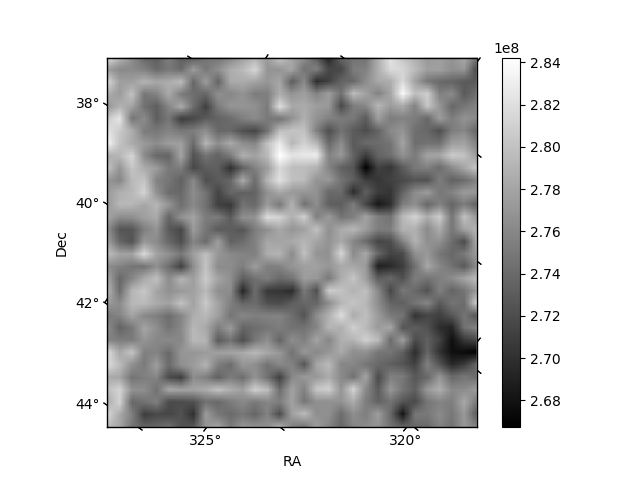
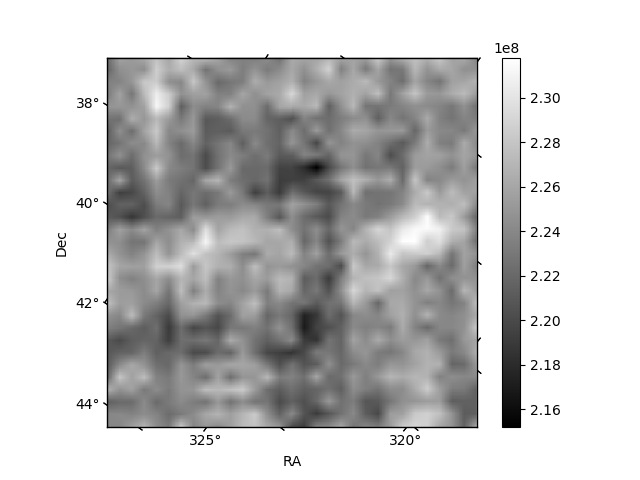
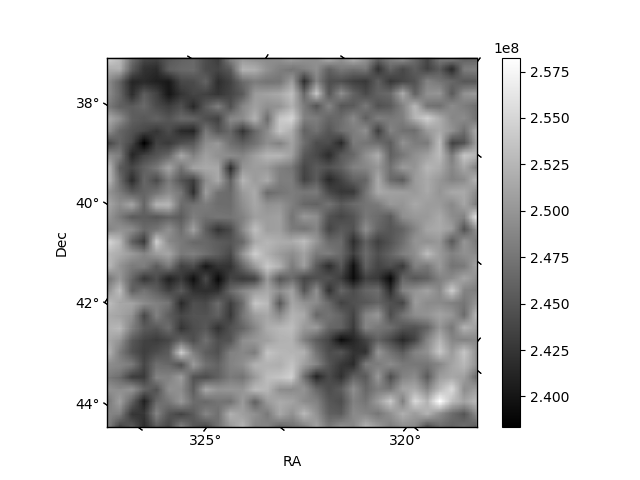
Histogram calculated using DETX and DETY for each event in the final _common_clean file
| Quadrant A | 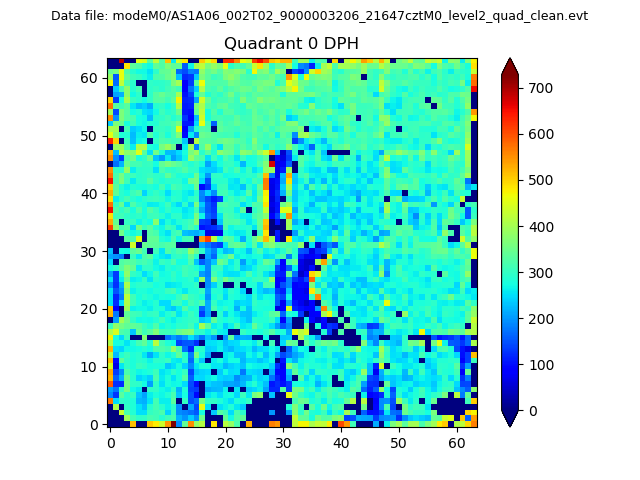 |
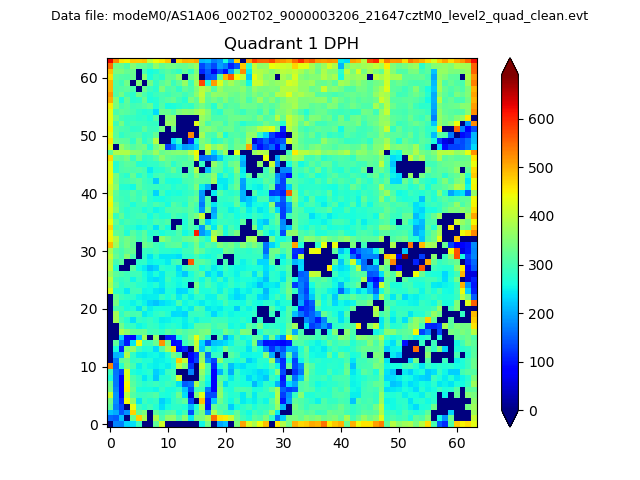 |
Quadrant B |
|---|---|---|---|
| Quadrant D | 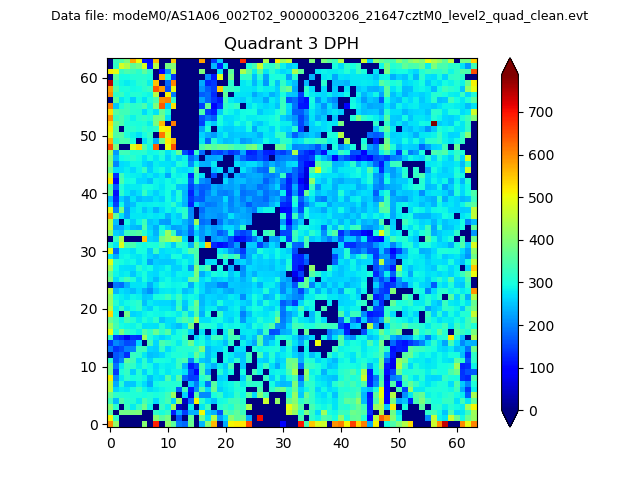 |
 |
Quadrant C |
| Plot type | Count rate plots | Images |
|---|---|---|
| Comparison with Poisson distribution Blue bars denote a histogram of data divided into 1 sec bins. Red curve is a Poisson curve with rate = median count rate of data. |
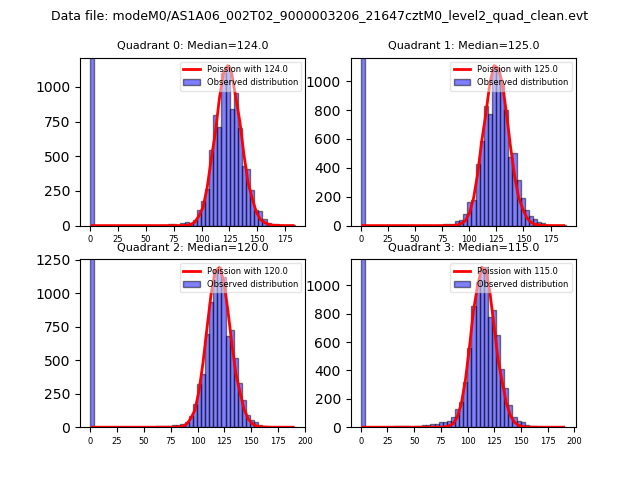 |
 |
| Quadrant-wise count rates Data is divided into 100 sec bins |
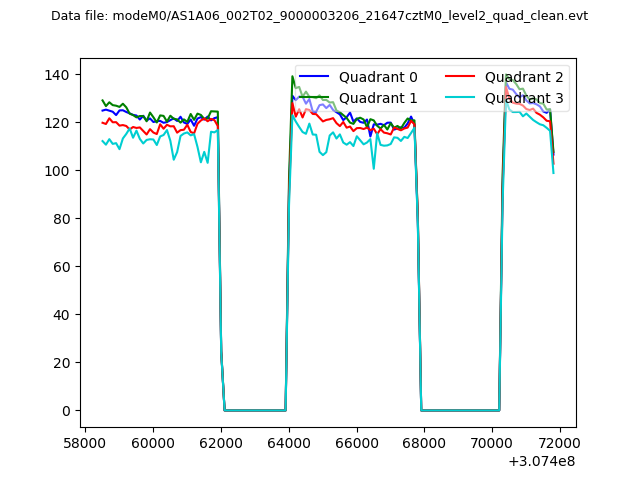 |
|
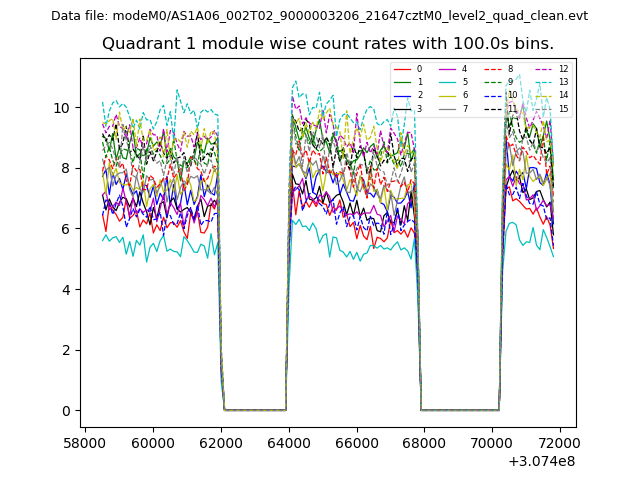
| Module-wise count rates for Quadrant A Data is divided into 100 sec bins |
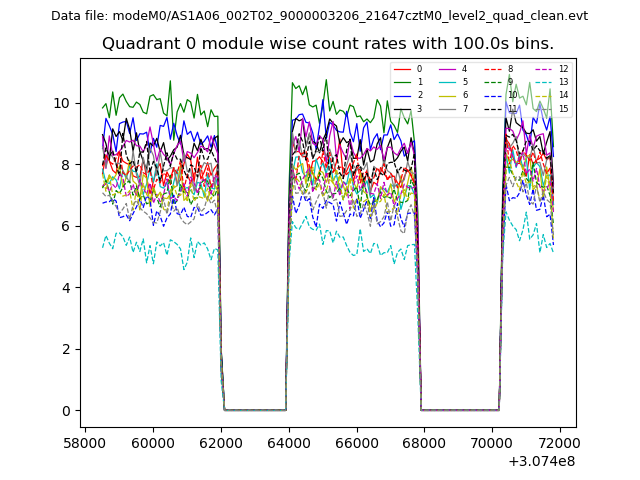 |
 |
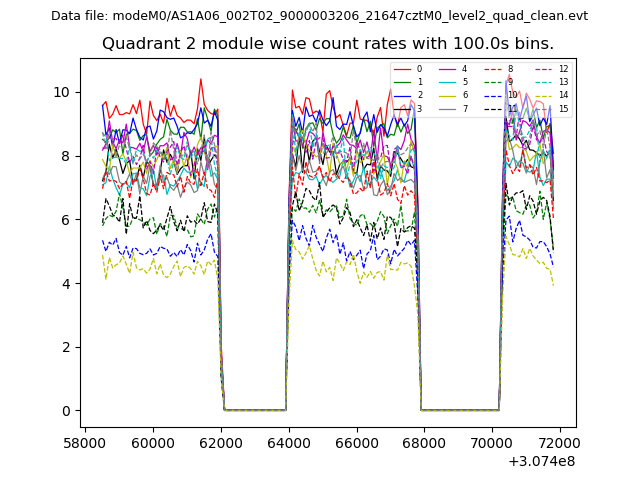
| Module-wise count rates for Quadrant B Data is divided into 100 sec bins |
 |
 |
| Module-wise count rates for Quadrant C Data is divided into 100 sec bins |
 |
 |
| Module-wise count rates for Quadrant D Data is divided into 100 sec bins |
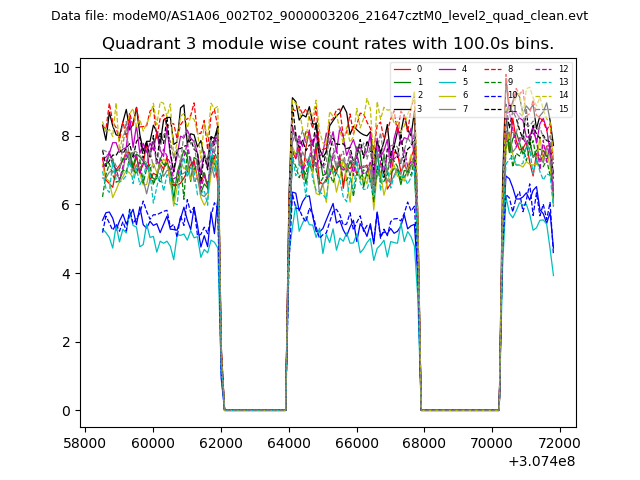 |
 |
| Parameter | Plot |
|---|---|
| CZT HV Monitor | 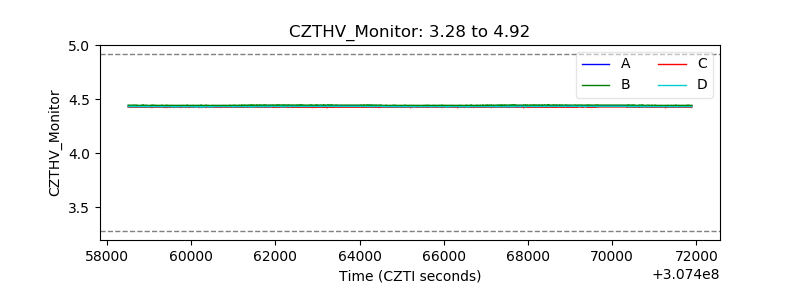 |
| D_VDD | 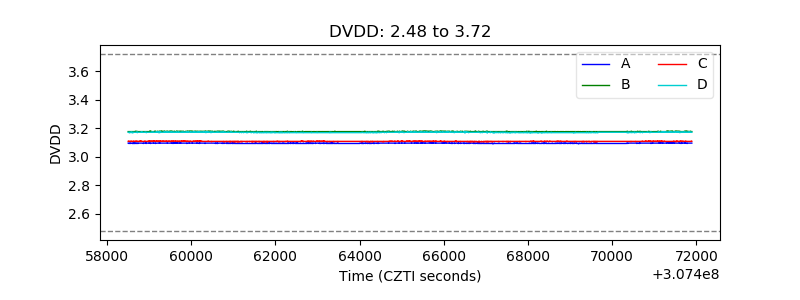 |
| Temperature 1 | 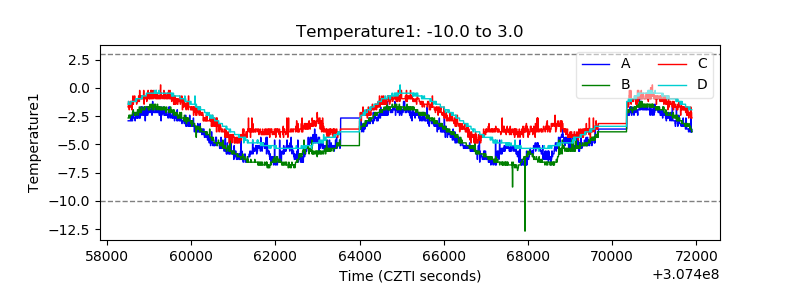 |
| Veto HV Monitor | 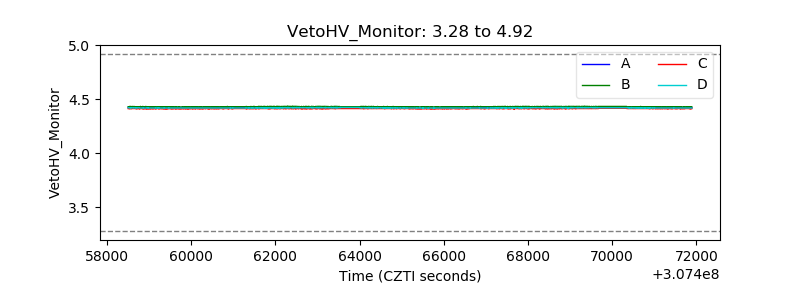 |
| Veto LLD | 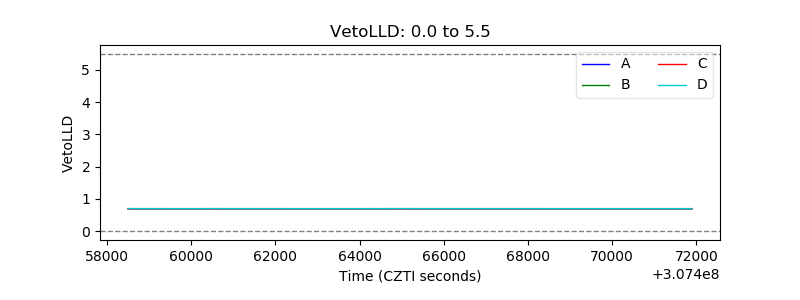 |
| Alpha Counter | 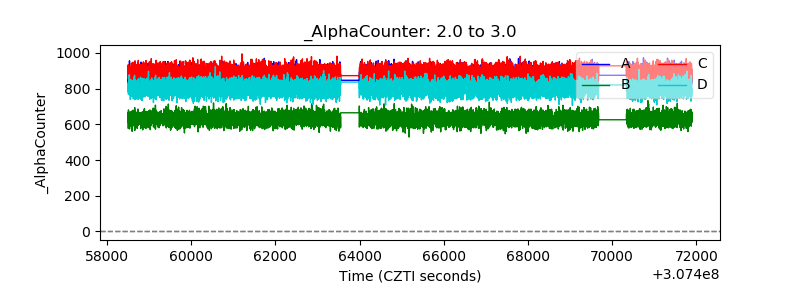 |
| _CPM_Rate | 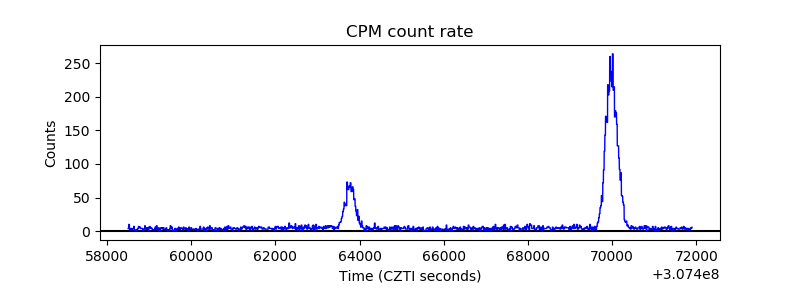 |
| CZT Counter | 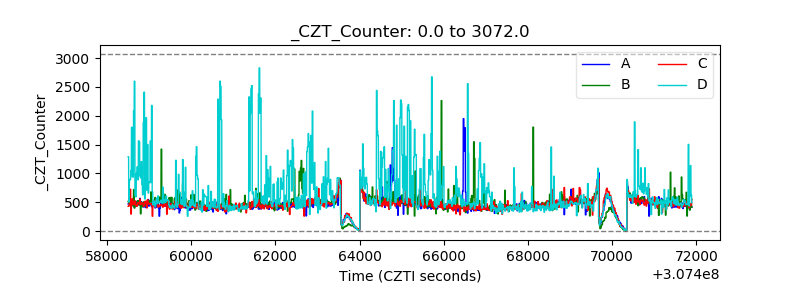 |
| +2.5 Volts monitor |  |
| +5 Volts monitor |  |
| _ROLL_ROT | 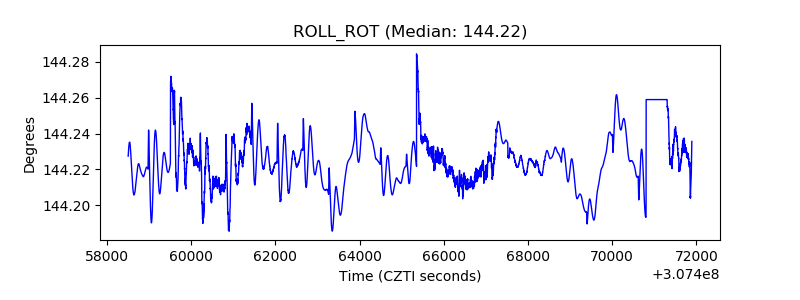 |
| _Roll_DEC | 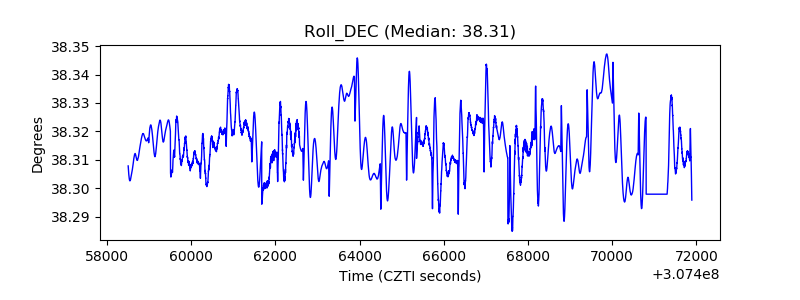 |
| _Roll_RA |  |
| Veto Counter | 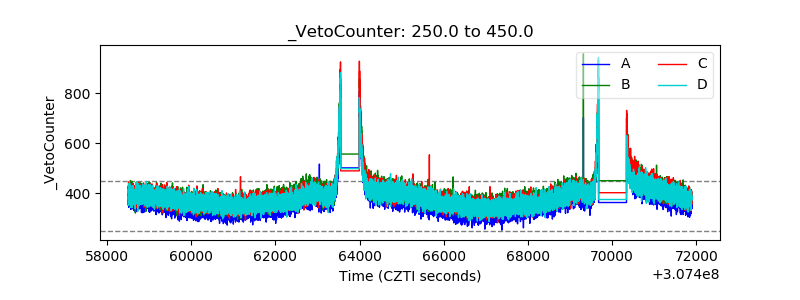 |