| Param | Original file | Final file |
|---|---|---|
| Filename | modeM0/AS1A06_002T02_9000003206_21648cztM0_level2.evt | modeM0/AS1A06_002T02_9000003206_21648cztM0_level2_quad_clean.evt |
| Size (bytes) | 451,123,200 | 90,875,520 |
| Size | 430.2 MB | 86.7 MB |
| Events in quadrant A | 3,032,803 | 580,935 |
| Events in quadrant B | 3,330,185 | 589,851 |
| Events in quadrant C | 3,103,432 | 568,672 |
| Events in quadrant D | 3,745,438 | 550,431 |
| Mode M0 | |||
|---|---|---|---|
| Quadrant | BADHDUFLAG | Total packets | Discarded packets |
| A | 0 | 13476 | 1 |
| B | 0 | 14137 | 1 |
| C | 0 | 13529 | 1 |
| D | 0 | 15472 | 1 |
| Mode M9 | |||
|---|---|---|---|
| Quadrant | BADHDUFLAG | Total packets | Discarded packets |
| A | 0 | 8 | 0 |
| B | 0 | 8 | 0 |
| C | 0 | 8 | 0 |
| D | 0 | 8 | 0 |
| Mode SS | |||
|---|---|---|---|
| Quadrant | BADHDUFLAG | Total packets | Discarded packets |
| A | 0 | 136 | 0 |
| B | 0 | 136 | 0 |
| C | 0 | 136 | 0 |
| D | 0 | 136 | 0 |
| Quadrant | Total seconds | Saturated seconds | Saturation percentage |
|---|---|---|---|
| A | 6621 | 24 | 0.362483% |
| B | 6622 | 54 | 0.815464% |
| C | 6622 | 62 | 0.936273% |
| D | 6622 | 87 | 1.313802% |
Noise dominated data is calculated using 1-second bins in cleaned event files. If a bin has >2000 counts, and if more than 50% of those come from <1% of pixels, then it is considered to be noise-dominated and hence unusable.
| Quadrant | # 1 sec bins | Bins with >0 counts | Bins with >2000 counts | High rate bins dominated by noise | Noise dominated (total time) | Noise dominated (detector-on time) | Marked lightcurve |
|---|---|---|---|---|---|---|---|
| A | 7486 | 6622 | 0 | 0 | 0.00% | 0.00% | 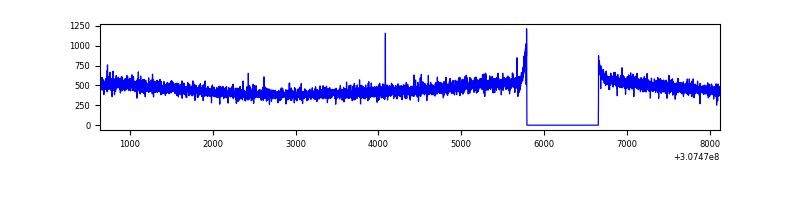 |
| B | 7487 | 6623 | 15 | 15 | 0.20% | 0.23% | 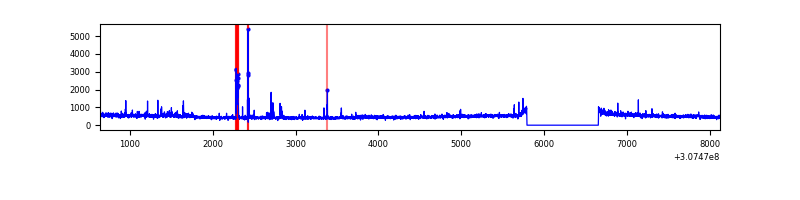 |
| C | 7487 | 6623 | 1 | 1 | 0.01% | 0.02% | 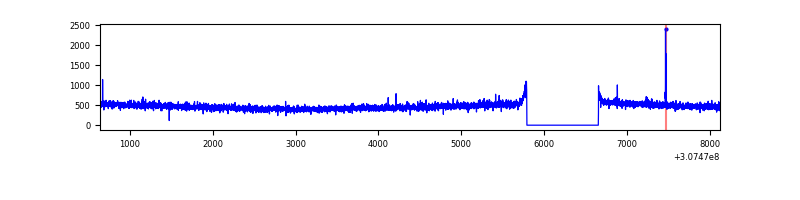 |
| D | 7487 | 6623 | 48 | 48 | 0.64% | 0.72% | 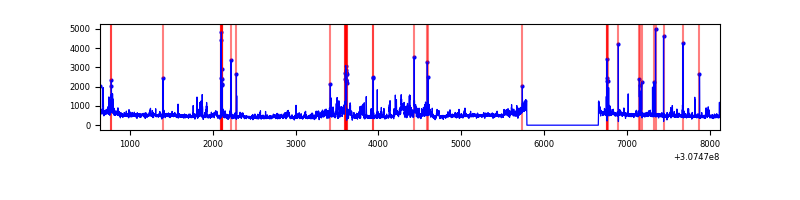 |
Top three noisy pixels from each quadrant. If the there are fewer than three noisy pixels in the level2.evt file, extra rows are filled as -1
| Pixel properties | Quadrant properties | ||||||
|---|---|---|---|---|---|---|---|
| Quadrant | DetID | PixID | Counts | Sigma | Mean | Median | Sigma |
| A | 13 | 254 | 9020 | 51.97 | 786 | 768 | 158.8 |
| A | 0 | 226 | 6859 | 38.36 | 786 | 768 | 158.8 |
| A | 3 | 137 | 6685 | 37.26 | 786 | 768 | 158.8 |
| B | 3 | 64 | 96123 | 630.8 | 786 | 765 | 151.2 |
| B | 0 | 229 | 54849 | 357.77 | 786 | 765 | 151.2 |
| B | 0 | 245 | 24724 | 158.49 | 786 | 765 | 151.2 |
| C | 14 | 238 | 119280 | 659.32 | 762 | 765 | 179.8 |
| C | 0 | 207 | 9029 | 45.97 | 762 | 765 | 179.8 |
| C | 10 | 22 | 7334 | 36.54 | 762 | 765 | 179.8 |
| D | 7 | 238 | 414665 | 2227.04 | 765 | 743 | 185.9 |
| D | 9 | 68 | 86926 | 463.69 | 765 | 743 | 185.9 |
| D | 13 | 104 | 74345 | 396.0 | 765 | 743 | 185.9 |
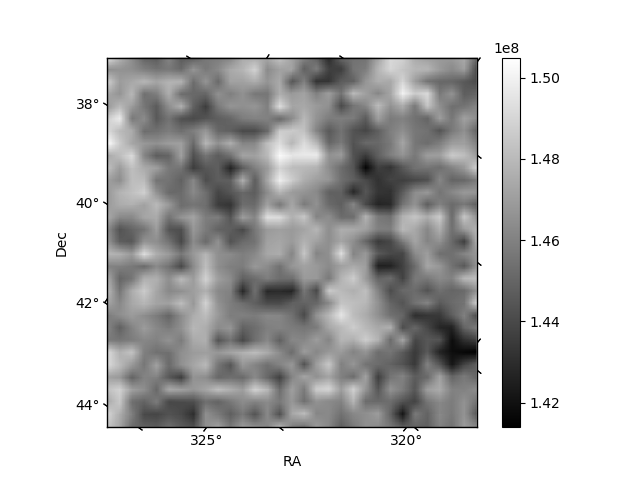
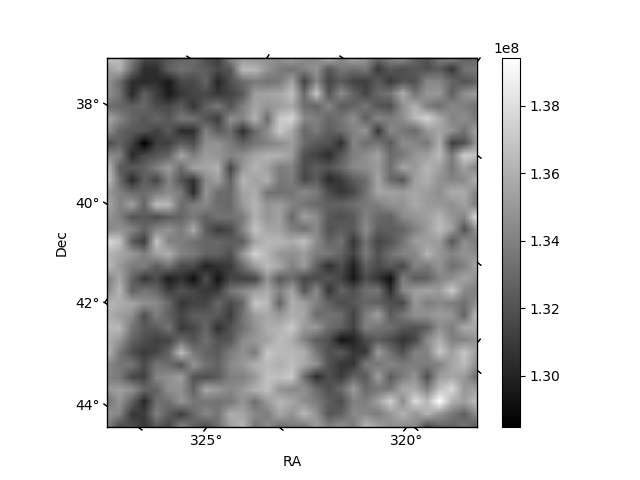
Histogram calculated using DETX and DETY for each event in the final _common_clean file
| Quadrant A | 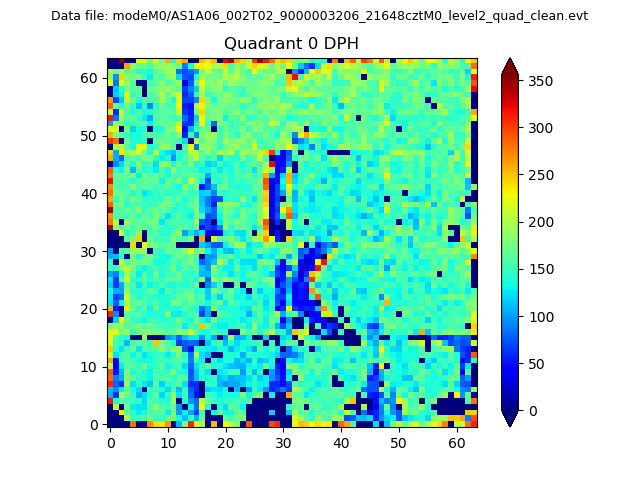 |
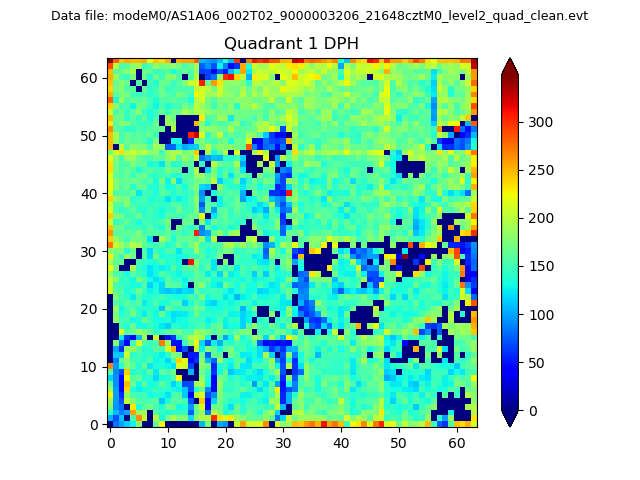 |
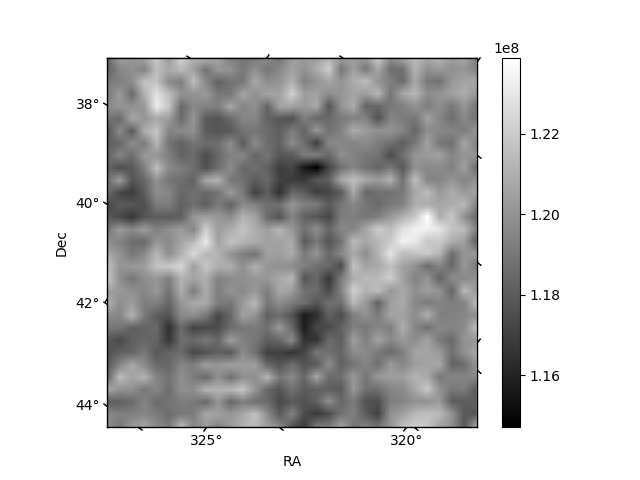
Quadrant B |
|---|---|---|---|
| Quadrant D | 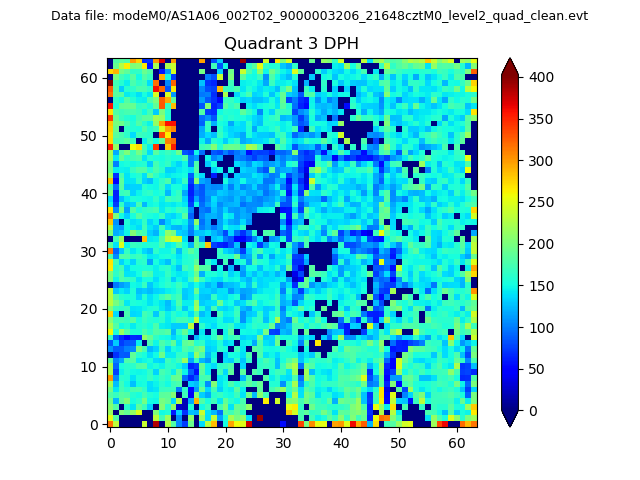 |
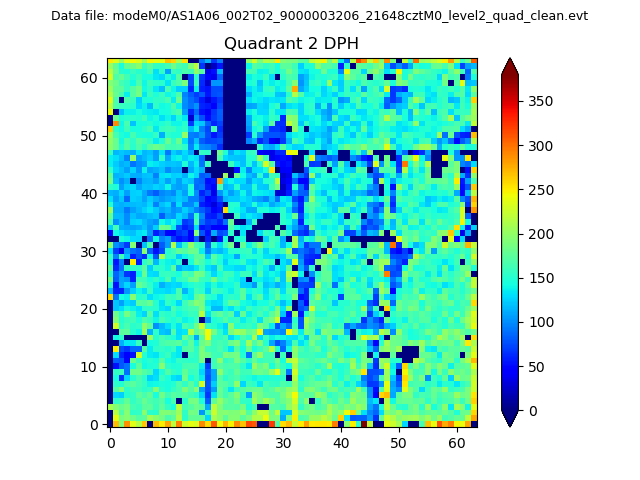 |
Quadrant C |
| Plot type | Count rate plots | Images |
|---|---|---|
| Comparison with Poisson distribution Blue bars denote a histogram of data divided into 1 sec bins. Red curve is a Poisson curve with rate = median count rate of data. |
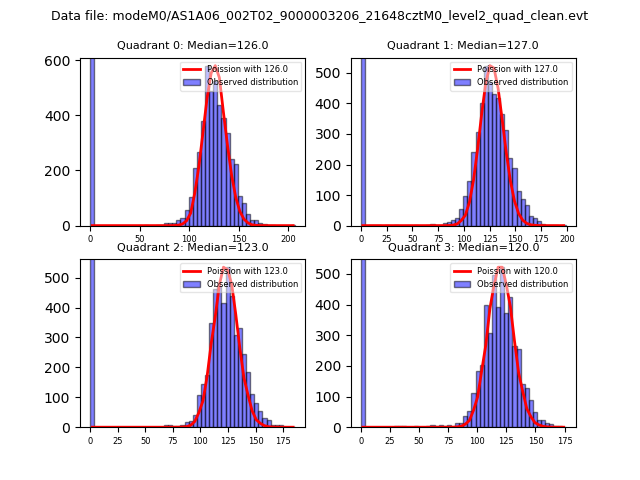 |
 |
| Quadrant-wise count rates Data is divided into 100 sec bins |
 |
|
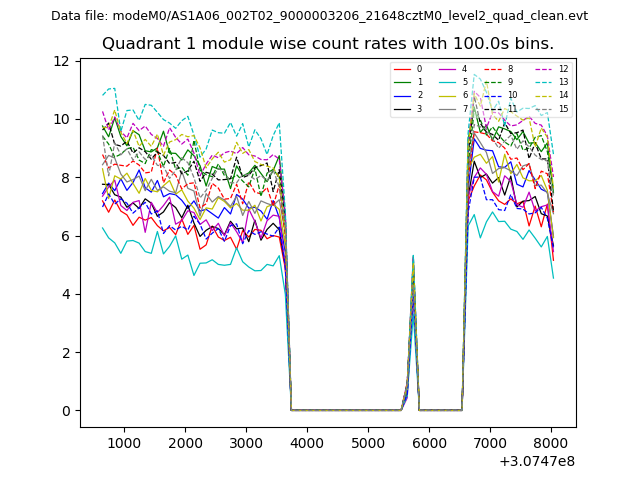
| Module-wise count rates for Quadrant A Data is divided into 100 sec bins |
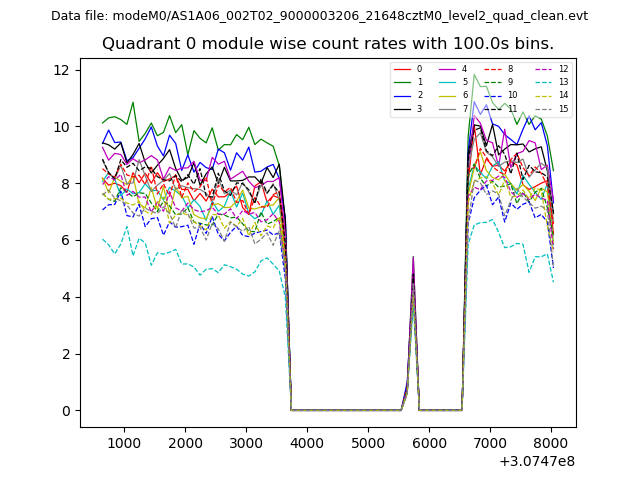 |
 |
| Module-wise count rates for Quadrant B Data is divided into 100 sec bins |
 |
 |
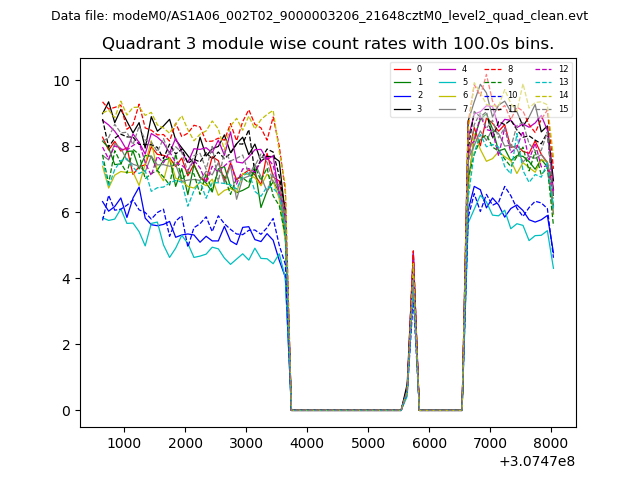
| Module-wise count rates for Quadrant C Data is divided into 100 sec bins |
 |
 |
| Module-wise count rates for Quadrant D Data is divided into 100 sec bins |
 |
 |
| Parameter | Plot |
|---|---|
| CZT HV Monitor |  |
| D_VDD | 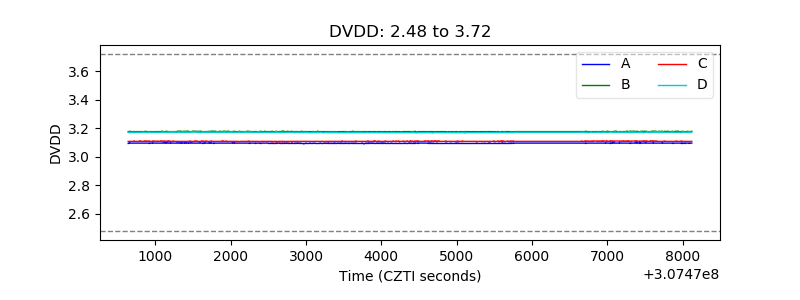 |
| Temperature 1 | 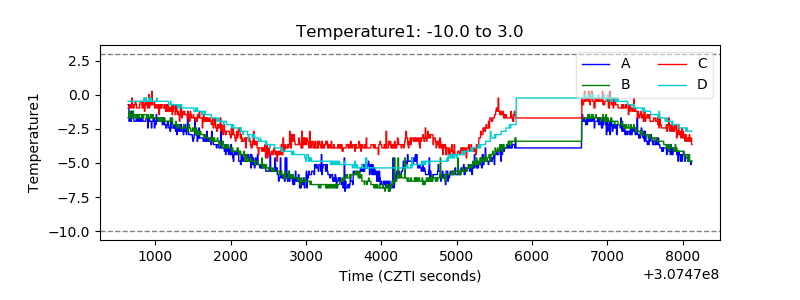 |
| Veto HV Monitor | 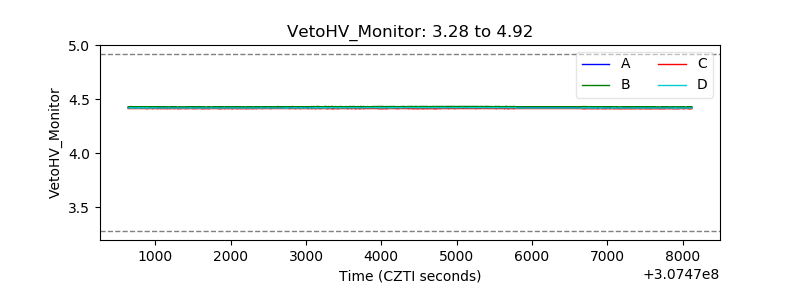 |
| Veto LLD | 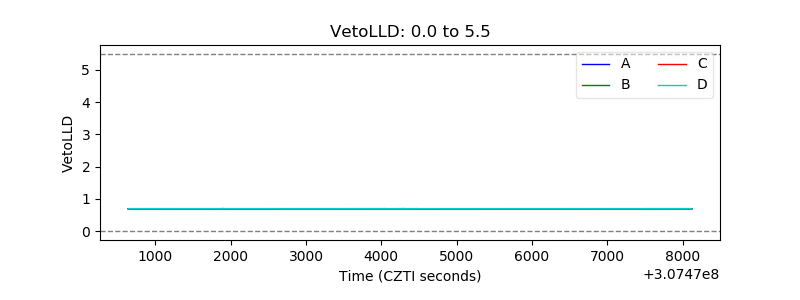 |
| Alpha Counter |  |
| _CPM_Rate | 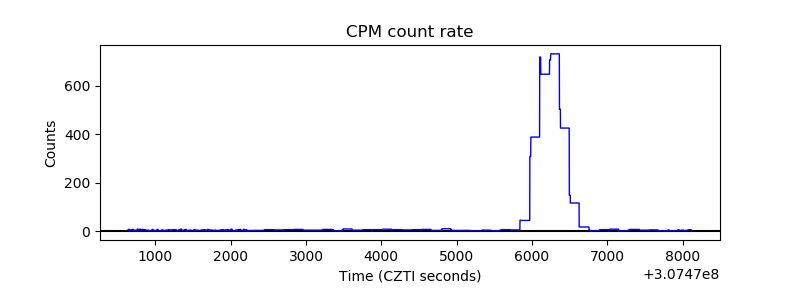 |
| CZT Counter | 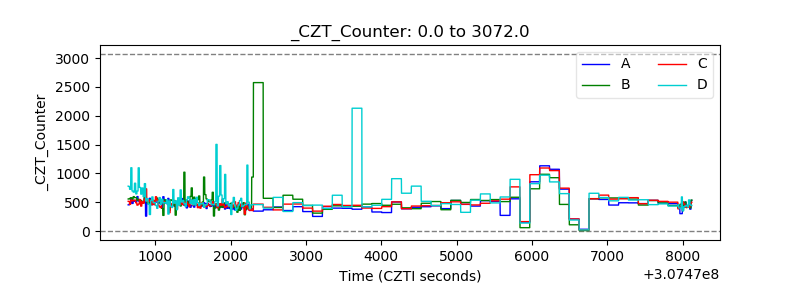 |
| +2.5 Volts monitor |  |
| +5 Volts monitor |  |
| _ROLL_ROT | 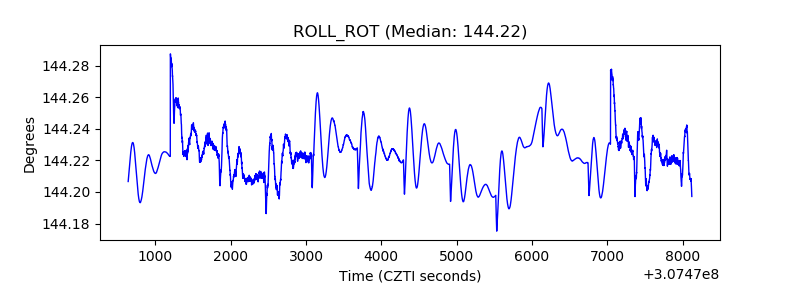 |
| _Roll_DEC | 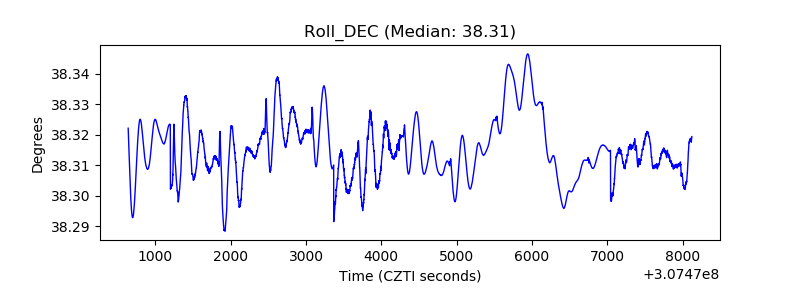 |
| _Roll_RA | 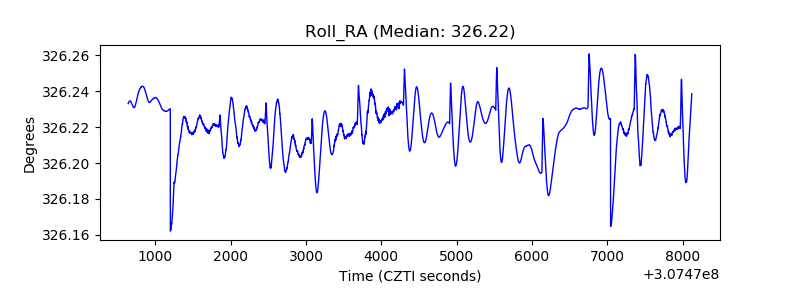 |
| Veto Counter | 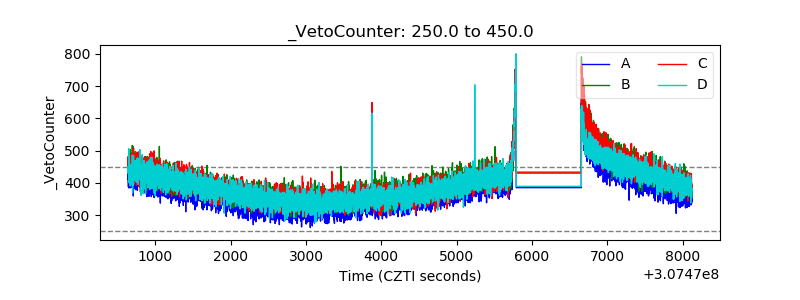 |