| Param | Original file | Final file |
|---|---|---|
| Filename | modeM0/AS1A06_002T02_9000003206_21651cztM0_level2.evt | modeM0/AS1A06_002T02_9000003206_21651cztM0_level2_quad_clean.evt |
| Size (bytes) | 456,212,160 | 94,826,880 |
| Size | 435.1 MB | 90.4 MB |
| Events in quadrant A | 3,016,626 | 612,939 |
| Events in quadrant B | 3,426,274 | 632,592 |
| Events in quadrant C | 3,105,819 | 604,053 |
| Events in quadrant D | 3,832,058 | 574,728 |
| Mode M0 | |||
|---|---|---|---|
| Quadrant | BADHDUFLAG | Total packets | Discarded packets |
| A | 0 | 13236 | 2 |
| B | 0 | 14373 | 2 |
| C | 0 | 13391 | 2 |
| D | 0 | 15748 | 2 |
| Mode M9 | |||
|---|---|---|---|
| Quadrant | BADHDUFLAG | Total packets | Discarded packets |
| A | 0 | 18 | 0 |
| B | 0 | 19 | 0 |
| C | 0 | 19 | 0 |
| D | 0 | 19 | 0 |
| Mode SS | |||
|---|---|---|---|
| Quadrant | BADHDUFLAG | Total packets | Discarded packets |
| A | 0 | 130 | 0 |
| B | 0 | 130 | 0 |
| C | 0 | 130 | 0 |
| D | 0 | 130 | 0 |
| Quadrant | Total seconds | Saturated seconds | Saturation percentage |
|---|---|---|---|
| A | 6414 | 20 | 0.311818% |
| B | 6414 | 50 | 0.779545% |
| C | 6414 | 50 | 0.779545% |
| D | 6414 | 87 | 1.356408% |
Noise dominated data is calculated using 1-second bins in cleaned event files. If a bin has >2000 counts, and if more than 50% of those come from <1% of pixels, then it is considered to be noise-dominated and hence unusable.
| Quadrant | # 1 sec bins | Bins with >0 counts | Bins with >2000 counts | High rate bins dominated by noise | Noise dominated (total time) | Noise dominated (detector-on time) | Marked lightcurve |
|---|---|---|---|---|---|---|---|
| A | 7589 | 6415 | 0 | 0 | 0.00% | 0.00% | 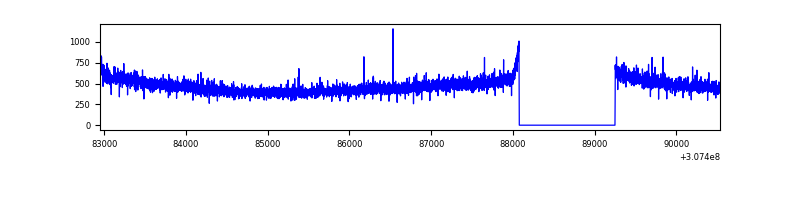 |
| B | 7589 | 6415 | 16 | 16 | 0.21% | 0.25% | 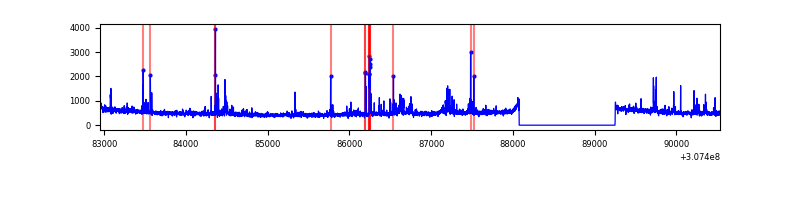 |
| C | 7589 | 6415 | 0 | 0 | 0.00% | 0.00% | 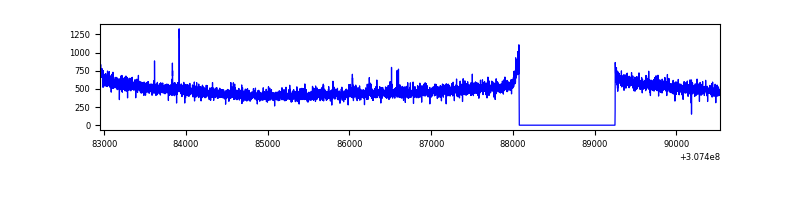 |
| D | 7589 | 6415 | 44 | 44 | 0.58% | 0.69% | 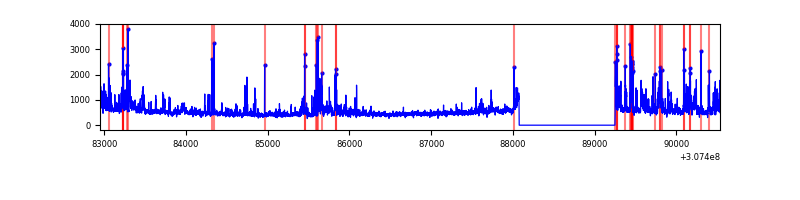 |
Top three noisy pixels from each quadrant. If the there are fewer than three noisy pixels in the level2.evt file, extra rows are filled as -1
| Pixel properties | Quadrant properties | ||||||
|---|---|---|---|---|---|---|---|
| Quadrant | DetID | PixID | Counts | Sigma | Mean | Median | Sigma |
| A | 13 | 254 | 8383 | 48.59 | 782 | 768 | 156.7 |
| A | 0 | 226 | 6678 | 37.71 | 782 | 768 | 156.7 |
| A | 3 | 137 | 6396 | 35.91 | 782 | 768 | 156.7 |
| B | 3 | 64 | 185224 | 1246.8 | 787 | 767 | 147.9 |
| B | 0 | 230 | 32442 | 214.1 | 787 | 767 | 147.9 |
| B | 0 | 197 | 31238 | 205.96 | 787 | 767 | 147.9 |
| C | 14 | 238 | 118745 | 661.74 | 761 | 764 | 178.3 |
| C | 10 | 22 | 12373 | 65.11 | 761 | 764 | 178.3 |
| C | 9 | 54 | 6367 | 31.43 | 761 | 764 | 178.3 |
| D | 7 | 238 | 612719 | 3331.57 | 759 | 738 | 183.7 |
| D | 2 | 136 | 98860 | 534.17 | 759 | 738 | 183.7 |
| D | 13 | 153 | 79875 | 430.81 | 759 | 738 | 183.7 |
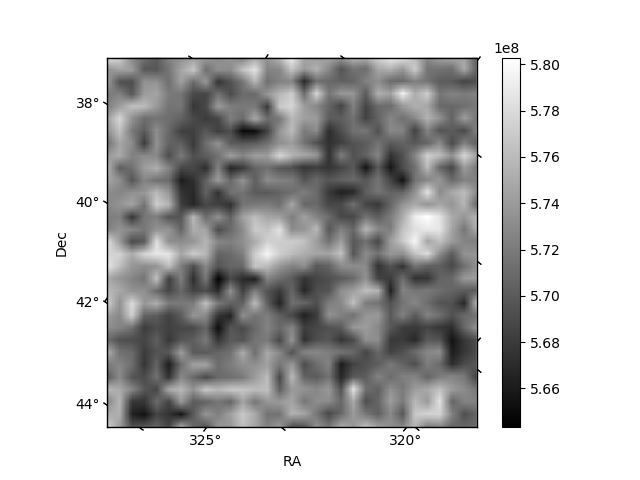
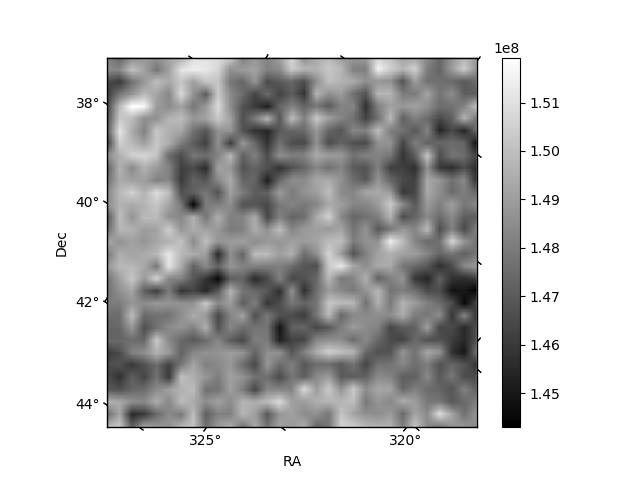
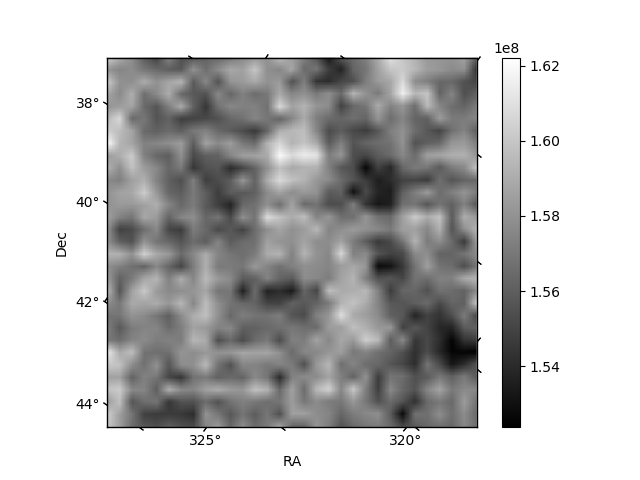
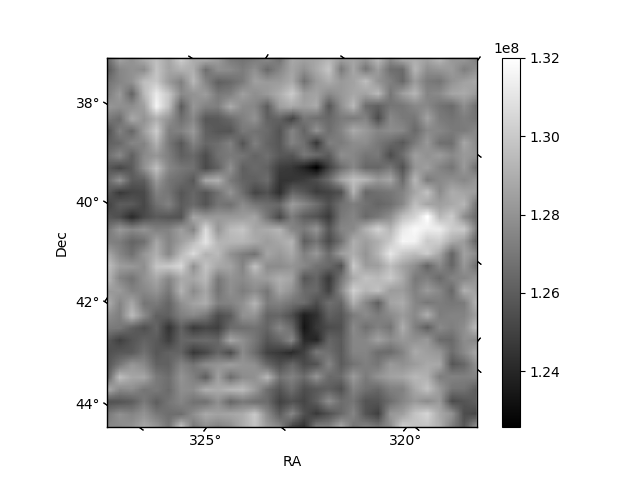
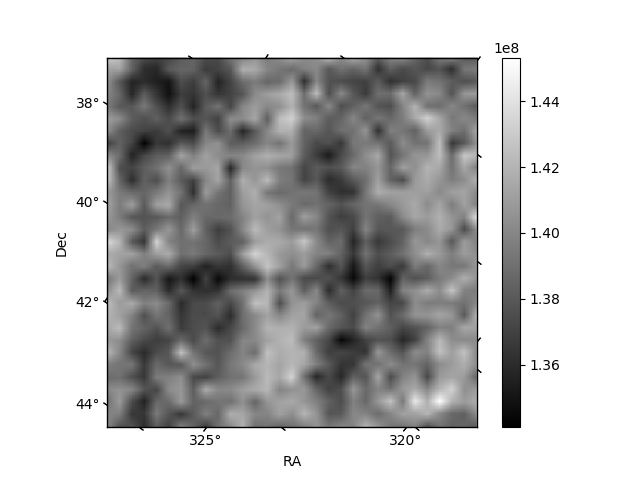
Histogram calculated using DETX and DETY for each event in the final _common_clean file
| Quadrant A | 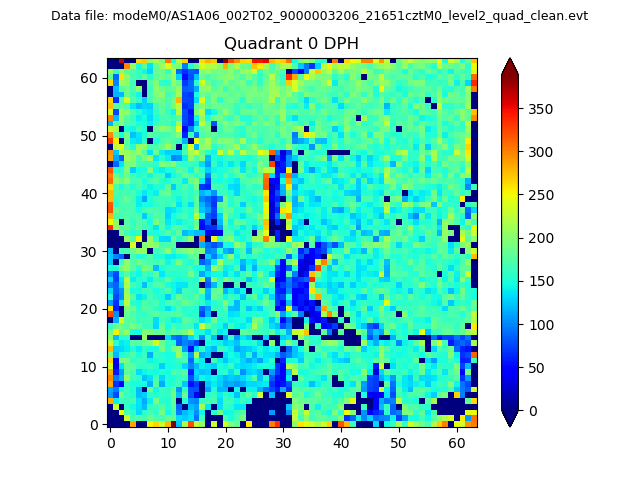 |
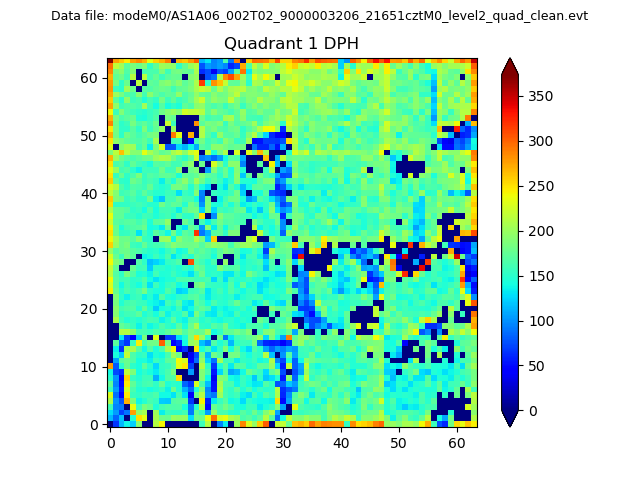 |
Quadrant B |
|---|---|---|---|
| Quadrant D |  |
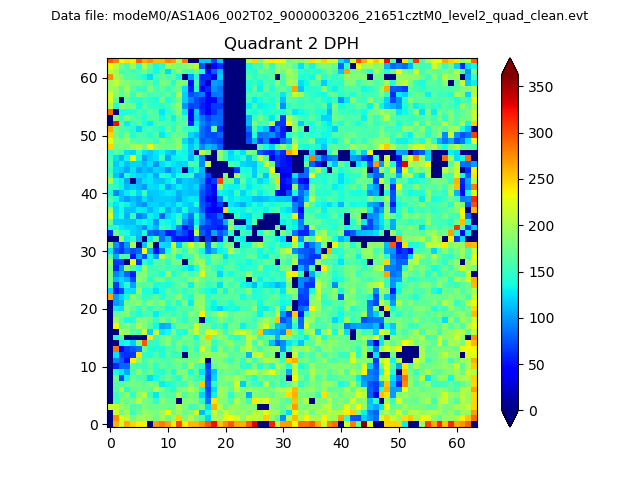 |
Quadrant C |
| Plot type | Count rate plots | Images |
|---|---|---|
| Comparison with Poisson distribution Blue bars denote a histogram of data divided into 1 sec bins. Red curve is a Poisson curve with rate = median count rate of data. |
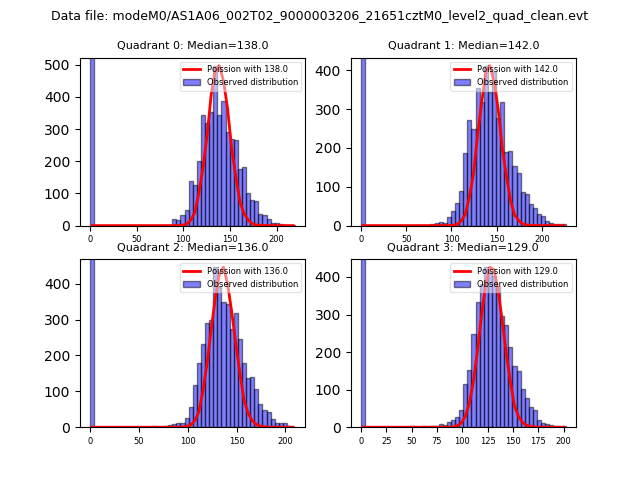 |
 |
| Quadrant-wise count rates Data is divided into 100 sec bins |
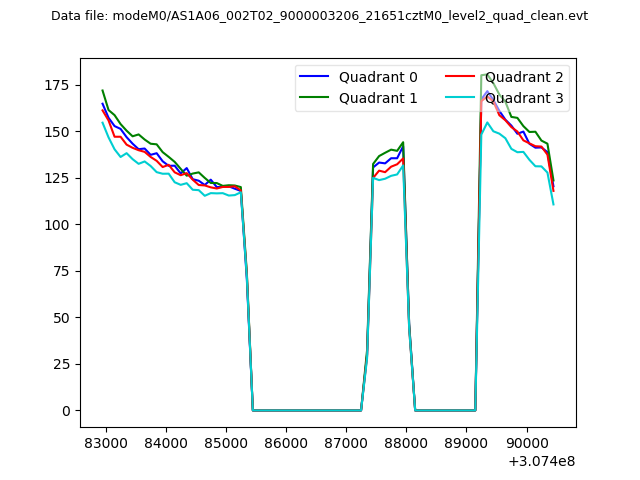 |
|
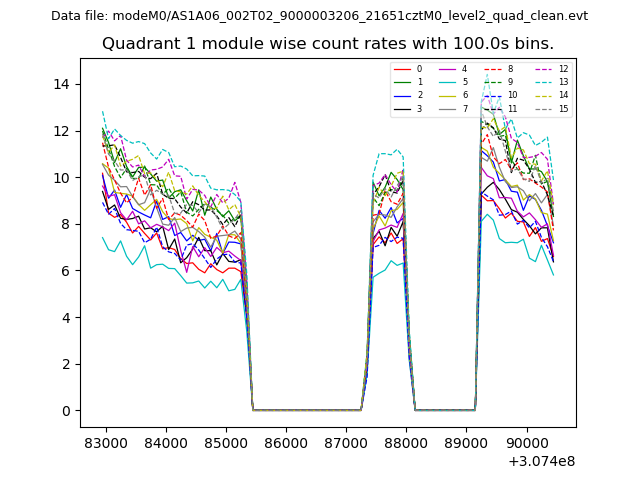
| Module-wise count rates for Quadrant A Data is divided into 100 sec bins |
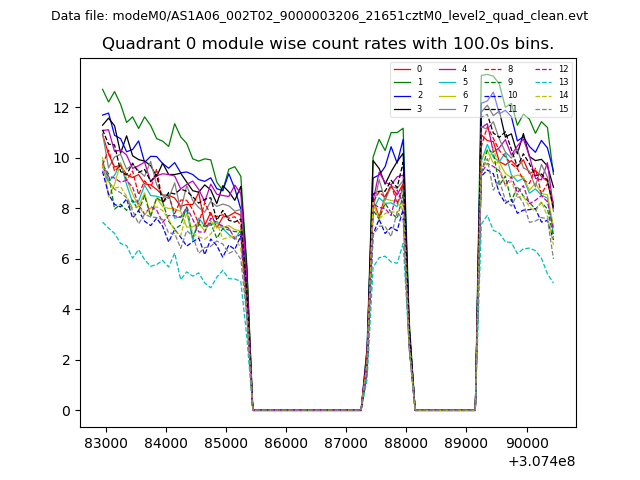 |
 |
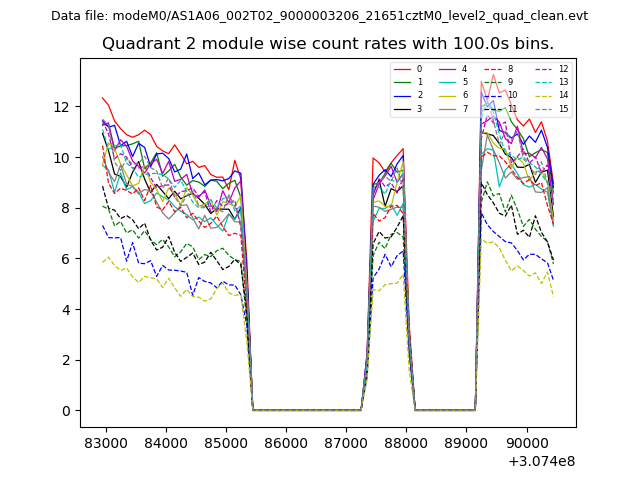
| Module-wise count rates for Quadrant B Data is divided into 100 sec bins |
 |
 |
| Module-wise count rates for Quadrant C Data is divided into 100 sec bins |
 |
 |
| Module-wise count rates for Quadrant D Data is divided into 100 sec bins |
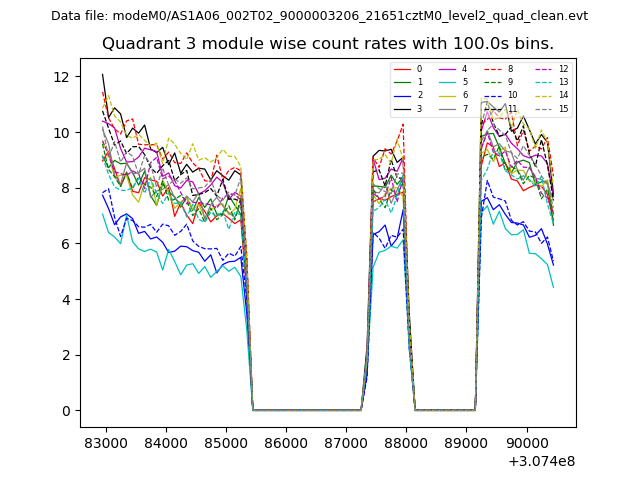 |
 |
| Parameter | Plot |
|---|---|
| CZT HV Monitor | 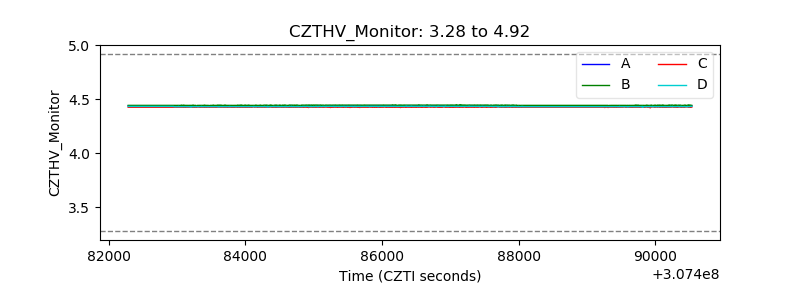 |
| D_VDD | 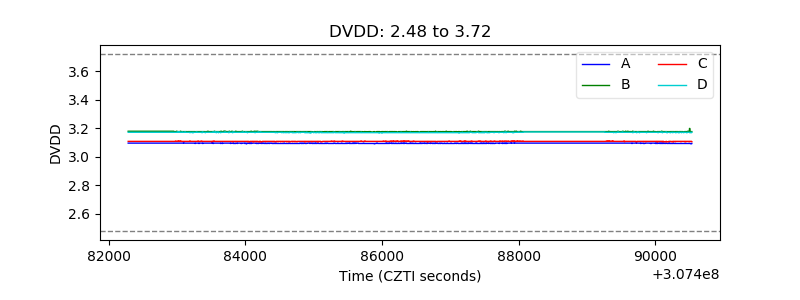 |
| Temperature 1 | 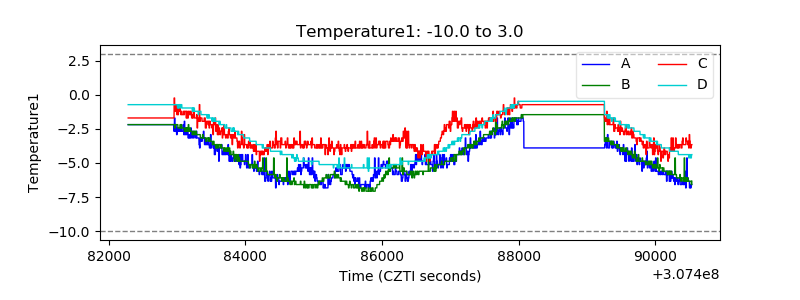 |
| Veto HV Monitor |  |
| Veto LLD | 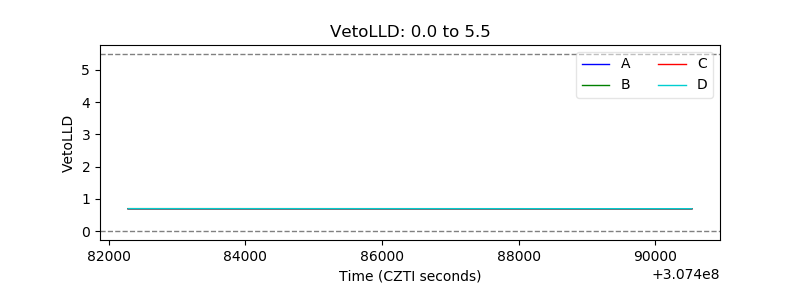 |
| Alpha Counter | 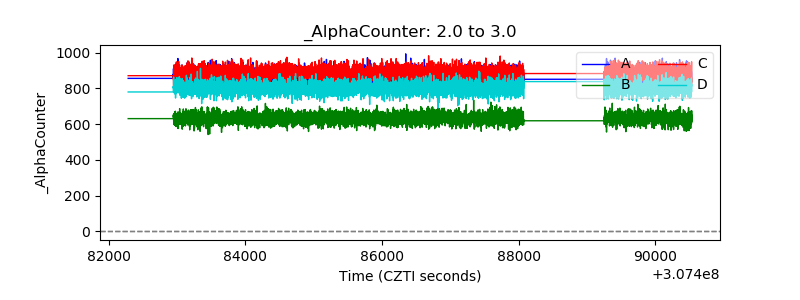 |
| _CPM_Rate | 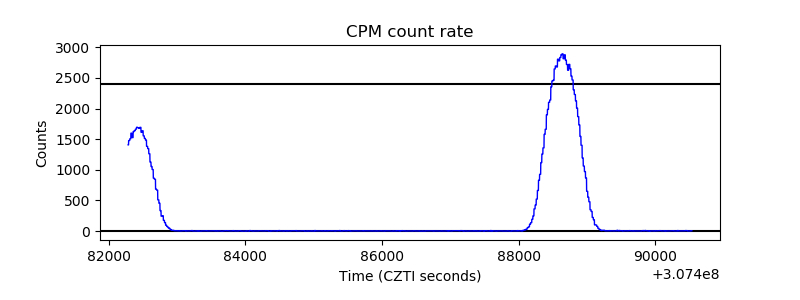 |
| CZT Counter | 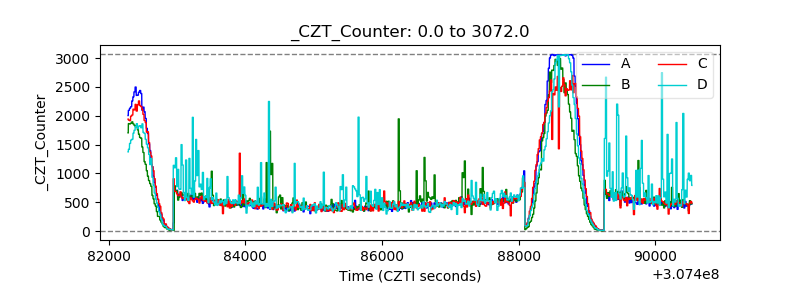 |
| +2.5 Volts monitor |  |
| +5 Volts monitor |  |
| _ROLL_ROT | 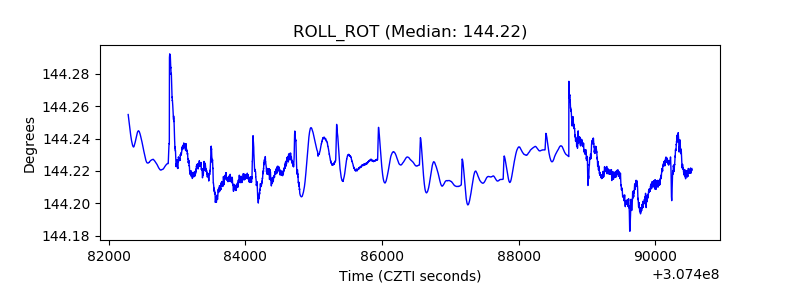 |
| _Roll_DEC | 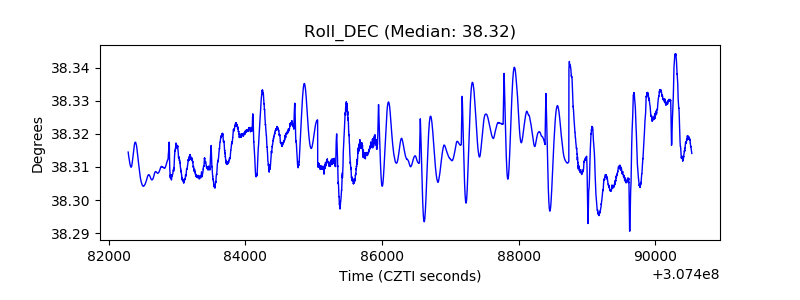 |
| _Roll_RA | 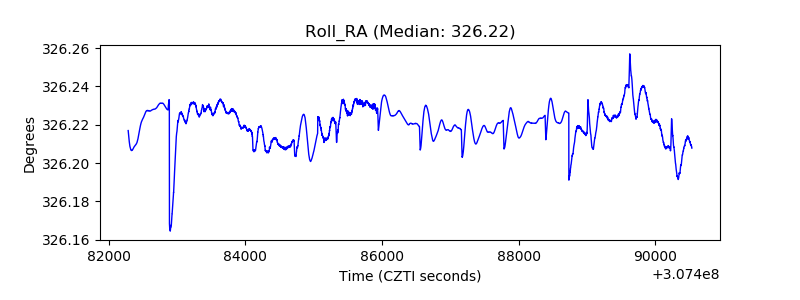 |
| Veto Counter | 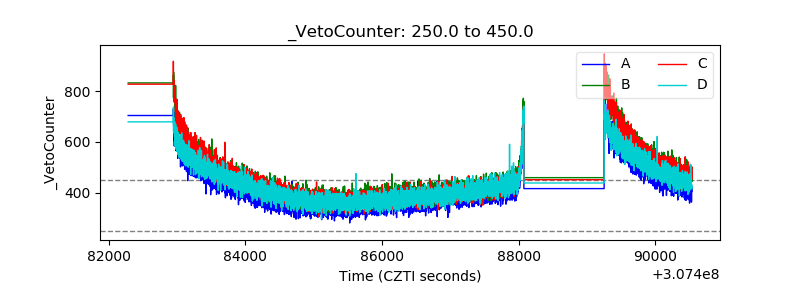 |