| Param | Original file | Final file |
|---|---|---|
| Filename | modeM0/AS1A06_002T02_9000003206_21652cztM0_level2.evt | modeM0/AS1A06_002T02_9000003206_21652cztM0_level2_quad_clean.evt |
| Size (bytes) | 502,413,120 | 95,895,360 |
| Size | 479.1 MB | 91.5 MB |
| Events in quadrant A | 3,021,984 | 627,663 |
| Events in quadrant B | 3,332,451 | 652,608 |
| Events in quadrant C | 3,116,678 | 615,832 |
| Events in quadrant D | 5,321,259 | 572,707 |
| Mode M0 | |||
|---|---|---|---|
| Quadrant | BADHDUFLAG | Total packets | Discarded packets |
| A | 0 | 12989 | 2 |
| B | 0 | 13910 | 2 |
| C | 0 | 13203 | 2 |
| D | 0 | 20004 | 2 |
| Mode M9 | |||
|---|---|---|---|
| Quadrant | BADHDUFLAG | Total packets | Discarded packets |
| A | 0 | 19 | 0 |
| B | 0 | 20 | 0 |
| C | 0 | 20 | 0 |
| D | 0 | 20 | 0 |
| Mode SS | |||
|---|---|---|---|
| Quadrant | BADHDUFLAG | Total packets | Discarded packets |
| A | 0 | 126 | 0 |
| B | 0 | 126 | 0 |
| C | 0 | 126 | 0 |
| D | 0 | 126 | 0 |
| Quadrant | Total seconds | Saturated seconds | Saturation percentage |
|---|---|---|---|
| A | 6242 | 23 | 0.368472% |
| B | 6242 | 67 | 1.073374% |
| C | 6242 | 75 | 1.201538% |
| D | 6241 | 598 | 9.581798% |
Noise dominated data is calculated using 1-second bins in cleaned event files. If a bin has >2000 counts, and if more than 50% of those come from <1% of pixels, then it is considered to be noise-dominated and hence unusable.
| Quadrant | # 1 sec bins | Bins with >0 counts | Bins with >2000 counts | High rate bins dominated by noise | Noise dominated (total time) | Noise dominated (detector-on time) | Marked lightcurve |
|---|---|---|---|---|---|---|---|
| A | 7492 | 6243 | 0 | 0 | 0.00% | 0.00% | 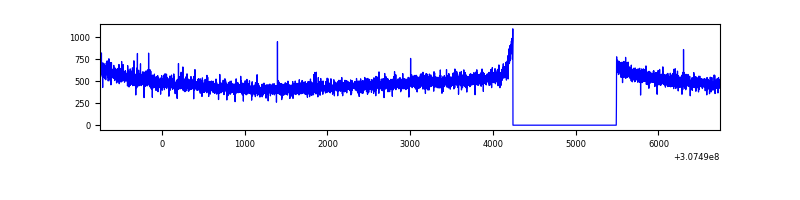 |
| B | 7492 | 6243 | 28 | 28 | 0.37% | 0.45% | 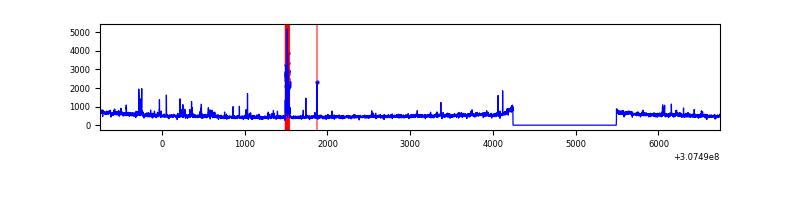 |
| C | 7492 | 6243 | 0 | 0 | 0.00% | 0.00% | 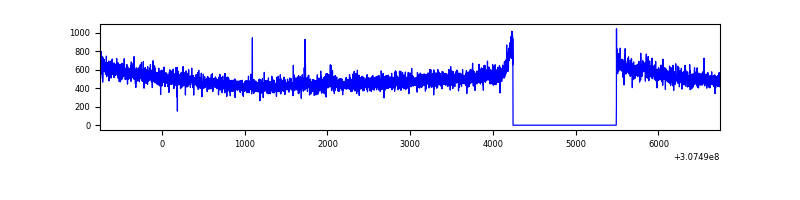 |
| D | 7491 | 6242 | 468 | 468 | 6.25% | 7.50% | 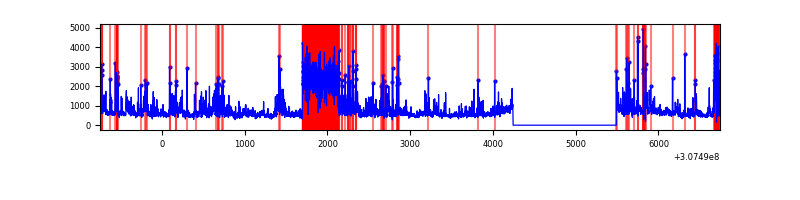 |
Top three noisy pixels from each quadrant. If the there are fewer than three noisy pixels in the level2.evt file, extra rows are filled as -1
| Pixel properties | Quadrant properties | ||||||
|---|---|---|---|---|---|---|---|
| Quadrant | DetID | PixID | Counts | Sigma | Mean | Median | Sigma |
| A | 13 | 254 | 7954 | 46.33 | 784 | 768 | 155.1 |
| A | 0 | 226 | 6713 | 38.33 | 784 | 768 | 155.1 |
| A | 3 | 137 | 6403 | 36.33 | 784 | 768 | 155.1 |
| B | 3 | 64 | 146200 | 989.88 | 789 | 769 | 146.9 |
| B | 0 | 230 | 29246 | 193.83 | 789 | 769 | 146.9 |
| B | 0 | 219 | 17832 | 116.14 | 789 | 769 | 146.9 |
| C | 14 | 238 | 121337 | 680.09 | 763 | 769 | 177.3 |
| C | 9 | 54 | 13165 | 69.92 | 763 | 769 | 177.3 |
| C | 10 | 22 | 6782 | 33.92 | 763 | 769 | 177.3 |
| D | 1 | 52 | 1692381 | 9597.08 | 728 | 707 | 176.3 |
| D | 7 | 238 | 650793 | 3688.02 | 728 | 707 | 176.3 |
| D | 9 | 68 | 108774 | 613.08 | 728 | 707 | 176.3 |
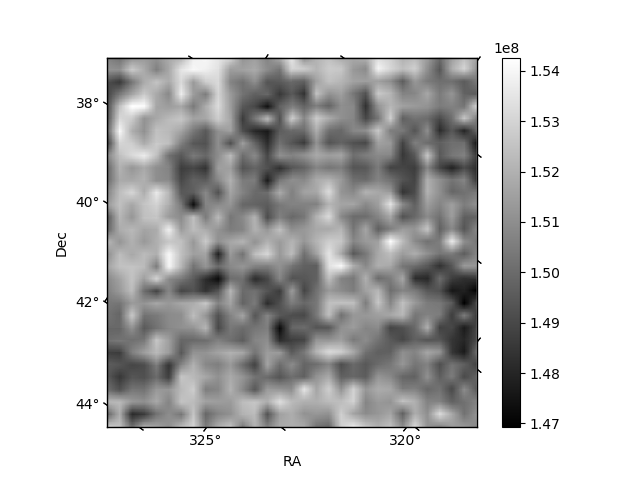
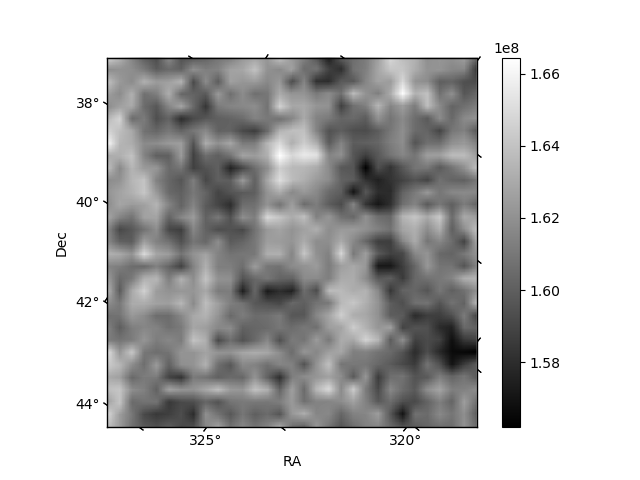
Histogram calculated using DETX and DETY for each event in the final _common_clean file
| Quadrant A | 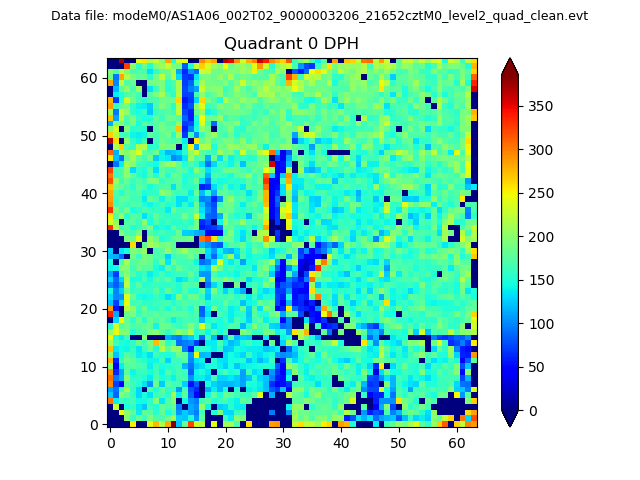 |
 |
Quadrant B |
|---|---|---|---|
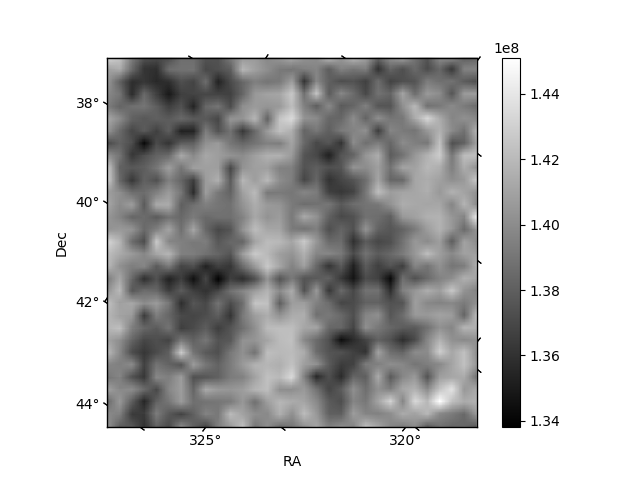
| Quadrant D | 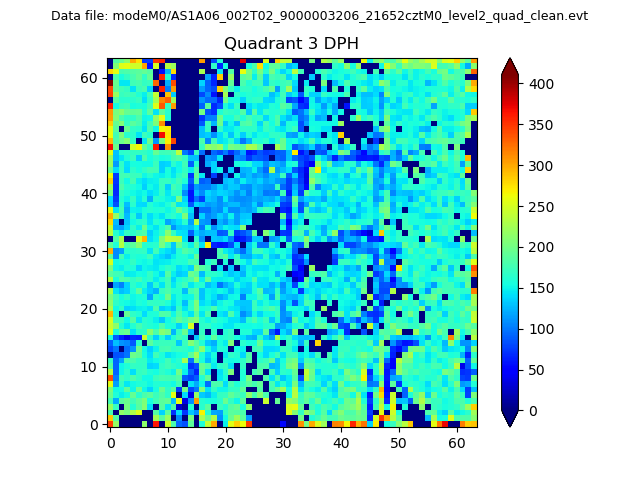 |
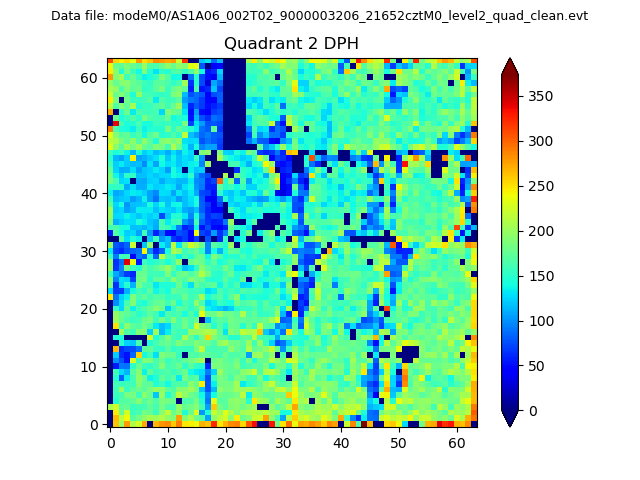 |
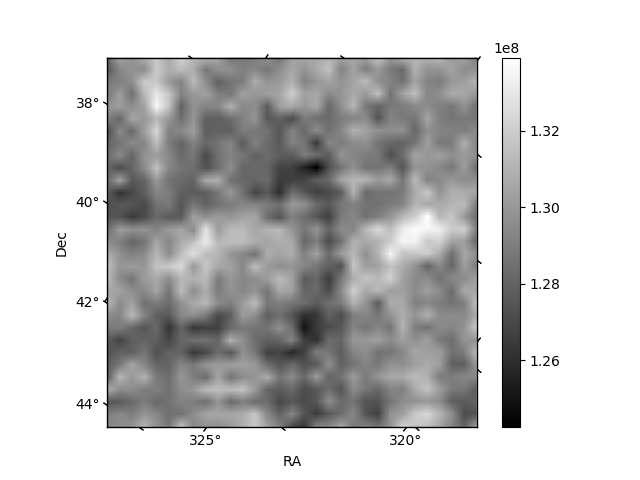
Quadrant C |
| Plot type | Count rate plots | Images |
|---|---|---|
| Comparison with Poisson distribution Blue bars denote a histogram of data divided into 1 sec bins. Red curve is a Poisson curve with rate = median count rate of data. |
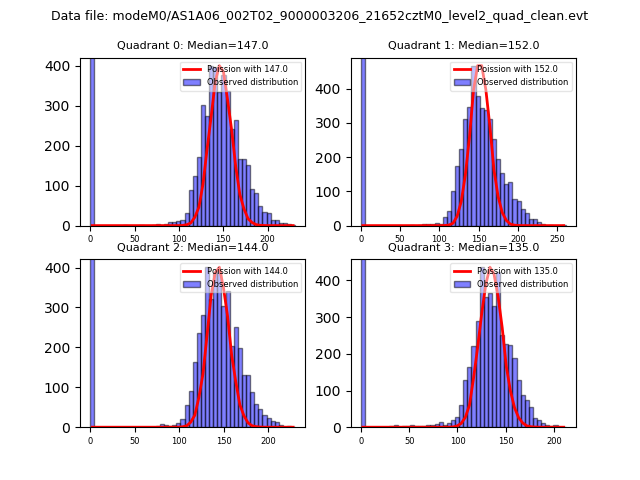 |
 |
| Quadrant-wise count rates Data is divided into 100 sec bins |
 |
|
| Module-wise count rates for Quadrant A Data is divided into 100 sec bins |
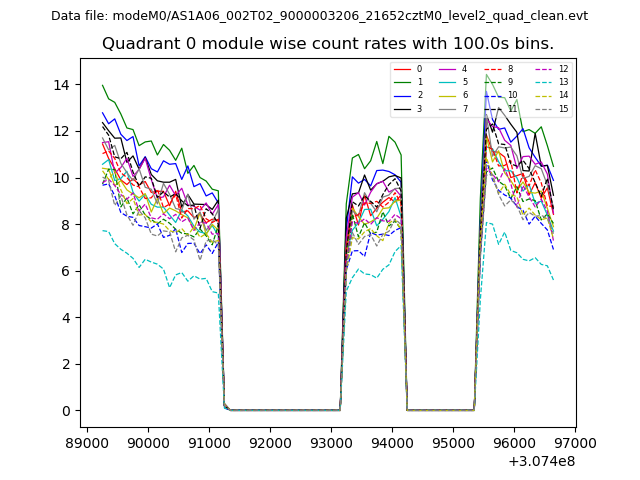 |
 |
| Module-wise count rates for Quadrant B Data is divided into 100 sec bins |
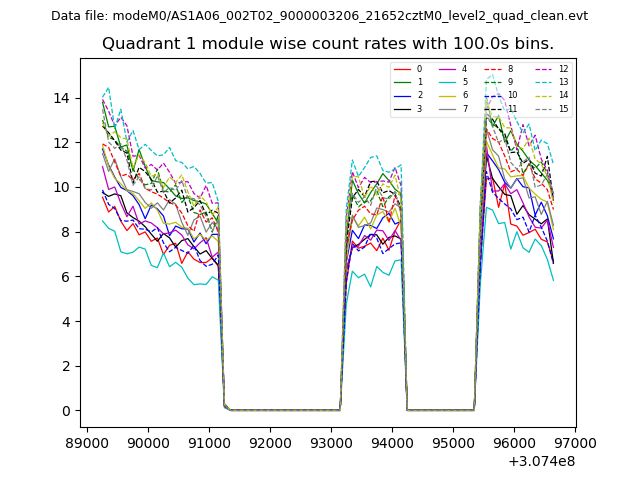 |
 |
| Module-wise count rates for Quadrant C Data is divided into 100 sec bins |
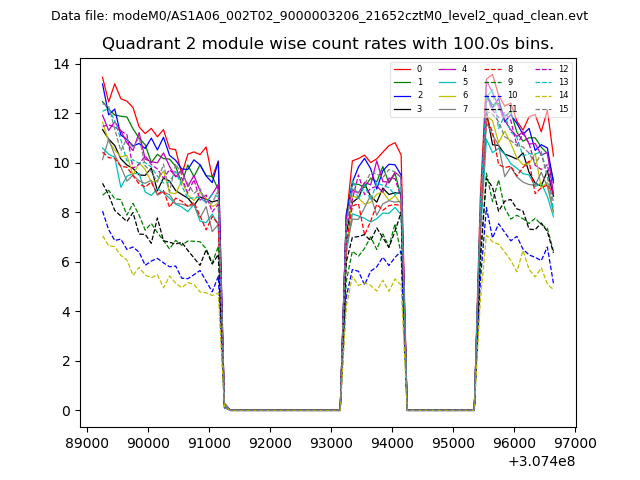 |
 |
| Module-wise count rates for Quadrant D Data is divided into 100 sec bins |
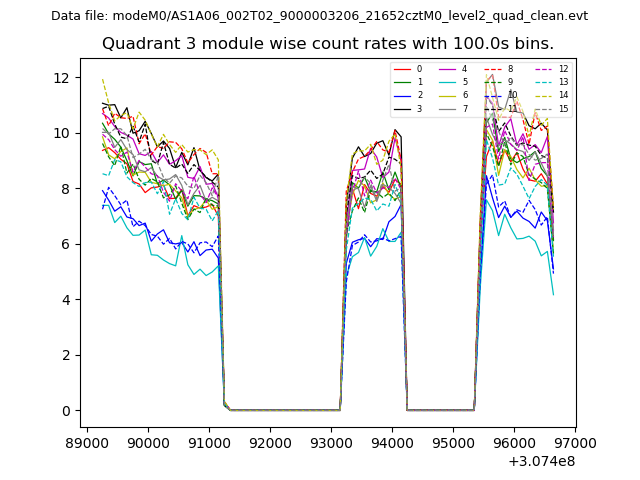 |
 |
| Parameter | Plot |
|---|---|
| CZT HV Monitor | 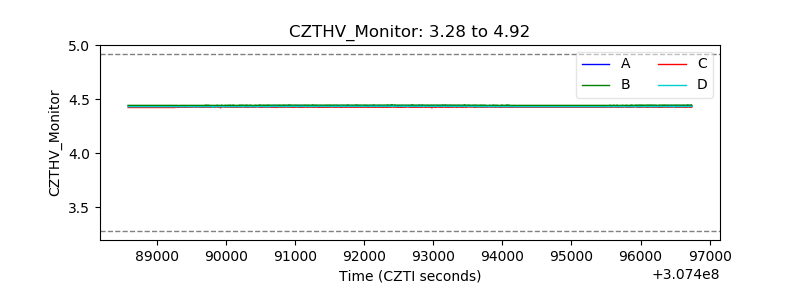 |
| D_VDD | 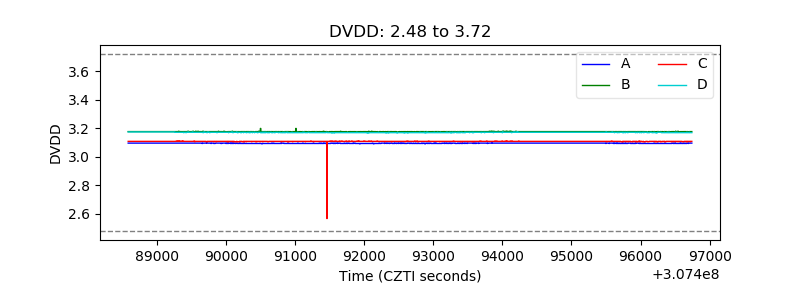 |
| Temperature 1 | 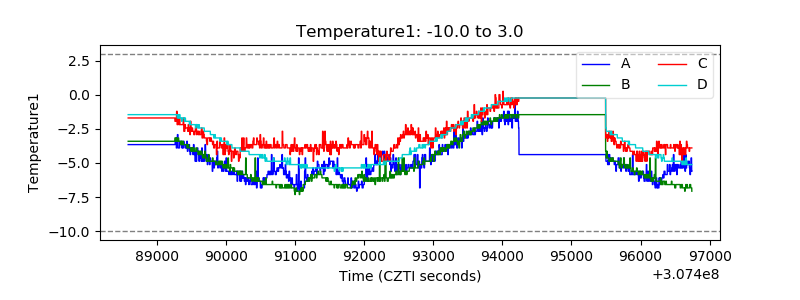 |
| Veto HV Monitor | 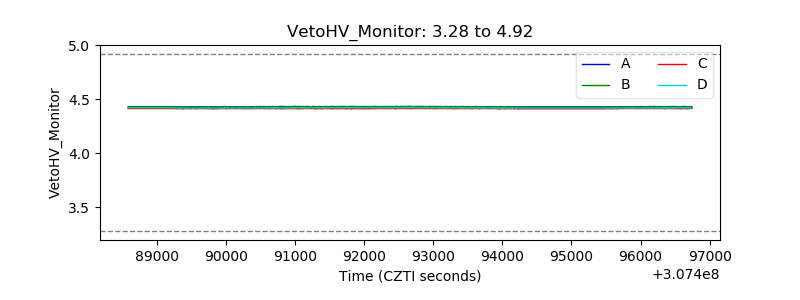 |
| Veto LLD | 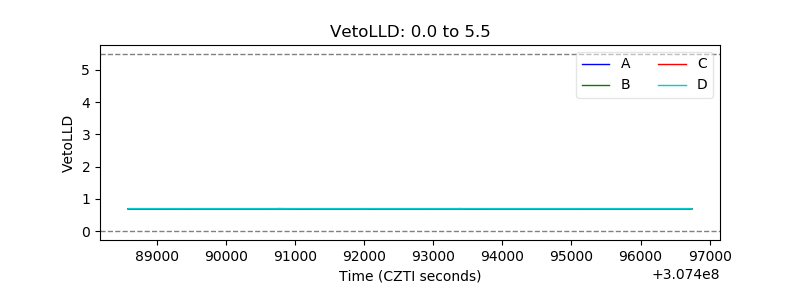 |
| Alpha Counter | 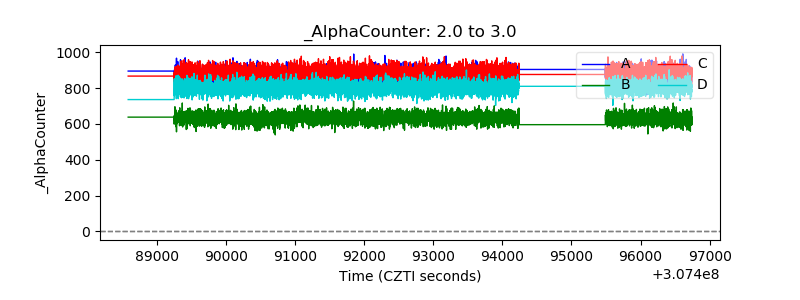 |
| _CPM_Rate | 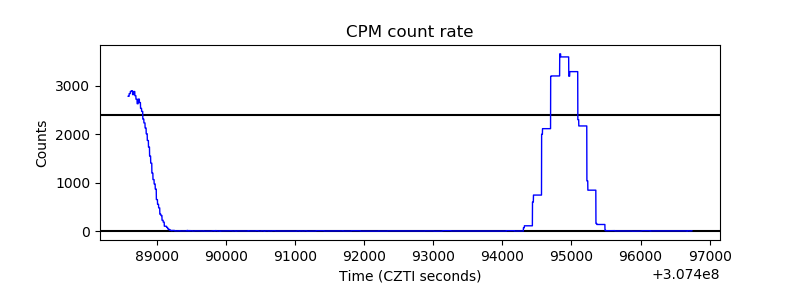 |
| CZT Counter | 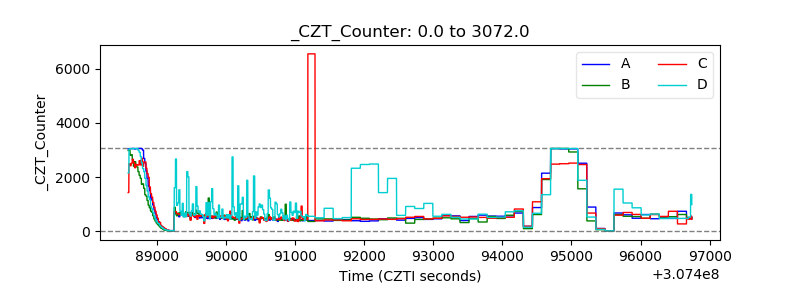 |
| +2.5 Volts monitor |  |
| +5 Volts monitor | 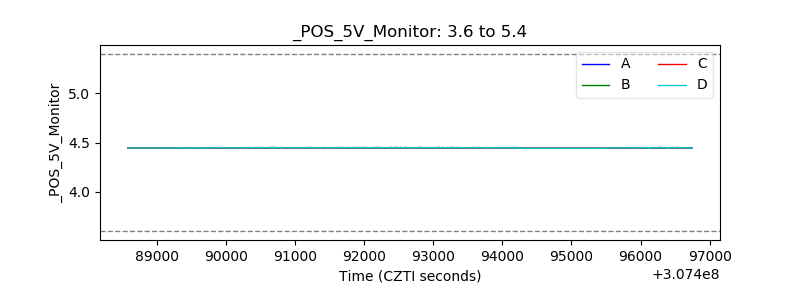 |
| _ROLL_ROT | 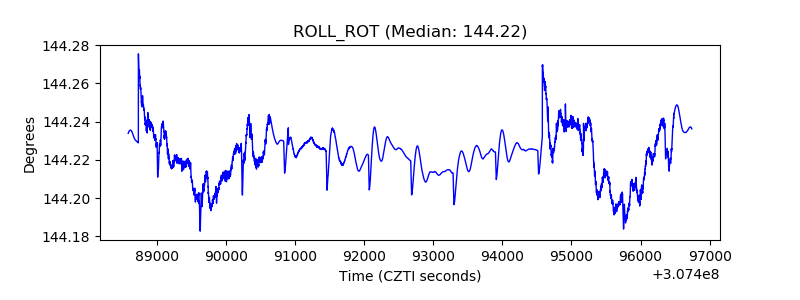 |
| _Roll_DEC | 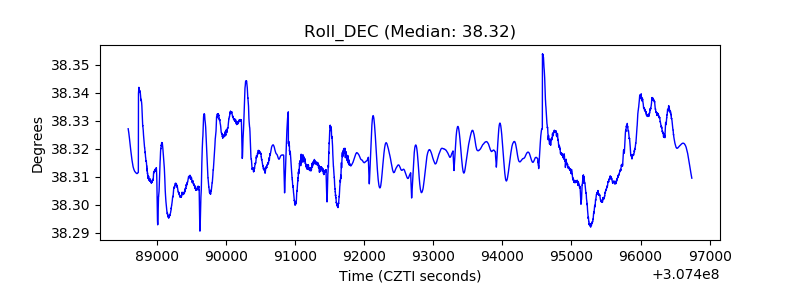 |
| _Roll_RA | 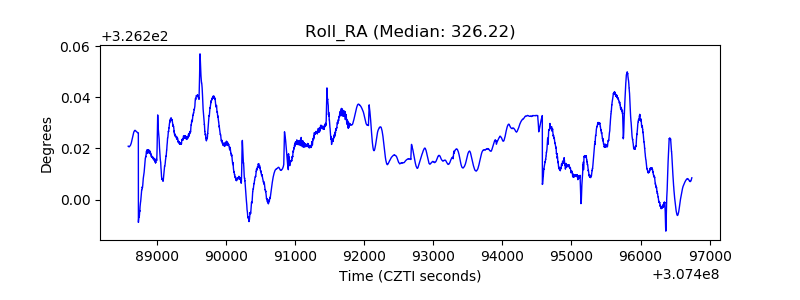 |
| Veto Counter | 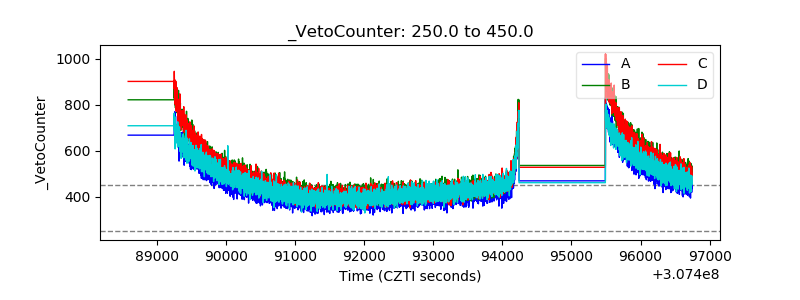 |