| Param | Original file | Final file |
|---|---|---|
| Filename | modeM0/AS1A06_002T02_9000003206_21653cztM0_level2.evt | modeM0/AS1A06_002T02_9000003206_21653cztM0_level2_quad_clean.evt |
| Size (bytes) | 456,145,920 | 95,964,480 |
| Size | 435.0 MB | 91.5 MB |
| Events in quadrant A | 3,139,735 | 632,092 |
| Events in quadrant B | 3,228,102 | 659,113 |
| Events in quadrant C | 3,108,501 | 615,862 |
| Events in quadrant D | 3,924,213 | 573,666 |
| Mode M0 | |||
|---|---|---|---|
| Quadrant | BADHDUFLAG | Total packets | Discarded packets |
| A | 0 | 13153 | 2 |
| B | 0 | 13385 | 2 |
| C | 0 | 12996 | 2 |
| D | 0 | 15695 | 2 |
| Mode M9 | |||
|---|---|---|---|
| Quadrant | BADHDUFLAG | Total packets | Discarded packets |
| A | 0 | 23 | 0 |
| B | 0 | 24 | 0 |
| C | 0 | 24 | 0 |
| D | 0 | 24 | 0 |
| Mode SS | |||
|---|---|---|---|
| Quadrant | BADHDUFLAG | Total packets | Discarded packets |
| A | 0 | 124 | 0 |
| B | 0 | 124 | 0 |
| C | 0 | 124 | 0 |
| D | 0 | 124 | 0 |
| Quadrant | Total seconds | Saturated seconds | Saturation percentage |
|---|---|---|---|
| A | 6094 | 25 | 0.410240% |
| B | 6094 | 35 | 0.574335% |
| C | 6094 | 71 | 1.165080% |
| D | 6094 | 150 | 2.461437% |
Noise dominated data is calculated using 1-second bins in cleaned event files. If a bin has >2000 counts, and if more than 50% of those come from <1% of pixels, then it is considered to be noise-dominated and hence unusable.
| Quadrant | # 1 sec bins | Bins with >0 counts | Bins with >2000 counts | High rate bins dominated by noise | Noise dominated (total time) | Noise dominated (detector-on time) | Marked lightcurve |
|---|---|---|---|---|---|---|---|
| A | 7429 | 6095 | 1 | 1 | 0.01% | 0.02% | 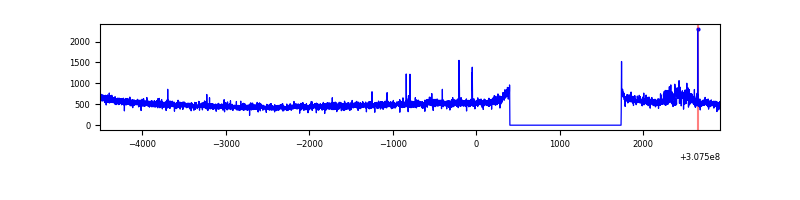 |
| B | 7429 | 6095 | 0 | 0 | 0.00% | 0.00% | 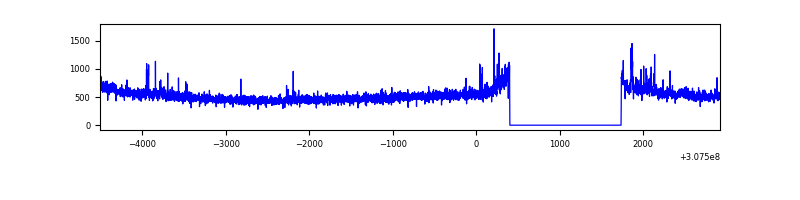 |
| C | 7429 | 6095 | 0 | 0 | 0.00% | 0.00% | 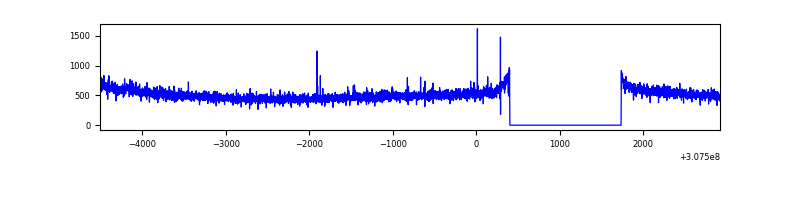 |
| D | 7429 | 6095 | 114 | 114 | 1.53% | 1.87% | 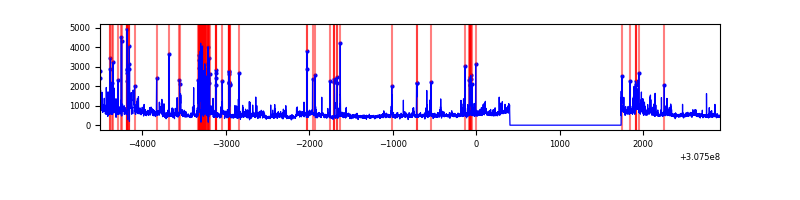 |
Top three noisy pixels from each quadrant. If the there are fewer than three noisy pixels in the level2.evt file, extra rows are filled as -1
| Pixel properties | Quadrant properties | ||||||
|---|---|---|---|---|---|---|---|
| Quadrant | DetID | PixID | Counts | Sigma | Mean | Median | Sigma |
| A | 15 | 236 | 84376 | 534.8 | 788 | 774 | 156.3 |
| A | 4 | 2 | 11809 | 70.59 | 788 | 774 | 156.3 |
| A | 15 | 174 | 9845 | 58.03 | 788 | 774 | 156.3 |
| B | 0 | 230 | 31000 | 203.98 | 796 | 778 | 148.2 |
| B | 4 | 216 | 19388 | 125.61 | 796 | 778 | 148.2 |
| B | 0 | 189 | 18499 | 119.61 | 796 | 778 | 148.2 |
| C | 14 | 238 | 121800 | 687.04 | 761 | 769 | 176.2 |
| C | 10 | 22 | 11197 | 59.19 | 761 | 769 | 176.2 |
| C | 9 | 54 | 5229 | 25.32 | 761 | 769 | 176.2 |
| D | 1 | 52 | 610460 | 3383.54 | 747 | 726 | 180.2 |
| D | 7 | 238 | 175094 | 967.61 | 747 | 726 | 180.2 |
| D | 9 | 68 | 144376 | 797.14 | 747 | 726 | 180.2 |
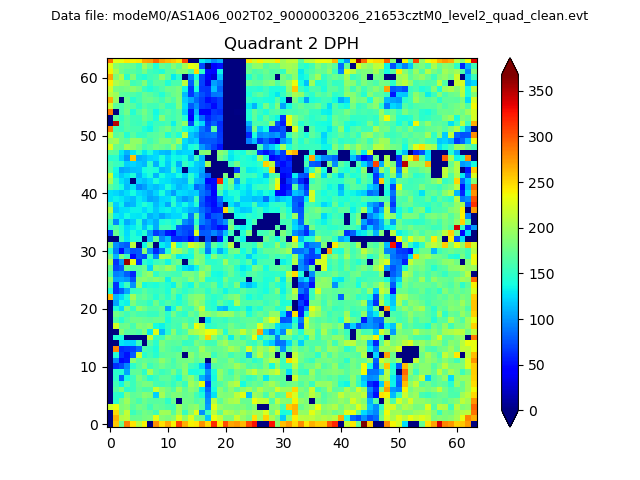
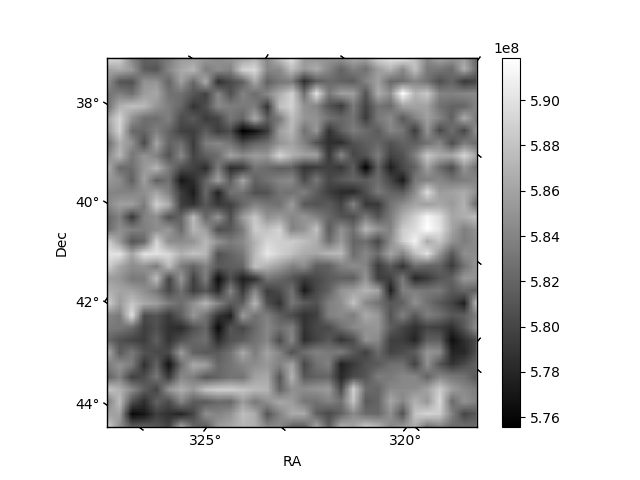
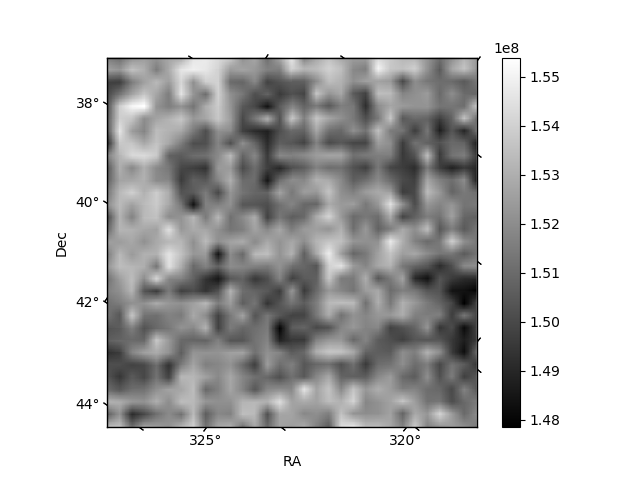
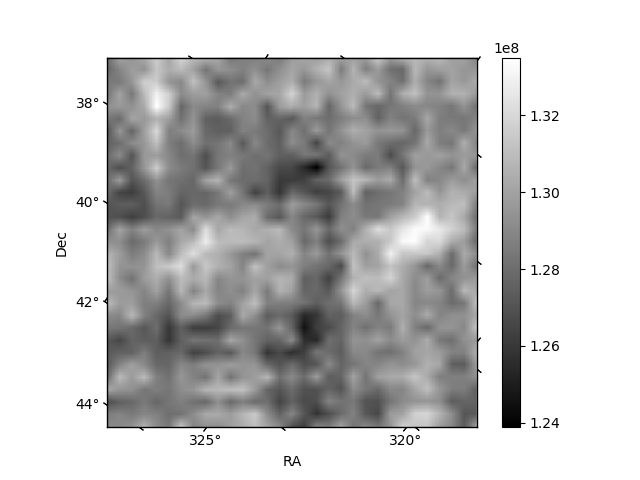
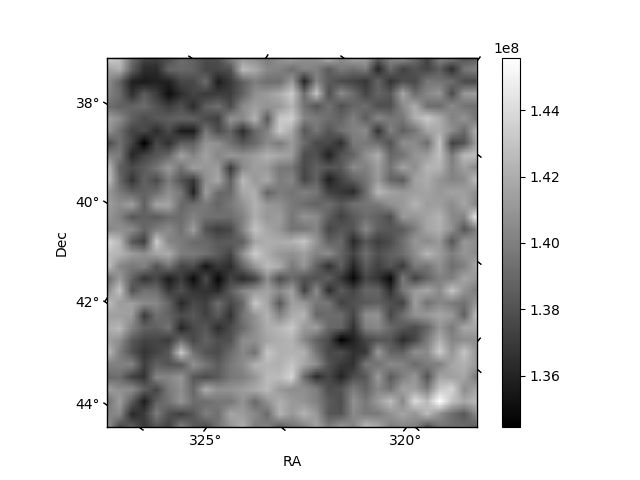
Histogram calculated using DETX and DETY for each event in the final _common_clean file
| Quadrant A | 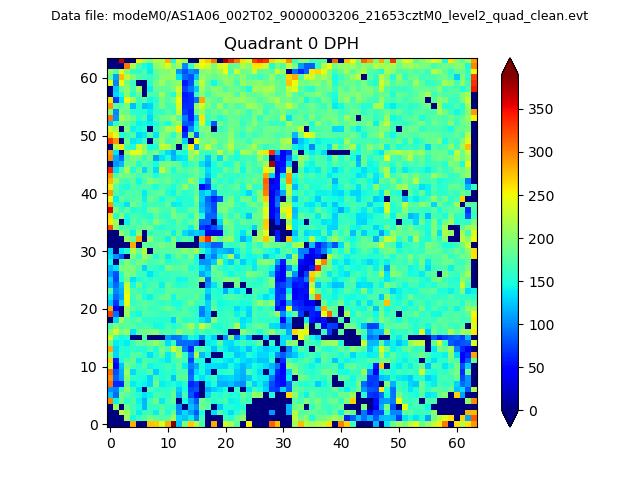 |
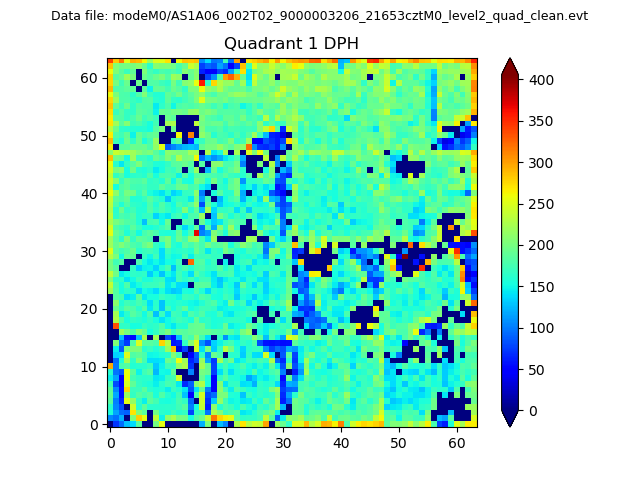 |
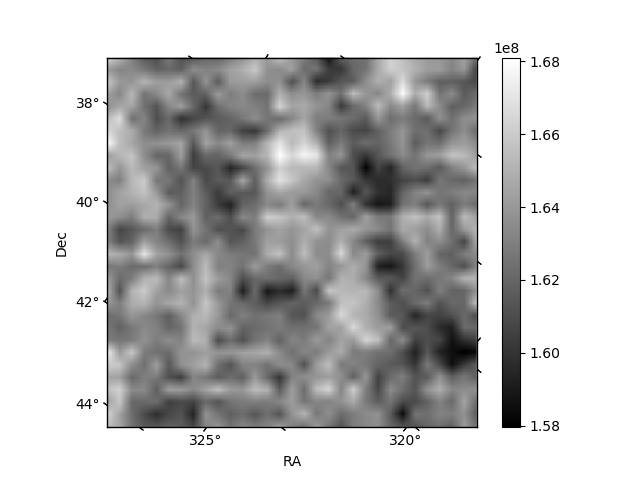
Quadrant B |
|---|---|---|---|
| Quadrant D | 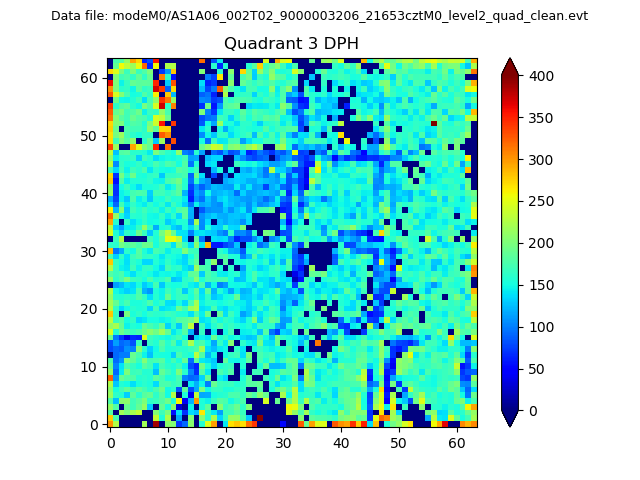 |
 |
Quadrant C |
| Plot type | Count rate plots | Images |
|---|---|---|
| Comparison with Poisson distribution Blue bars denote a histogram of data divided into 1 sec bins. Red curve is a Poisson curve with rate = median count rate of data. |
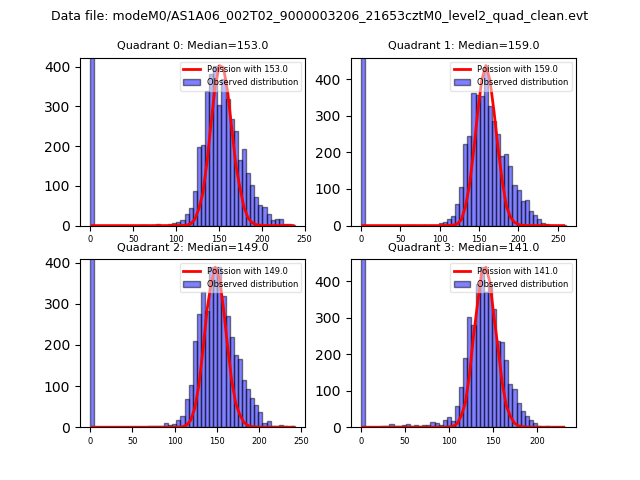 |
 |
| Quadrant-wise count rates Data is divided into 100 sec bins |
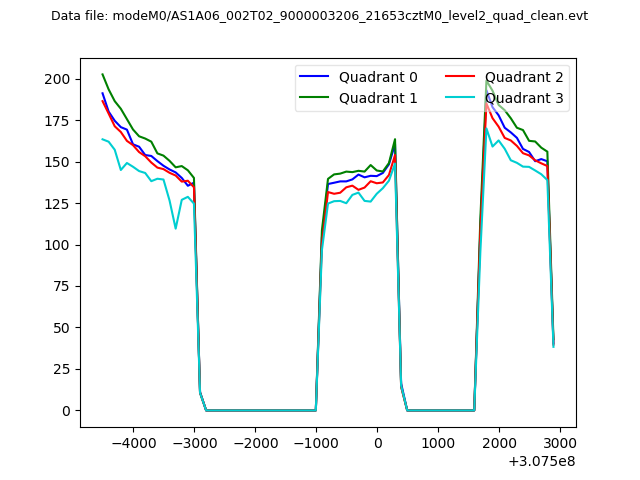 |
|
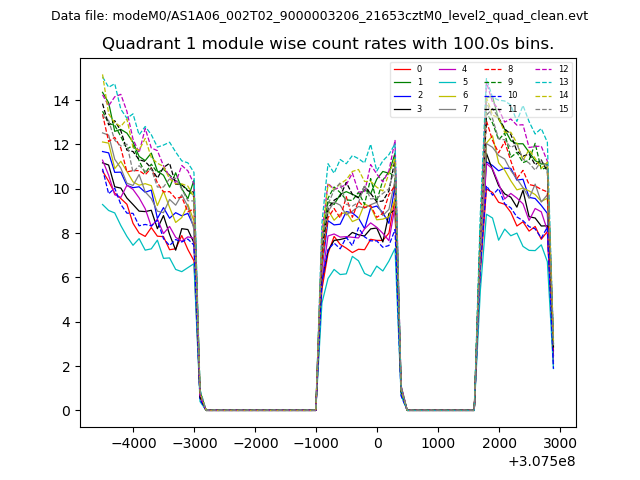
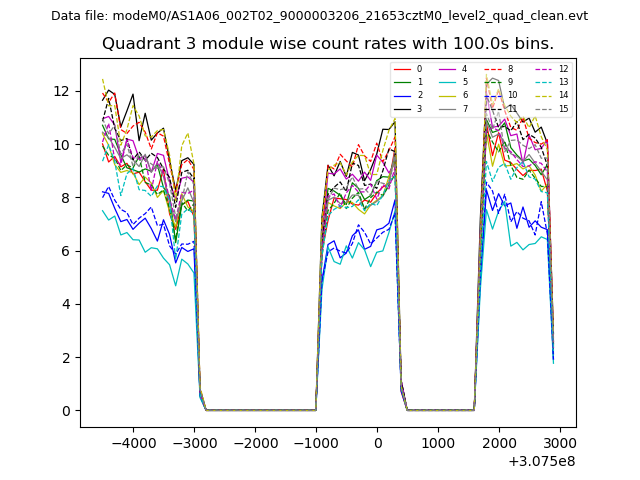
| Module-wise count rates for Quadrant A Data is divided into 100 sec bins |
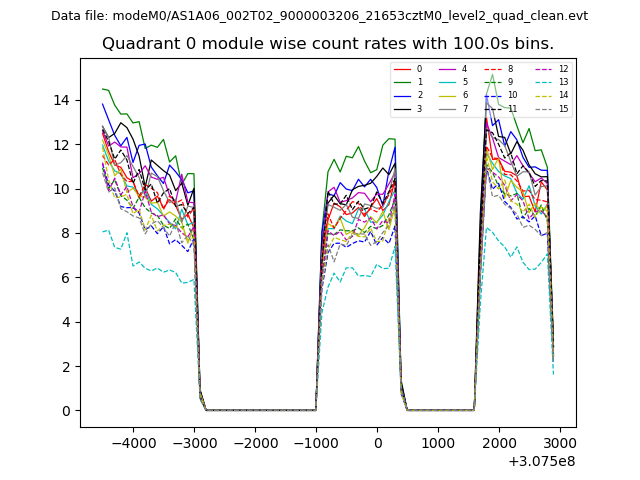 |
 |
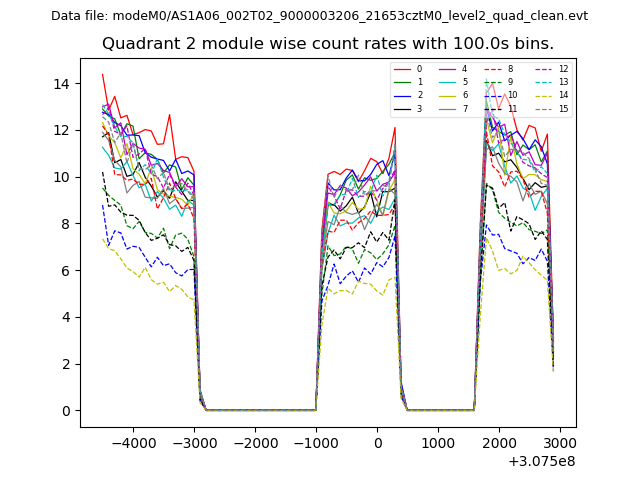
| Module-wise count rates for Quadrant B Data is divided into 100 sec bins |
 |
 |
| Module-wise count rates for Quadrant C Data is divided into 100 sec bins |
 |
 |
| Module-wise count rates for Quadrant D Data is divided into 100 sec bins |
 |
 |
| Parameter | Plot |
|---|---|
| CZT HV Monitor | 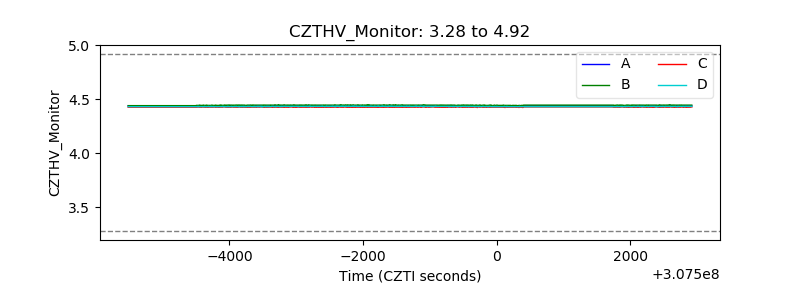 |
| D_VDD | 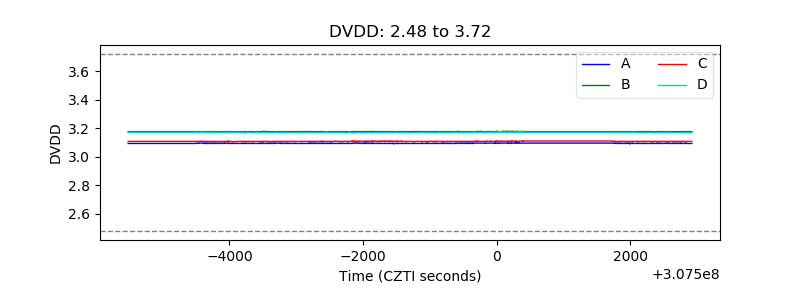 |
| Temperature 1 | 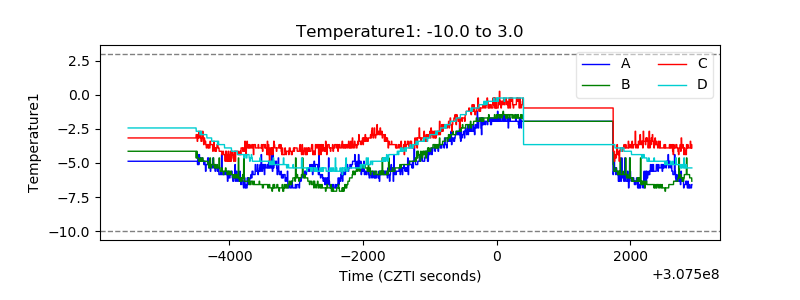 |
| Veto HV Monitor | 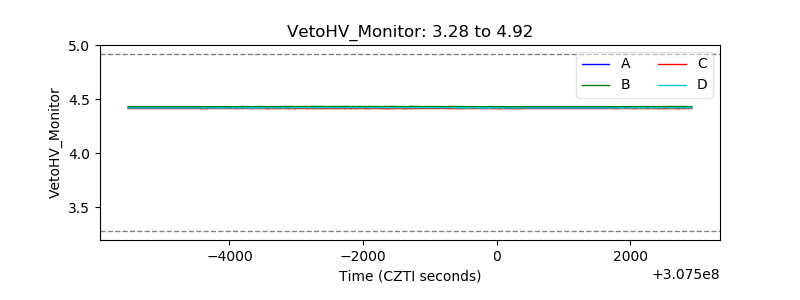 |
| Veto LLD | 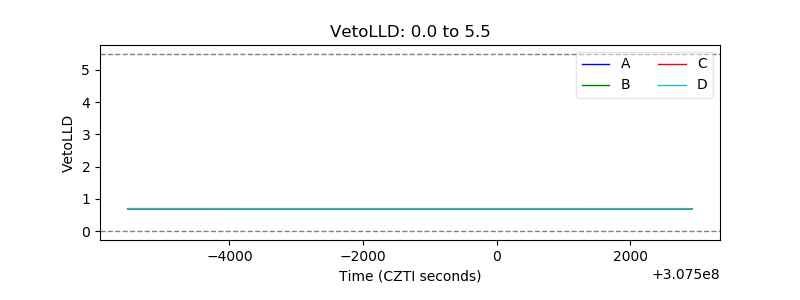 |
| Alpha Counter | 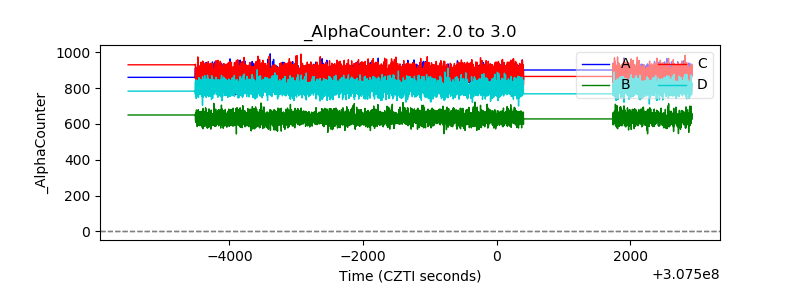 |
| _CPM_Rate | 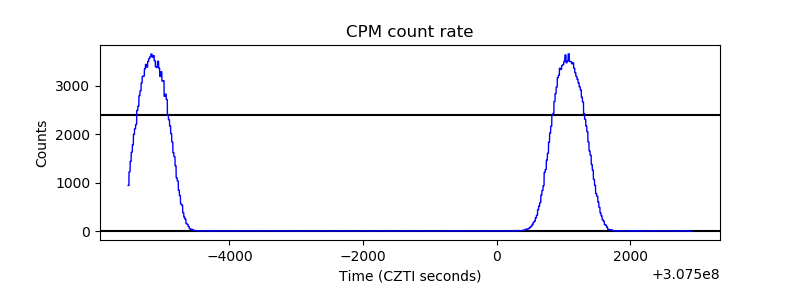 |
| CZT Counter | 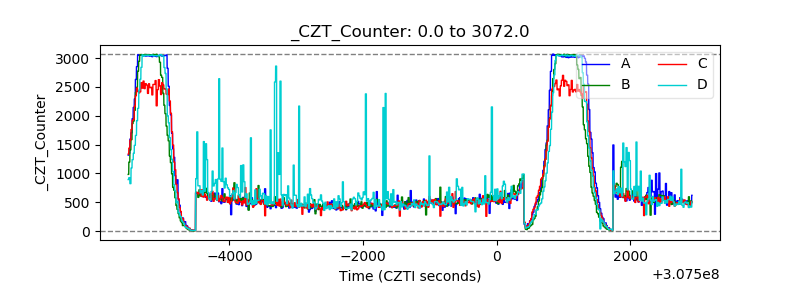 |
| +2.5 Volts monitor |  |
| +5 Volts monitor |  |
| _ROLL_ROT | 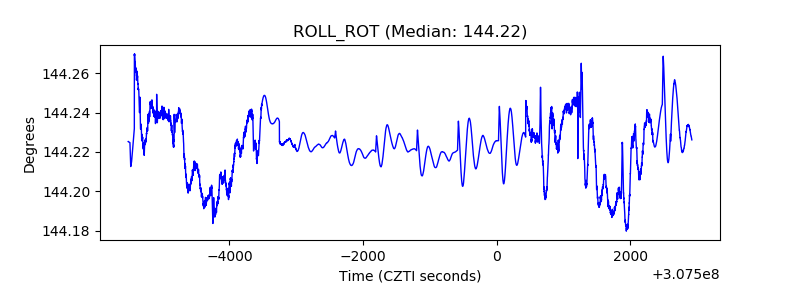 |
| _Roll_DEC | 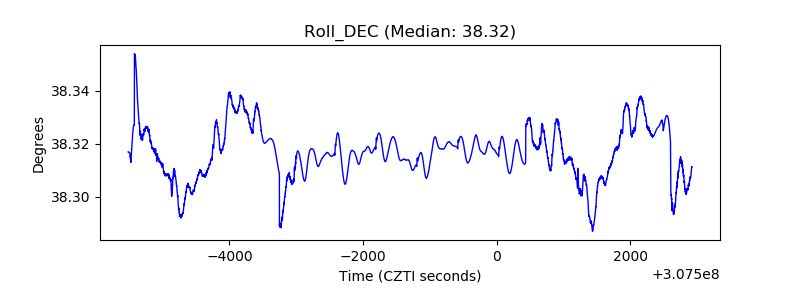 |
| _Roll_RA | 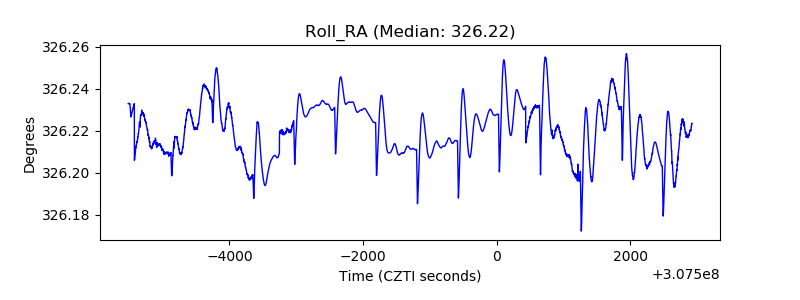 |
| Veto Counter | 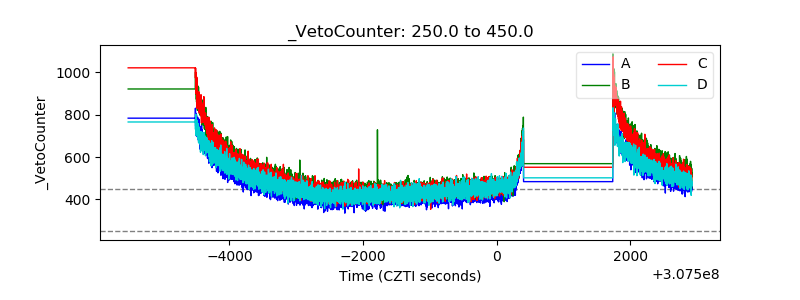 |