| Param | Original file | Final file |
|---|---|---|
| Filename | modeM0/AS1A06_002T02_9000003206_21654cztM0_level2.evt | modeM0/AS1A06_002T02_9000003206_21654cztM0_level2_quad_clean.evt |
| Size (bytes) | 488,266,560 | 89,582,400 |
| Size | 465.6 MB | 85.4 MB |
| Events in quadrant A | 3,285,684 | 582,111 |
| Events in quadrant B | 3,430,431 | 605,255 |
| Events in quadrant C | 3,385,272 | 562,878 |
| Events in quadrant D | 4,260,337 | 524,875 |
| Mode M0 | |||
|---|---|---|---|
| Quadrant | BADHDUFLAG | Total packets | Discarded packets |
| A | 0 | 13635 | 3 |
| B | 0 | 14051 | 2 |
| C | 0 | 13915 | 2 |
| D | 0 | 16845 | 2 |
| Mode M9 | |||
|---|---|---|---|
| Quadrant | BADHDUFLAG | Total packets | Discarded packets |
| A | 0 | 28 | 0 |
| B | 0 | 28 | 0 |
| C | 0 | 28 | 0 |
| D | 0 | 28 | 0 |
| Mode SS | |||
|---|---|---|---|
| Quadrant | BADHDUFLAG | Total packets | Discarded packets |
| A | 0 | 130 | 0 |
| B | 0 | 130 | 0 |
| C | 0 | 130 | 0 |
| D | 0 | 130 | 0 |
| Quadrant | Total seconds | Saturated seconds | Saturation percentage |
|---|---|---|---|
| A | 6274 | 38 | 0.605674% |
| B | 6274 | 70 | 1.115716% |
| C | 6275 | 86 | 1.370518% |
| D | 6275 | 243 | 3.872510% |
Noise dominated data is calculated using 1-second bins in cleaned event files. If a bin has >2000 counts, and if more than 50% of those come from <1% of pixels, then it is considered to be noise-dominated and hence unusable.
| Quadrant | # 1 sec bins | Bins with >0 counts | Bins with >2000 counts | High rate bins dominated by noise | Noise dominated (total time) | Noise dominated (detector-on time) | Marked lightcurve |
|---|---|---|---|---|---|---|---|
| A | 9024 | 6277 | 1 | 1 | 0.01% | 0.02% | 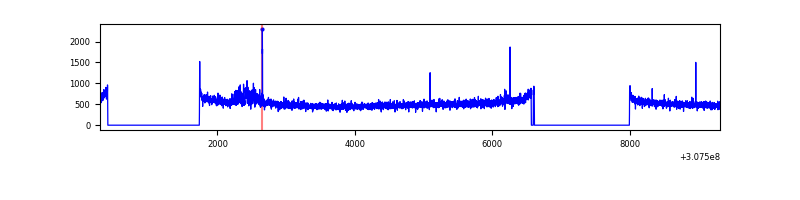 |
| B | 9024 | 6277 | 4 | 4 | 0.04% | 0.06% | 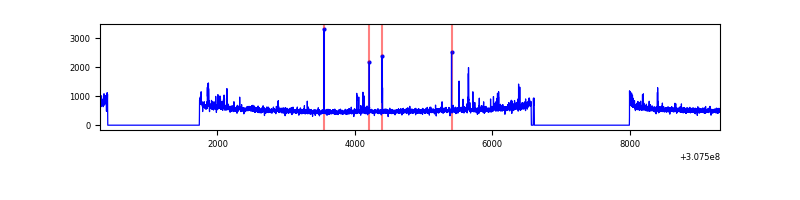 |
| C | 9025 | 6278 | 0 | 0 | 0.00% | 0.00% | 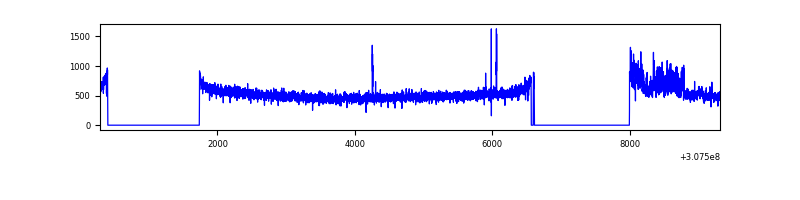 |
| D | 9025 | 6278 | 171 | 171 | 1.89% | 2.72% | 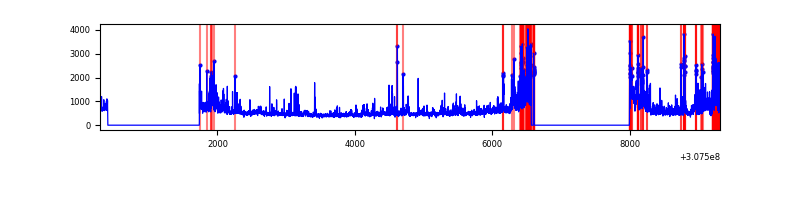 |
Top three noisy pixels from each quadrant. If the there are fewer than three noisy pixels in the level2.evt file, extra rows are filled as -1
| Pixel properties | Quadrant properties | ||||||
|---|---|---|---|---|---|---|---|
| Quadrant | DetID | PixID | Counts | Sigma | Mean | Median | Sigma |
| A | 15 | 236 | 120138 | 725.8 | 822 | 806 | 164.4 |
| A | 13 | 254 | 7875 | 43.0 | 822 | 806 | 164.4 |
| A | 0 | 226 | 7058 | 38.03 | 822 | 806 | 164.4 |
| B | 0 | 230 | 48126 | 310.23 | 830 | 813 | 152.5 |
| B | 3 | 64 | 47695 | 307.41 | 830 | 813 | 152.5 |
| B | 0 | 189 | 18101 | 113.36 | 830 | 813 | 152.5 |
| C | 9 | 54 | 155105 | 847.11 | 792 | 799 | 182.2 |
| C | 14 | 238 | 126964 | 692.62 | 792 | 799 | 182.2 |
| C | 10 | 22 | 14281 | 74.01 | 792 | 799 | 182.2 |
| D | 1 | 52 | 710648 | 3791.92 | 774 | 753 | 187.2 |
| D | 7 | 238 | 411728 | 2195.23 | 774 | 753 | 187.2 |
| D | 2 | 136 | 65618 | 346.48 | 774 | 753 | 187.2 |
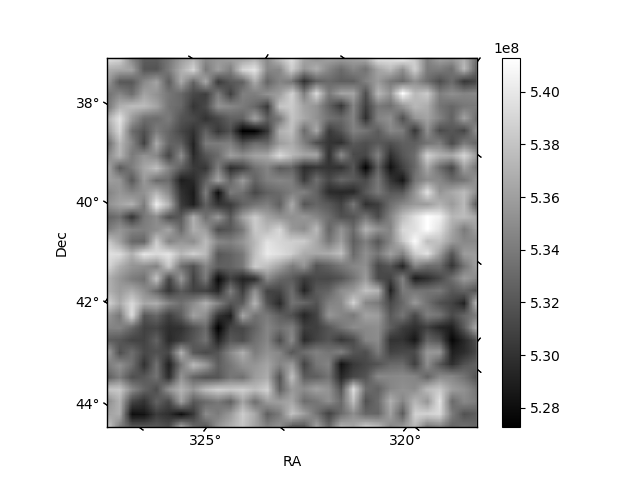
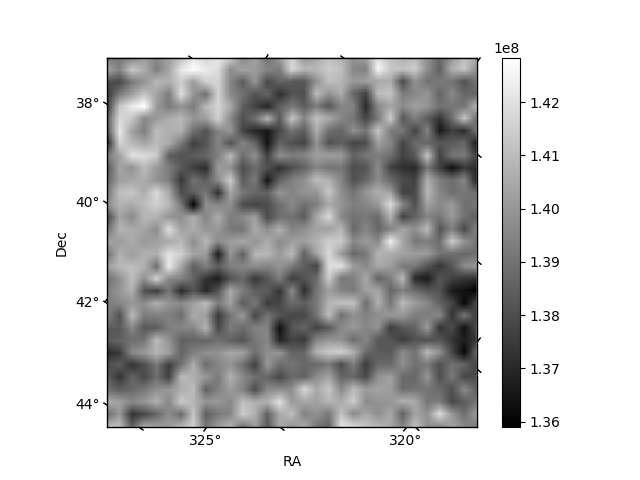
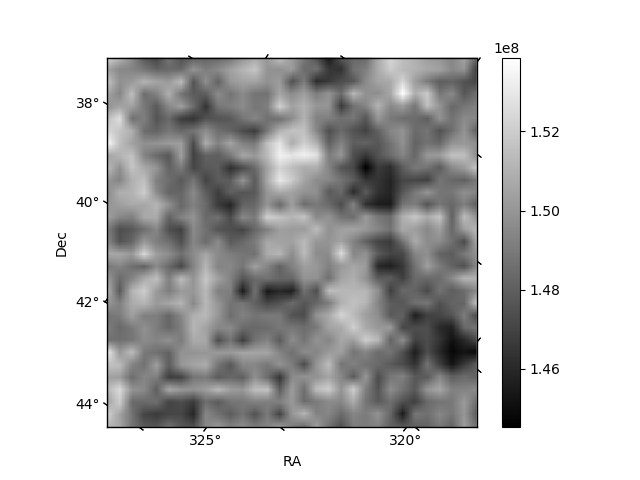
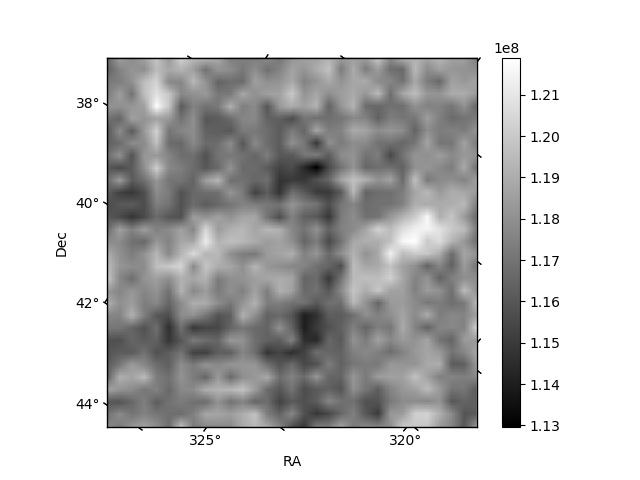
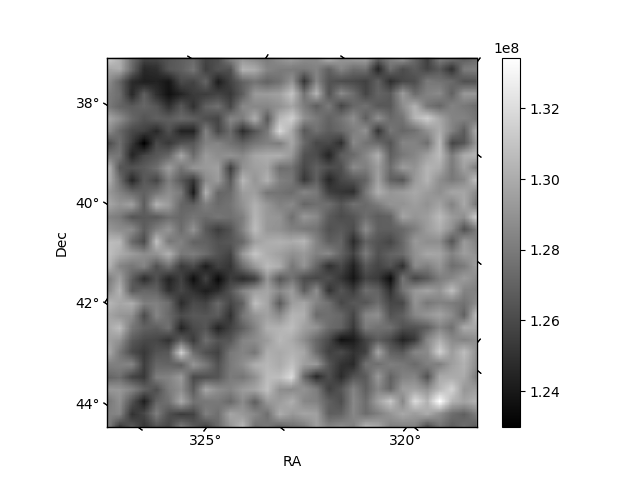
Histogram calculated using DETX and DETY for each event in the final _common_clean file
| Quadrant A | 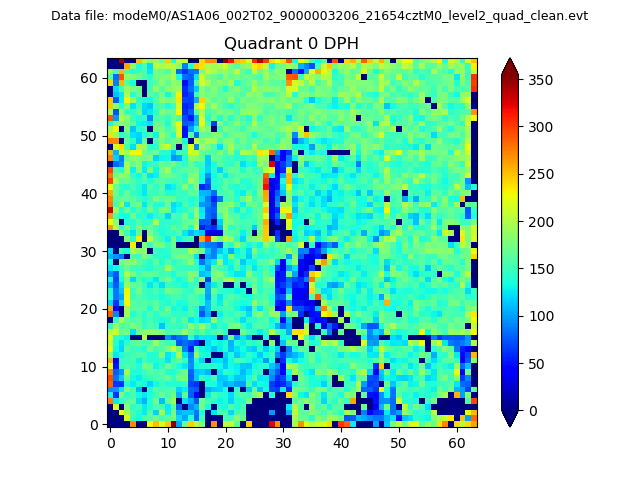 |
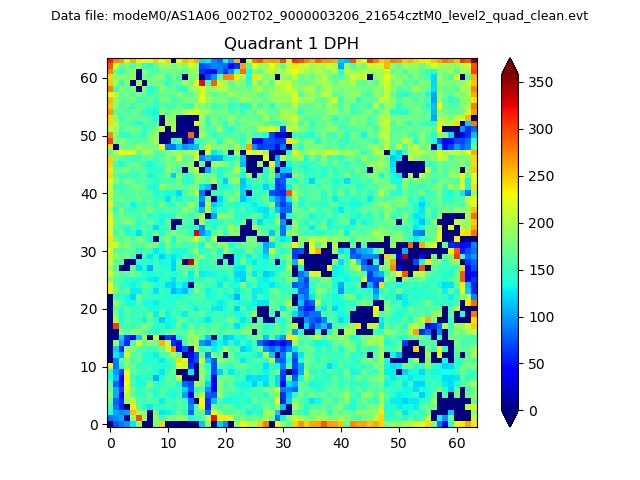 |
Quadrant B |
|---|---|---|---|
| Quadrant D | 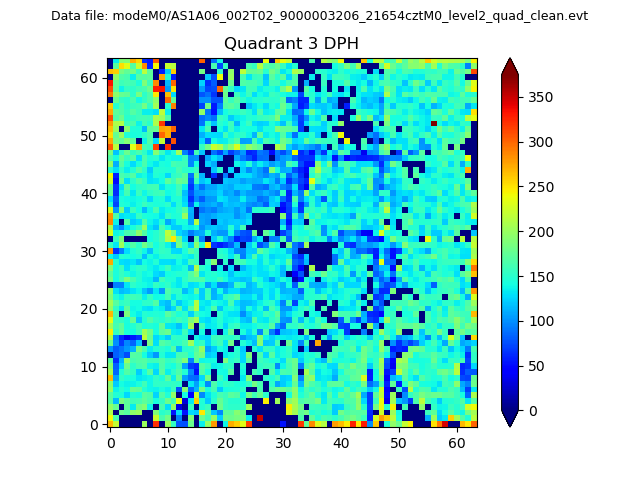 |
 |
Quadrant C |
| Plot type | Count rate plots | Images |
|---|---|---|
| Comparison with Poisson distribution Blue bars denote a histogram of data divided into 1 sec bins. Red curve is a Poisson curve with rate = median count rate of data. |
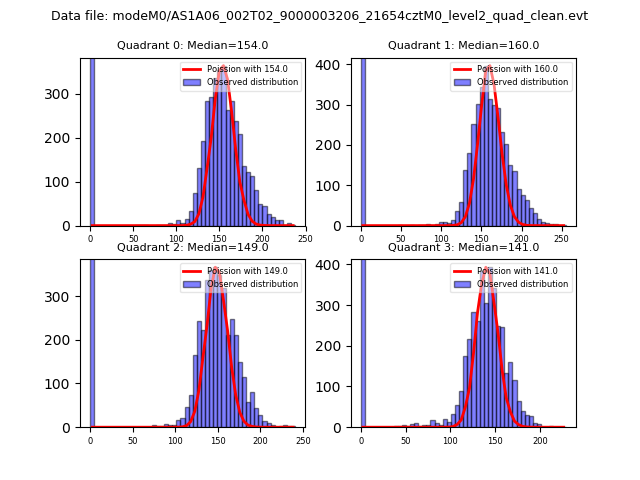 |
 |
| Quadrant-wise count rates Data is divided into 100 sec bins |
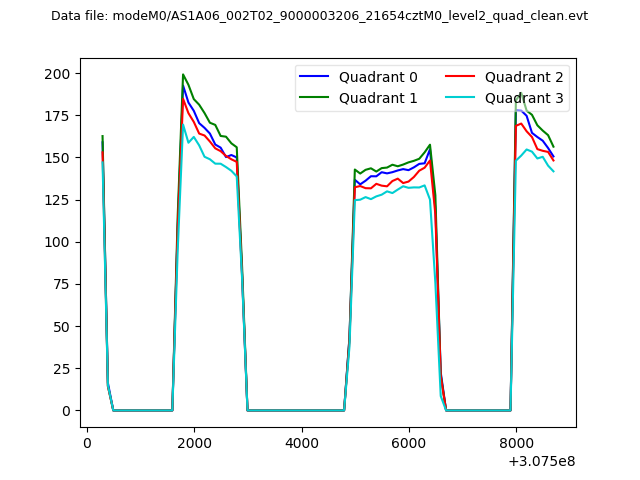 |
|
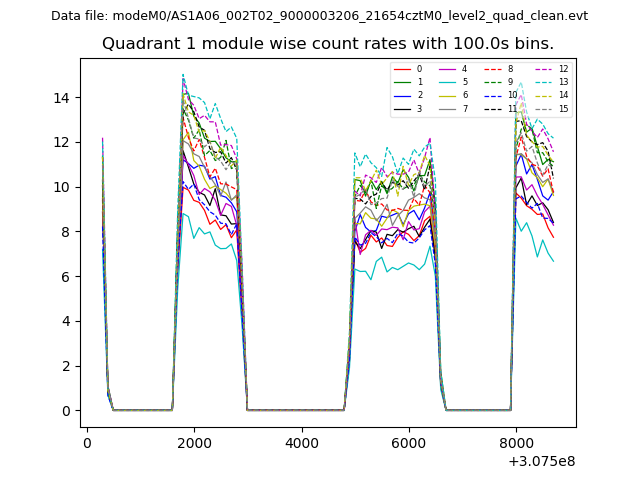
| Module-wise count rates for Quadrant A Data is divided into 100 sec bins |
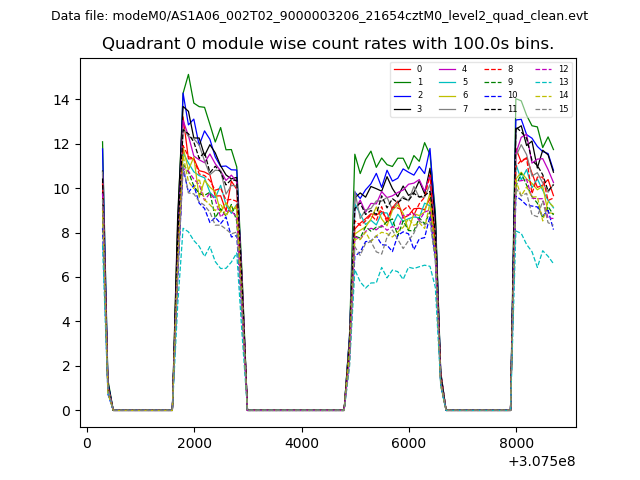 |
 |
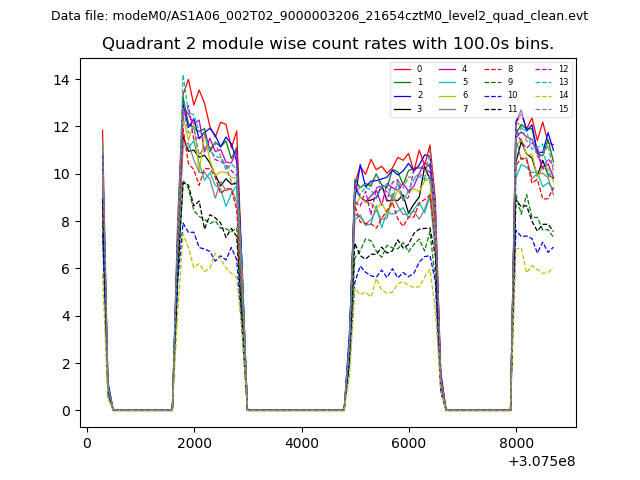
| Module-wise count rates for Quadrant B Data is divided into 100 sec bins |
 |
 |
| Module-wise count rates for Quadrant C Data is divided into 100 sec bins |
 |
 |
| Module-wise count rates for Quadrant D Data is divided into 100 sec bins |
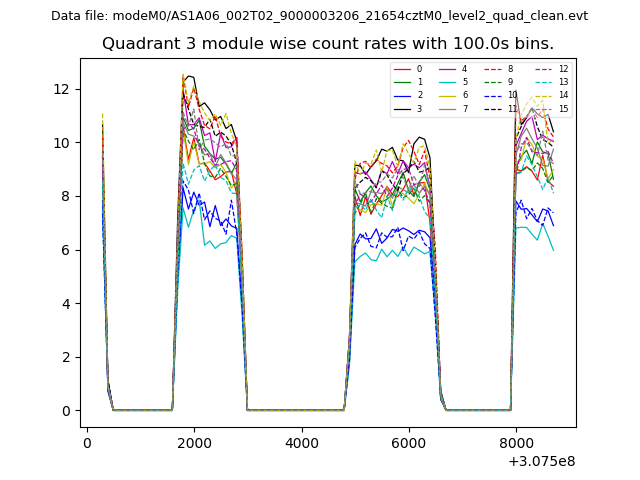 |
 |
| Parameter | Plot |
|---|---|
| CZT HV Monitor | 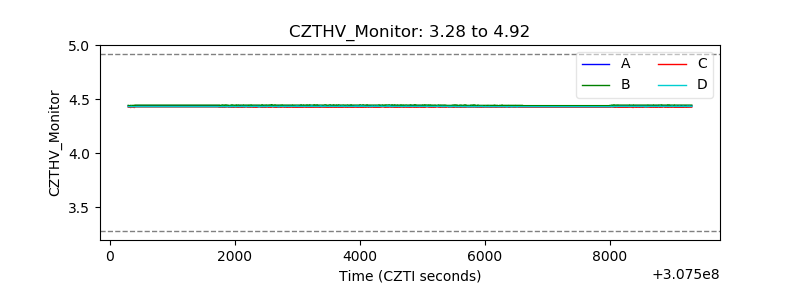 |
| D_VDD | 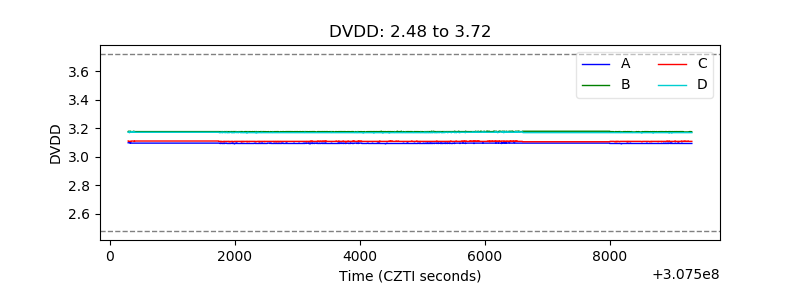 |
| Temperature 1 | 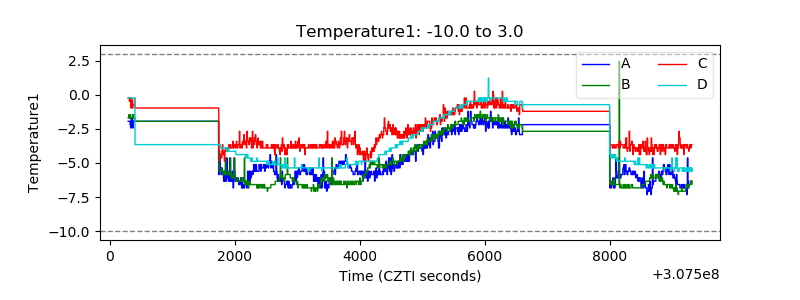 |
| Veto HV Monitor |  |
| Veto LLD | 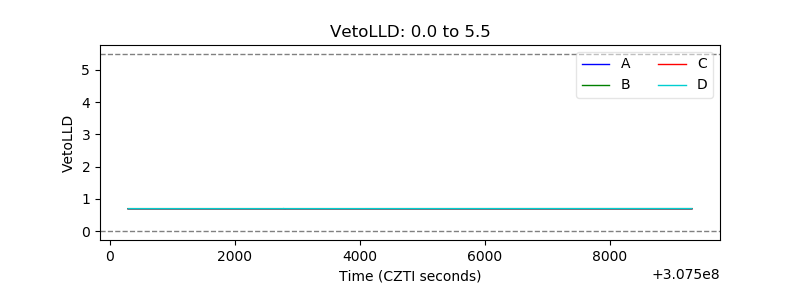 |
| Alpha Counter | 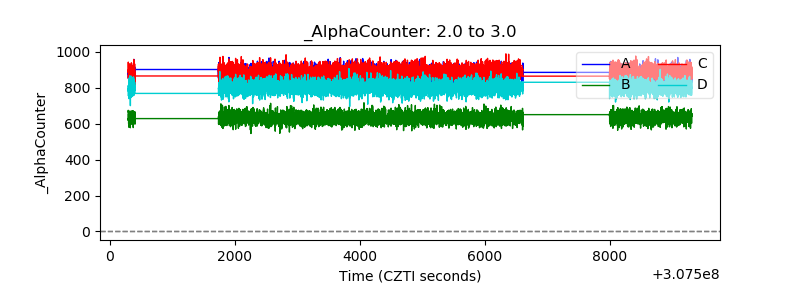 |
| _CPM_Rate | 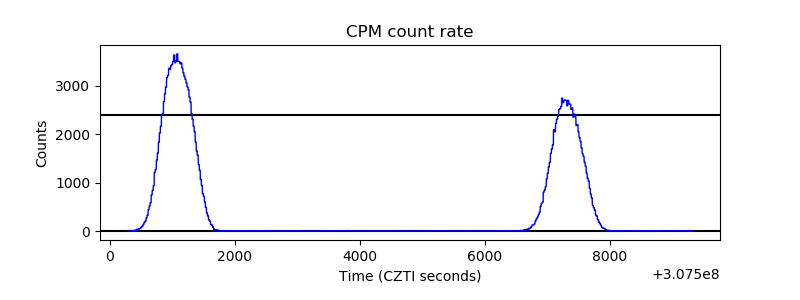 |
| CZT Counter | 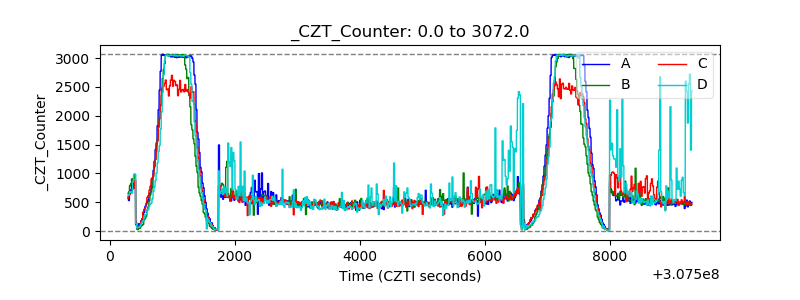 |
| +2.5 Volts monitor |  |
| +5 Volts monitor | 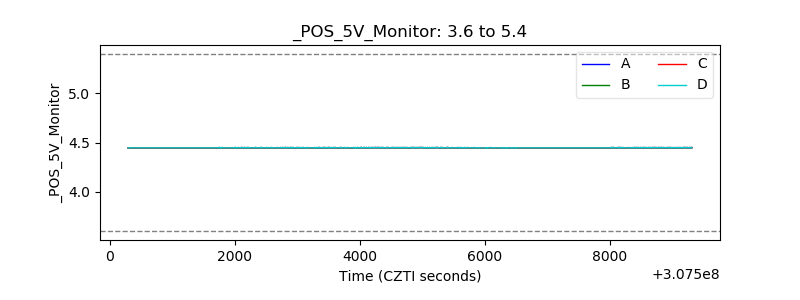 |
| _ROLL_ROT | 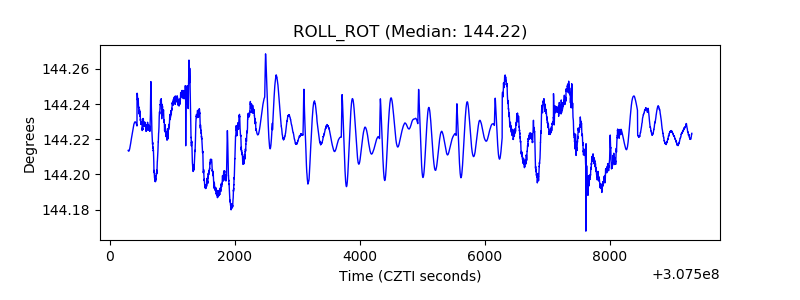 |
| _Roll_DEC | 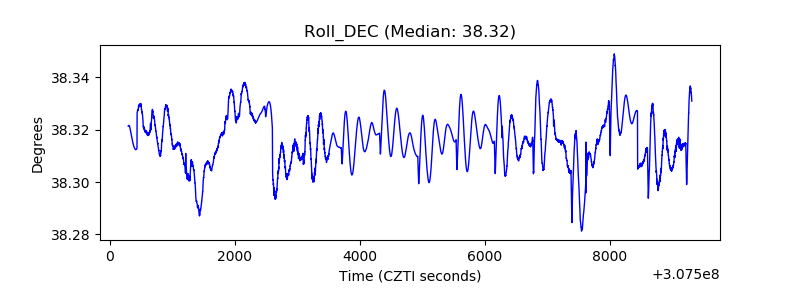 |
| _Roll_RA | 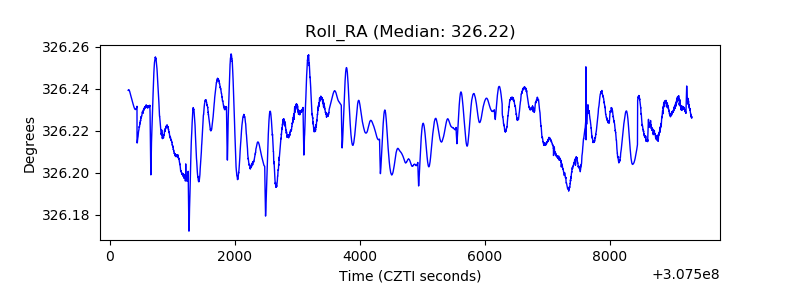 |
| Veto Counter | 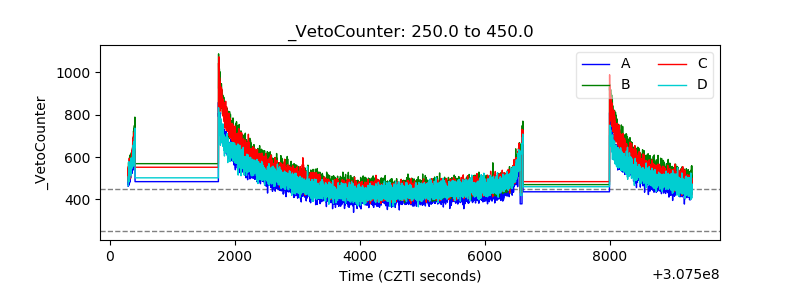 |