| Param | Original file | Final file |
|---|---|---|
| Filename | modeM0/AS1A06_002T02_9000003206_21655cztM0_level2.evt | modeM0/AS1A06_002T02_9000003206_21655cztM0_level2_quad_clean.evt |
| Size (bytes) | 277,139,520 | 47,229,120 |
| Size | 264.3 MB | 45.0 MB |
| Events in quadrant A | 1,789,063 | 302,707 |
| Events in quadrant B | 1,942,812 | 308,351 |
| Events in quadrant C | 1,990,699 | 288,903 |
| Events in quadrant D | 2,422,709 | 273,049 |
| Mode M0 | |||
|---|---|---|---|
| Quadrant | BADHDUFLAG | Total packets | Discarded packets |
| A | 0 | 8156 | 742 |
| B | 0 | 8768 | 885 |
| C | 0 | 8919 | 802 |
| D | 0 | 10795 | 1230 |
| Mode M9 | |||
|---|---|---|---|
| Quadrant | BADHDUFLAG | Total packets | Discarded packets |
| A | 0 | 12 | 2 |
| B | 0 | 13 | 3 |
| C | 0 | 13 | 3 |
| D | 0 | 13 | 3 |
| Mode SS | |||
|---|---|---|---|
| Quadrant | BADHDUFLAG | Total packets | Discarded packets |
| A | 0 | 82 | 12 |
| B | 0 | 82 | 10 |
| C | 0 | 80 | 6 |
| D | 0 | 79 | 9 |
| Quadrant | Total seconds | Saturated seconds | Saturation percentage |
|---|---|---|---|
| A | 3637 | 5 | 0.137476% |
| B | 3629 | 16 | 0.440893% |
| C | 3637 | 91 | 2.502062% |
| D | 3626 | 94 | 2.592388% |
Noise dominated data is calculated using 1-second bins in cleaned event files. If a bin has >2000 counts, and if more than 50% of those come from <1% of pixels, then it is considered to be noise-dominated and hence unusable.
| Quadrant | # 1 sec bins | Bins with >0 counts | Bins with >2000 counts | High rate bins dominated by noise | Noise dominated (total time) | Noise dominated (detector-on time) | Marked lightcurve |
|---|---|---|---|---|---|---|---|
| A | 6228 | 3678 | 1 | 1 | 0.02% | 0.03% | 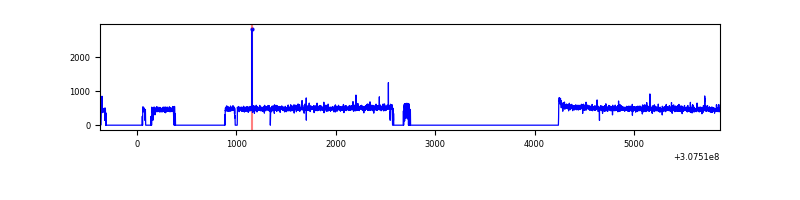 |
| B | 6228 | 3669 | 10 | 10 | 0.16% | 0.27% | 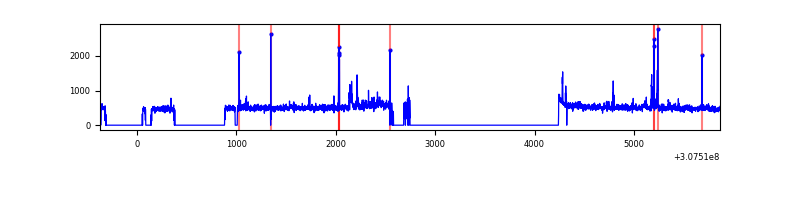 |
| C | 6232 | 3679 | 0 | 0 | 0.00% | 0.00% | 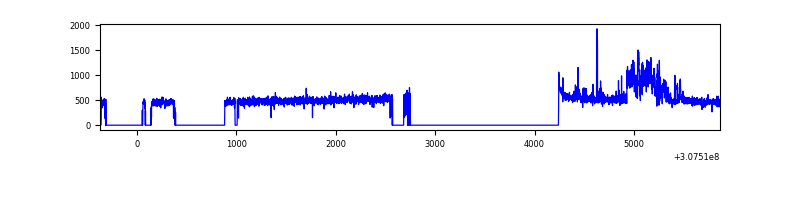 |
| D | 6232 | 3673 | 65 | 65 | 1.04% | 1.77% | 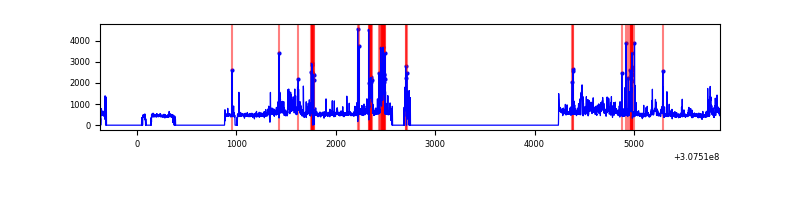 |
Top three noisy pixels from each quadrant. If the there are fewer than three noisy pixels in the level2.evt file, extra rows are filled as -1
| Pixel properties | Quadrant properties | ||||||
|---|---|---|---|---|---|---|---|
| Quadrant | DetID | PixID | Counts | Sigma | Mean | Median | Sigma |
| A | 15 | 236 | 18185 | 190.96 | 460 | 451 | 92.9 |
| A | 13 | 254 | 4646 | 45.17 | 460 | 451 | 92.9 |
| A | 0 | 226 | 3937 | 37.54 | 460 | 451 | 92.9 |
| B | 3 | 64 | 68028 | 771.53 | 460 | 448 | 87.6 |
| B | 0 | 229 | 23975 | 268.6 | 460 | 448 | 87.6 |
| B | 0 | 228 | 18115 | 201.7 | 460 | 448 | 87.6 |
| C | 9 | 54 | 211332 | 2057.56 | 437 | 439 | 102.5 |
| C | 14 | 238 | 68839 | 667.34 | 437 | 439 | 102.5 |
| C | 10 | 22 | 4100 | 35.72 | 437 | 439 | 102.5 |
| D | 1 | 52 | 308651 | 2848.58 | 437 | 424 | 108.2 |
| D | 1 | 20 | 262422 | 2421.34 | 437 | 424 | 108.2 |
| D | 7 | 238 | 127812 | 1177.3 | 437 | 424 | 108.2 |
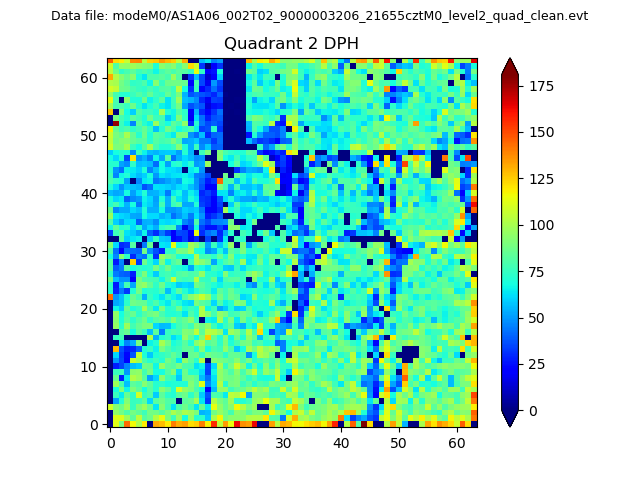
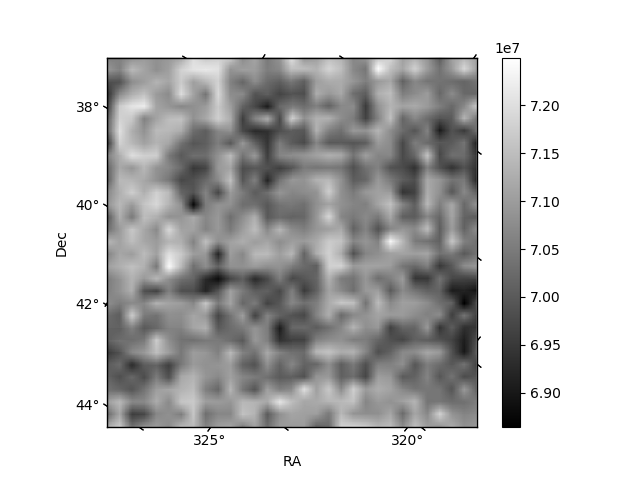
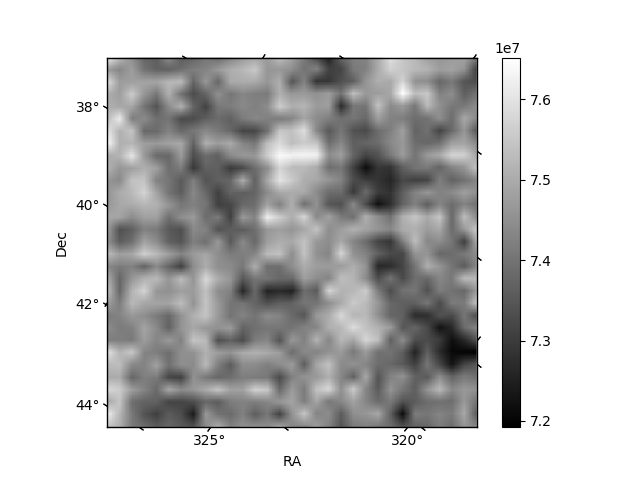
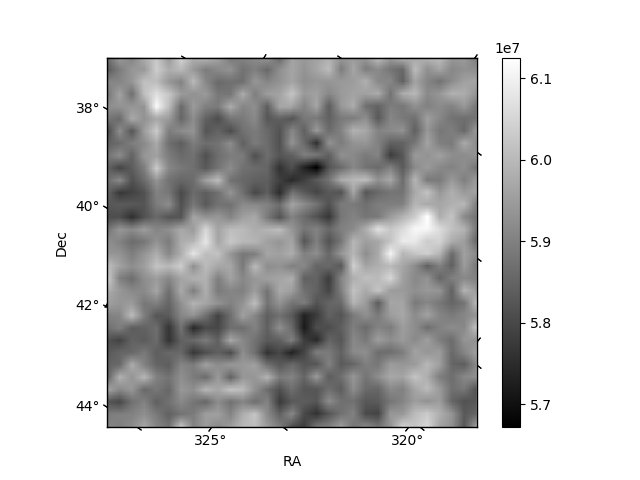
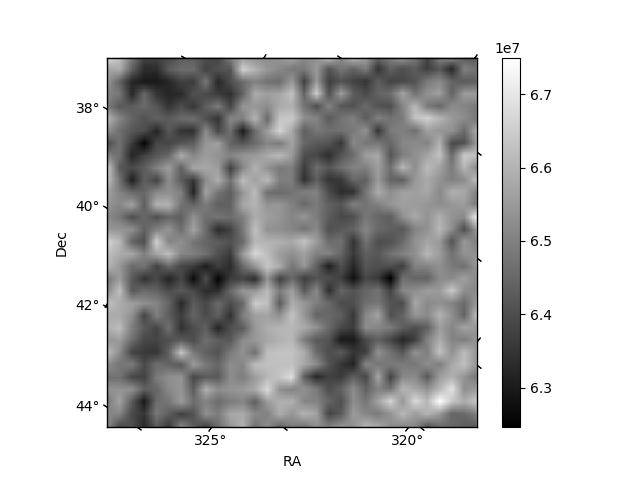
Histogram calculated using DETX and DETY for each event in the final _common_clean file
| Quadrant A | 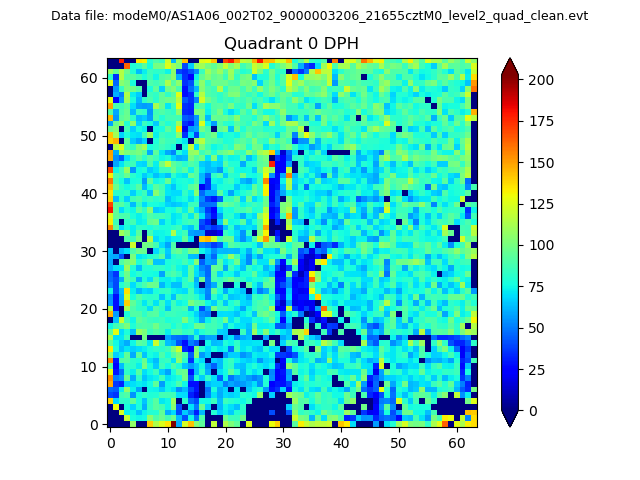 |
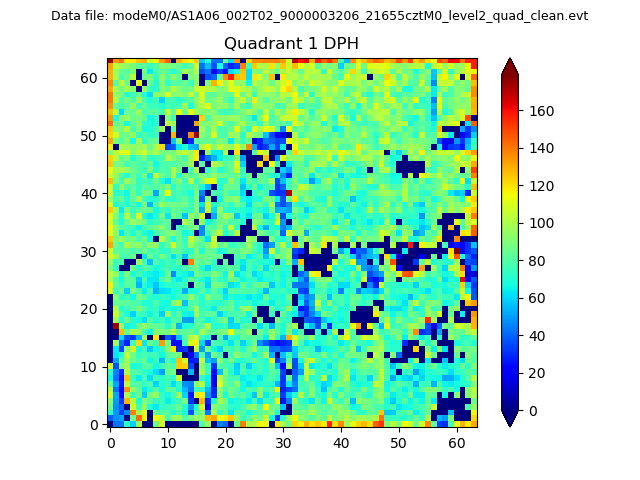 |
Quadrant B |
|---|---|---|---|
| Quadrant D | 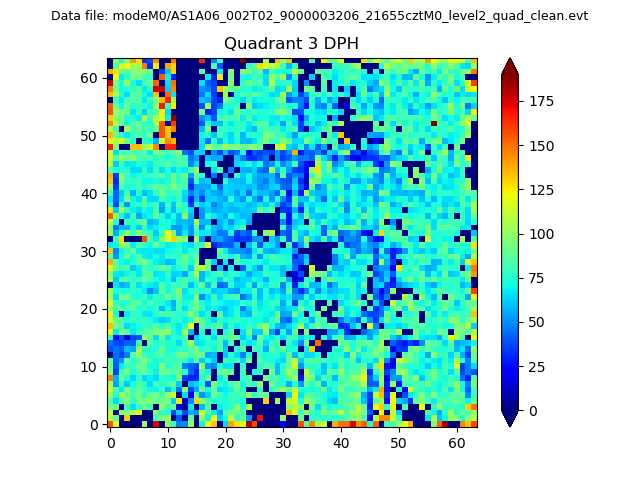 |
 |
Quadrant C |
| Plot type | Count rate plots | Images |
|---|---|---|
| Comparison with Poisson distribution Blue bars denote a histogram of data divided into 1 sec bins. Red curve is a Poisson curve with rate = median count rate of data. |
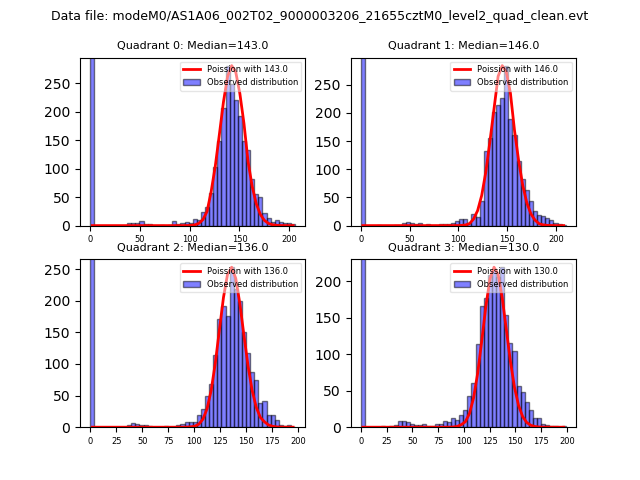 |
 |
| Quadrant-wise count rates Data is divided into 100 sec bins |
 |
|
| Module-wise count rates for Quadrant A Data is divided into 100 sec bins |
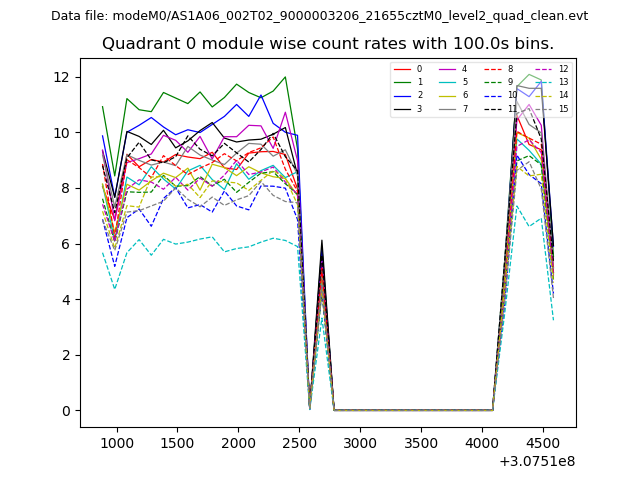 |
 |
| Module-wise count rates for Quadrant B Data is divided into 100 sec bins |
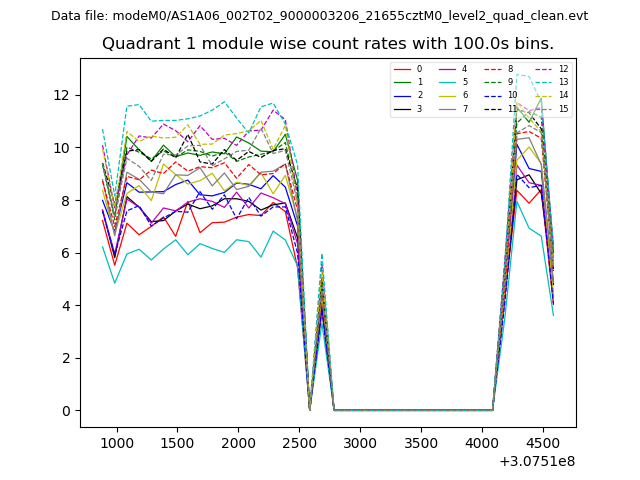 |
 |
| Module-wise count rates for Quadrant C Data is divided into 100 sec bins |
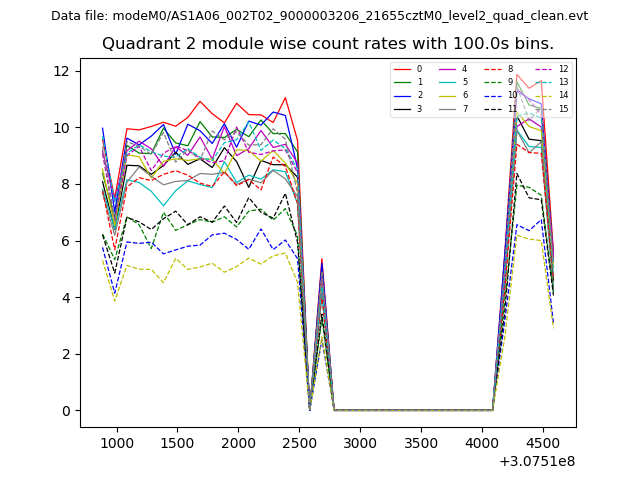 |
 |
| Module-wise count rates for Quadrant D Data is divided into 100 sec bins |
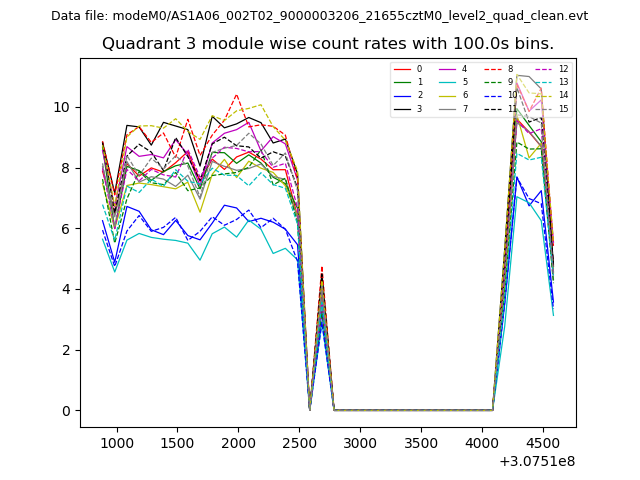 |
 |
| Parameter | Plot |
|---|---|
| CZT HV Monitor | 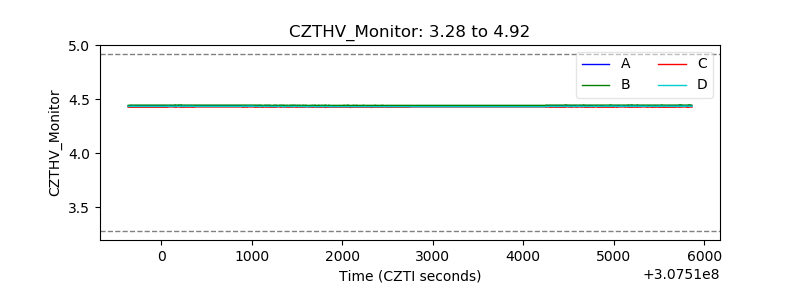 |
| D_VDD | 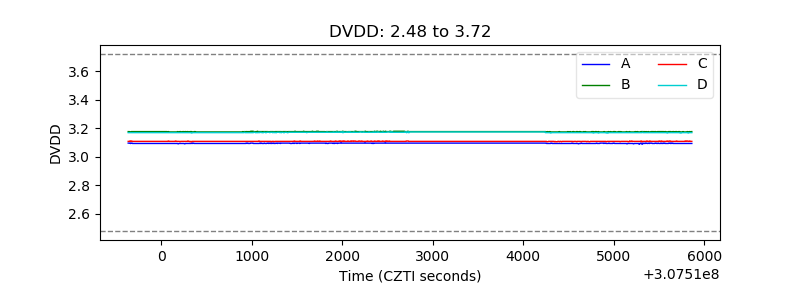 |
| Temperature 1 | 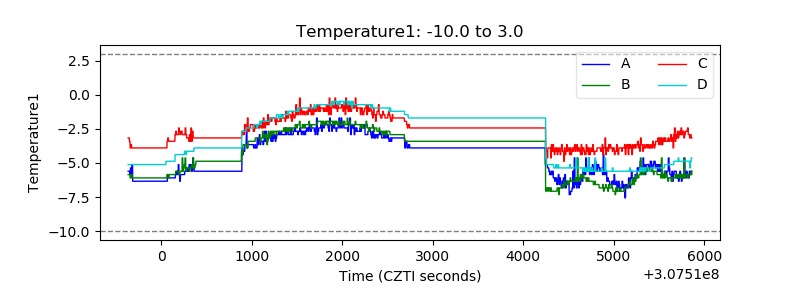 |
| Veto HV Monitor | 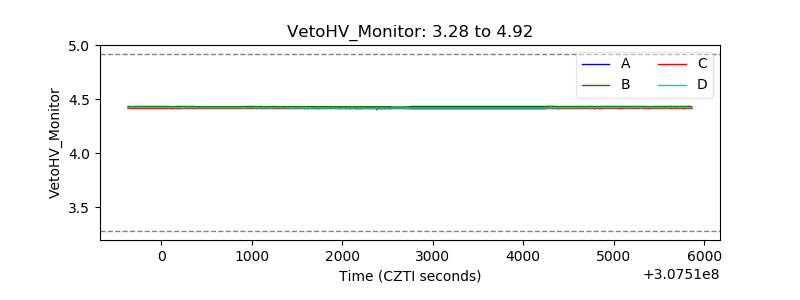 |
| Veto LLD | 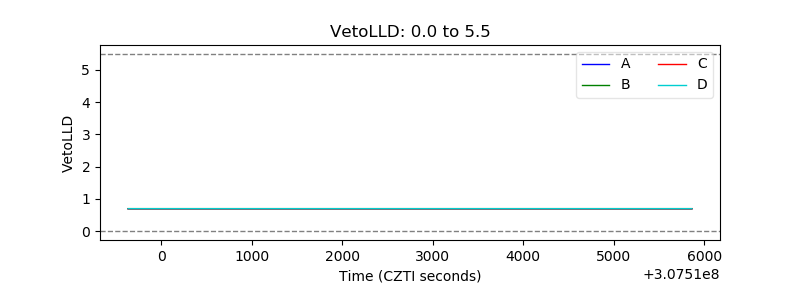 |
| Alpha Counter |  |
| _CPM_Rate | 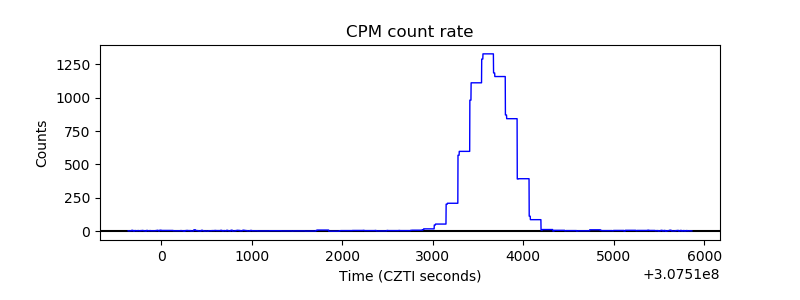 |
| CZT Counter | 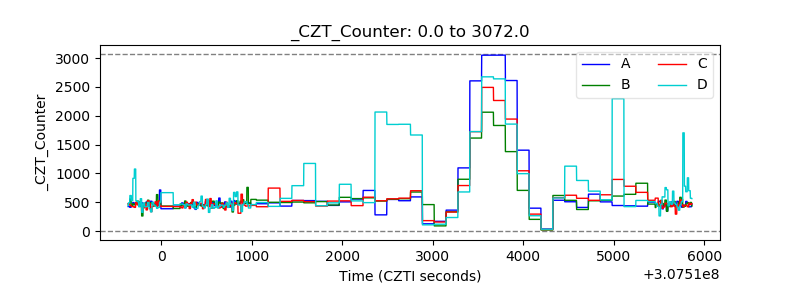 |
| +2.5 Volts monitor |  |
| +5 Volts monitor |  |
| _ROLL_ROT | 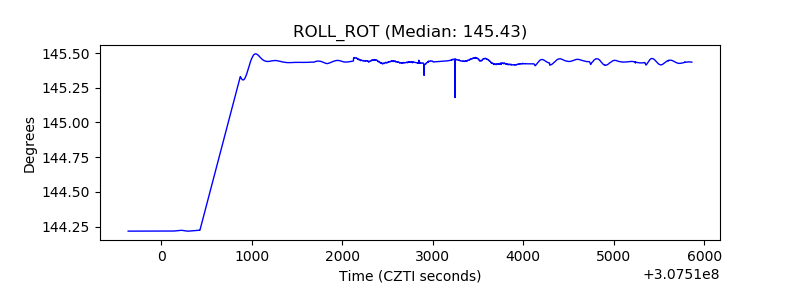 |
| _Roll_DEC | 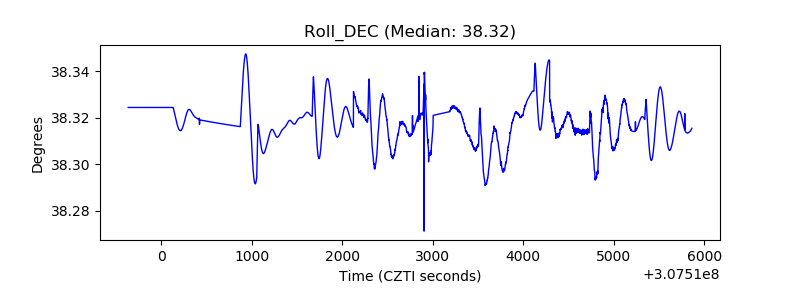 |
| _Roll_RA | 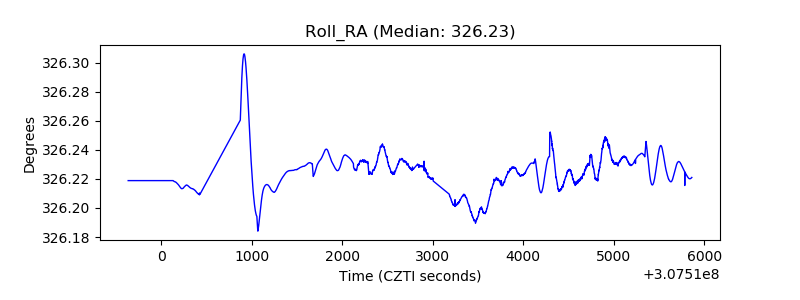 |
| Veto Counter | 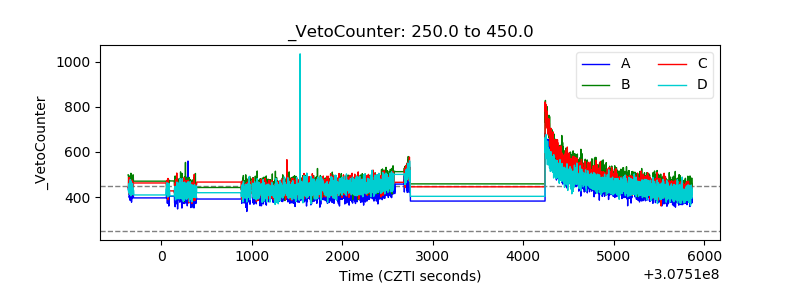 |