| Param | Original file | Final file |
|---|---|---|
| Filename | modeM0/AS1A06_002T02_9000003206_21656cztM0_level2.evt | modeM0/AS1A06_002T02_9000003206_21656cztM0_level2_quad_clean.evt |
| Size (bytes) | 809,766,720 | 118,059,840 |
| Size | 772.3 MB | 112.6 MB |
| Events in quadrant A | 5,182,594 | 733,916 |
| Events in quadrant B | 5,465,083 | 750,186 |
| Events in quadrant C | 5,342,101 | 705,314 |
| Events in quadrant D | 7,827,575 | 662,151 |
| Mode M0 | |||
|---|---|---|---|
| Quadrant | BADHDUFLAG | Total packets | Discarded packets |
| A | 0 | 21649 | 6 |
| B | 0 | 22432 | 7 |
| C | 0 | 22292 | 2 |
| D | 0 | 30237 | 6 |
| Mode M9 | |||
|---|---|---|---|
| Quadrant | BADHDUFLAG | Total packets | Discarded packets |
| A | 0 | 25 | 0 |
| B | 0 | 25 | 0 |
| C | 0 | 25 | 0 |
| D | 0 | 25 | 0 |
| Mode SS | |||
|---|---|---|---|
| Quadrant | BADHDUFLAG | Total packets | Discarded packets |
| A | 0 | 212 | 0 |
| B | 0 | 212 | 0 |
| C | 0 | 212 | 0 |
| D | 0 | 212 | 0 |
| Quadrant | Total seconds | Saturated seconds | Saturation percentage |
|---|---|---|---|
| A | 10449 | 54 | 0.516796% |
| B | 10451 | 116 | 1.109942% |
| C | 10453 | 162 | 1.549794% |
| D | 10450 | 432 | 4.133971% |
Noise dominated data is calculated using 1-second bins in cleaned event files. If a bin has >2000 counts, and if more than 50% of those come from <1% of pixels, then it is considered to be noise-dominated and hence unusable.
| Quadrant | # 1 sec bins | Bins with >0 counts | Bins with >2000 counts | High rate bins dominated by noise | Noise dominated (total time) | Noise dominated (detector-on time) | Marked lightcurve |
|---|---|---|---|---|---|---|---|
| A | 12912 | 10453 | 3 | 3 | 0.02% | 0.03% | 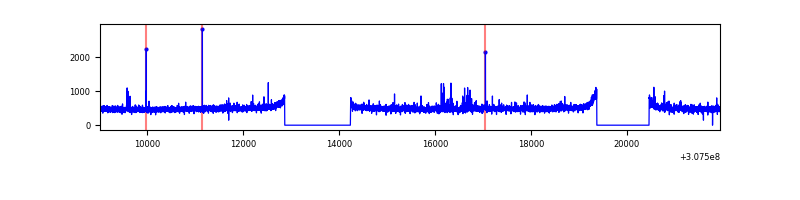 |
| B | 12913 | 10455 | 23 | 23 | 0.18% | 0.22% | 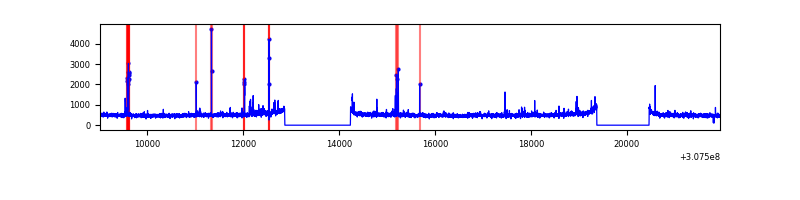 |
| C | 12913 | 10455 | 0 | 0 | 0.00% | 0.00% | 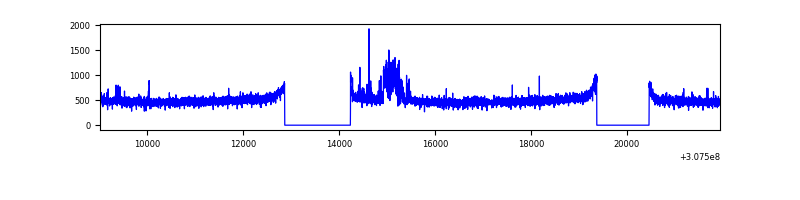 |
| D | 12912 | 10453 | 294 | 294 | 2.28% | 2.81% | 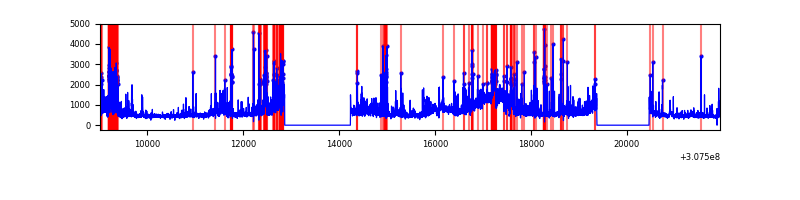 |
Top three noisy pixels from each quadrant. If the there are fewer than three noisy pixels in the level2.evt file, extra rows are filled as -1
| Pixel properties | Quadrant properties | ||||||
|---|---|---|---|---|---|---|---|
| Quadrant | DetID | PixID | Counts | Sigma | Mean | Median | Sigma |
| A | 15 | 236 | 109014 | 412.96 | 1313 | 1288 | 260.9 |
| A | 13 | 170 | 17551 | 62.34 | 1313 | 1288 | 260.9 |
| A | 13 | 254 | 13184 | 45.6 | 1313 | 1288 | 260.9 |
| B | 3 | 64 | 121427 | 483.36 | 1320 | 1286 | 248.6 |
| B | 0 | 229 | 47717 | 186.8 | 1320 | 1286 | 248.6 |
| B | 6 | 36 | 46485 | 181.85 | 1320 | 1286 | 248.6 |
| C | 9 | 54 | 228740 | 783.25 | 1258 | 1265 | 290.4 |
| C | 14 | 238 | 198949 | 680.67 | 1258 | 1265 | 290.4 |
| C | 10 | 22 | 9903 | 29.74 | 1258 | 1265 | 290.4 |
| D | 1 | 20 | 1371939 | 4522.72 | 1249 | 1214 | 303.1 |
| D | 1 | 52 | 1026218 | 3382.01 | 1249 | 1214 | 303.1 |
| D | 7 | 238 | 495622 | 1631.3 | 1249 | 1214 | 303.1 |
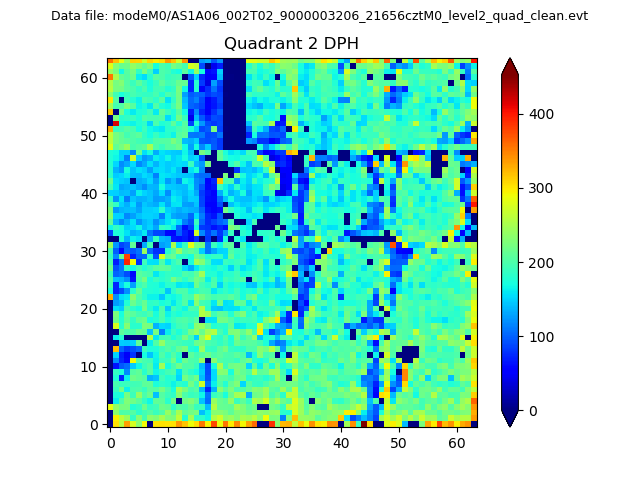
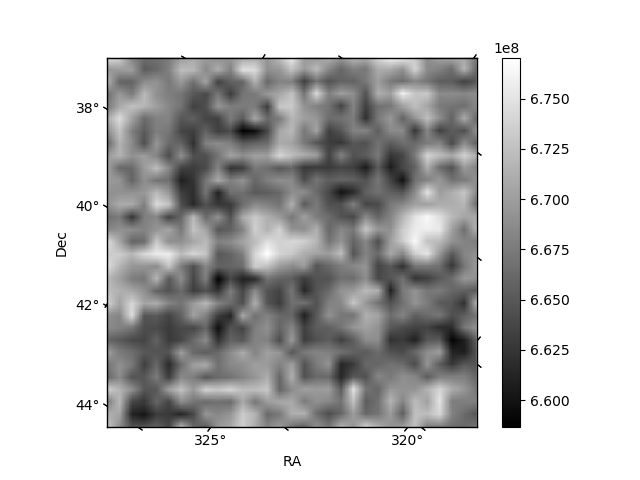
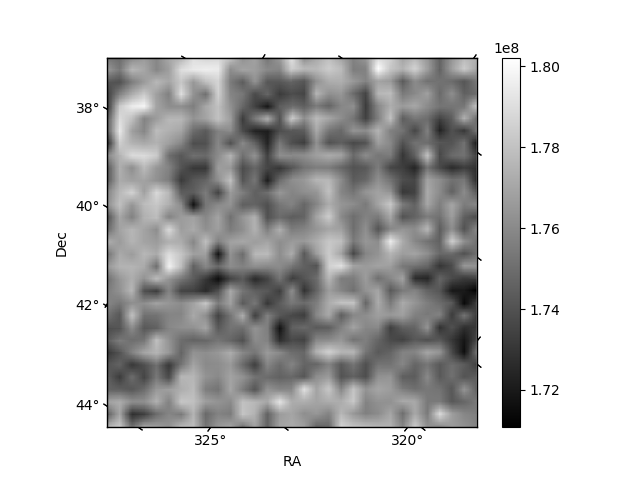
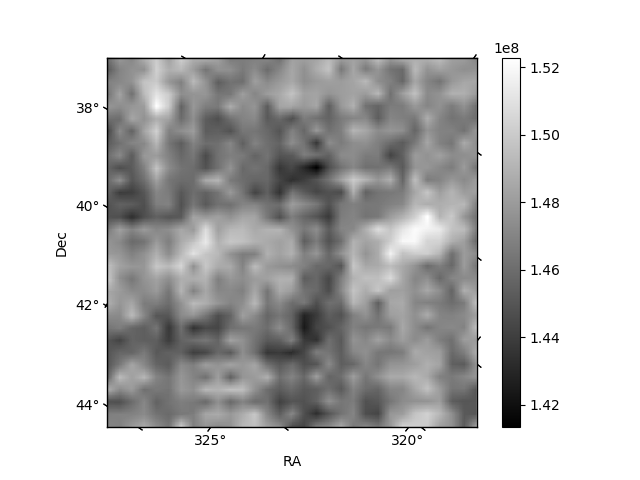
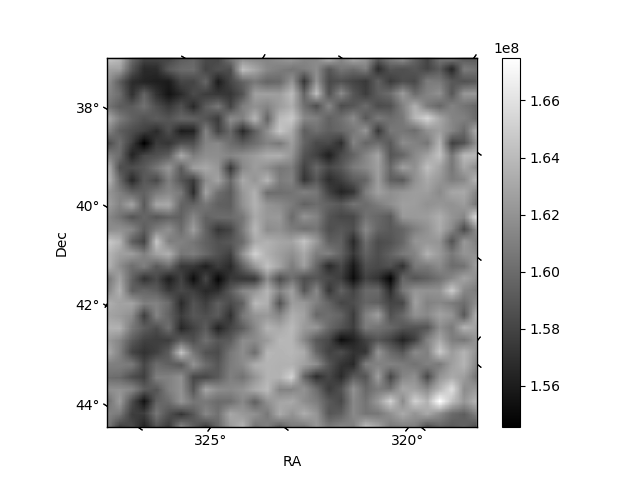
Histogram calculated using DETX and DETY for each event in the final _common_clean file
| Quadrant A | 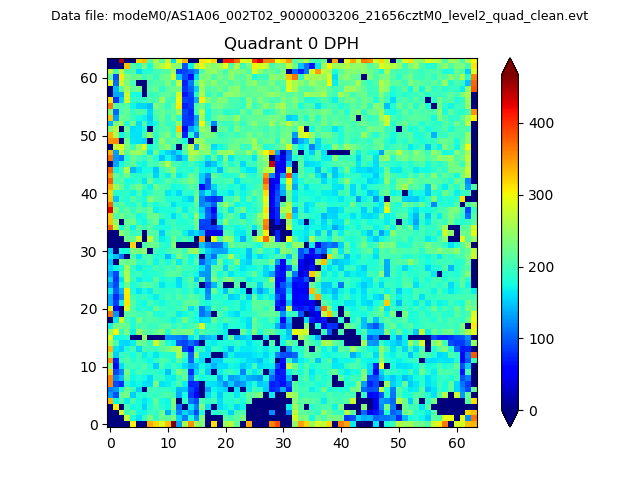 |
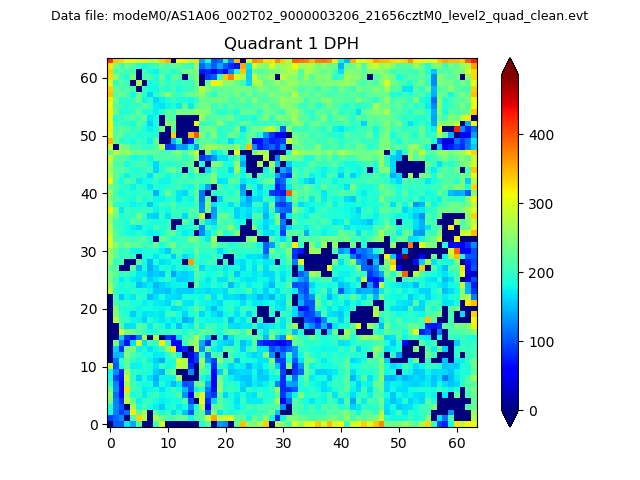 |
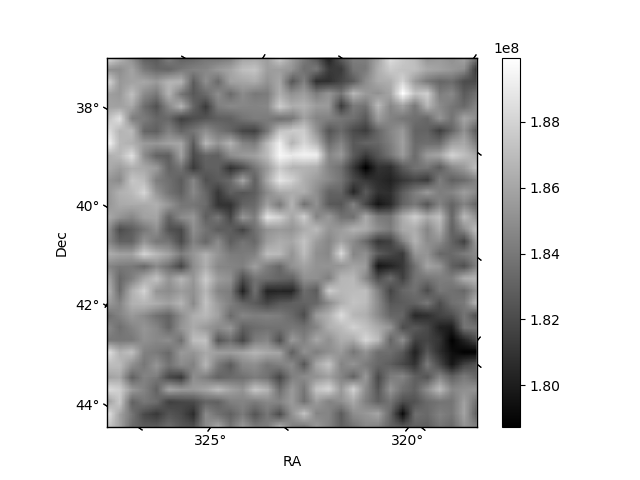
Quadrant B |
|---|---|---|---|
| Quadrant D | 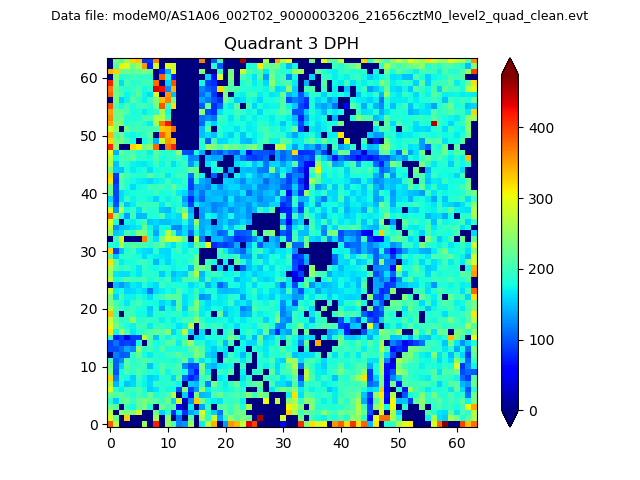 |
 |
Quadrant C |
| Plot type | Count rate plots | Images |
|---|---|---|
| Comparison with Poisson distribution Blue bars denote a histogram of data divided into 1 sec bins. Red curve is a Poisson curve with rate = median count rate of data. |
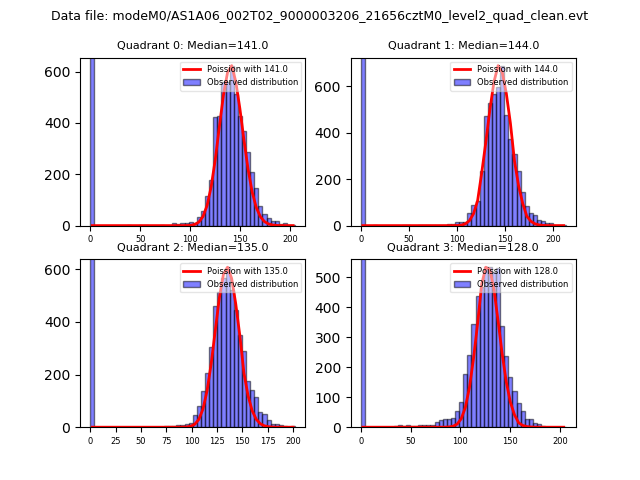 |
 |
| Quadrant-wise count rates Data is divided into 100 sec bins |
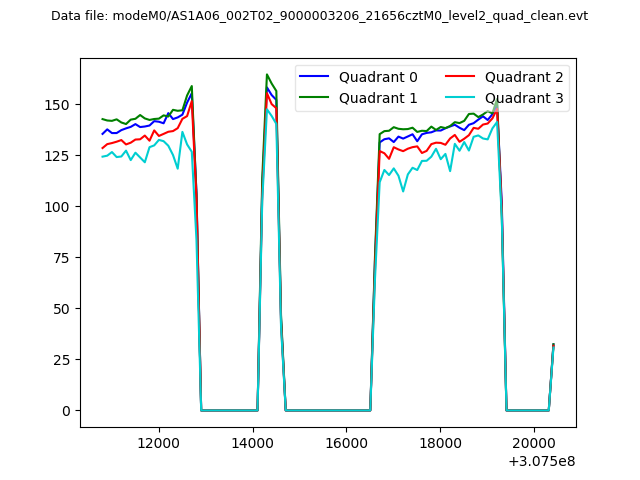 |
|
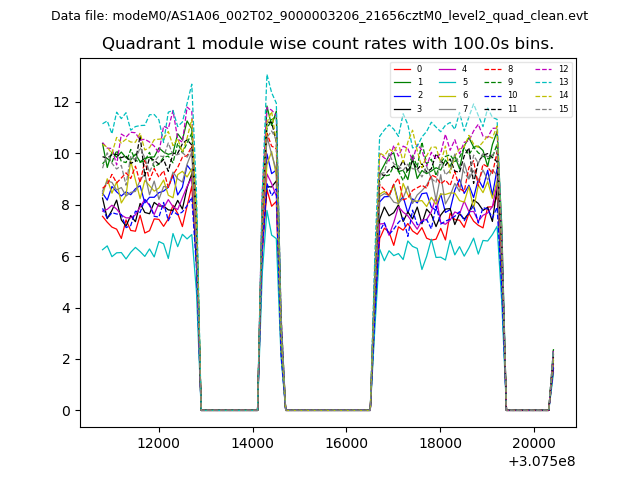
| Module-wise count rates for Quadrant A Data is divided into 100 sec bins |
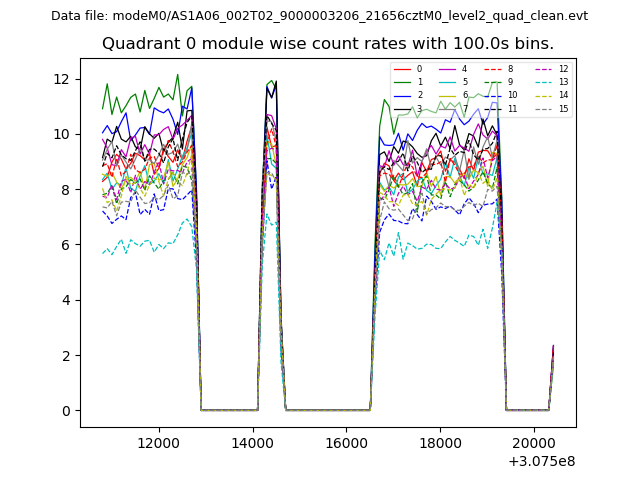 |
 |
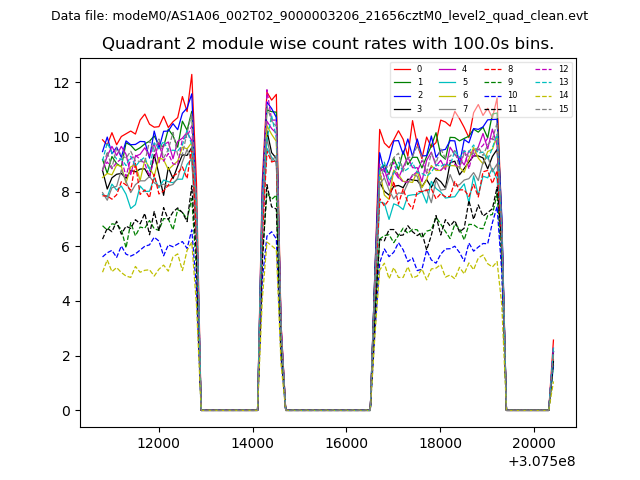
| Module-wise count rates for Quadrant B Data is divided into 100 sec bins |
 |
 |
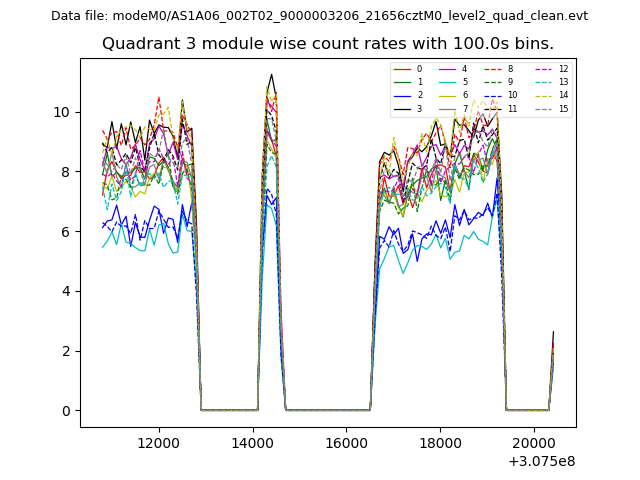
| Module-wise count rates for Quadrant C Data is divided into 100 sec bins |
 |
 |
| Module-wise count rates for Quadrant D Data is divided into 100 sec bins |
 |
 |
| Parameter | Plot |
|---|---|
| CZT HV Monitor | 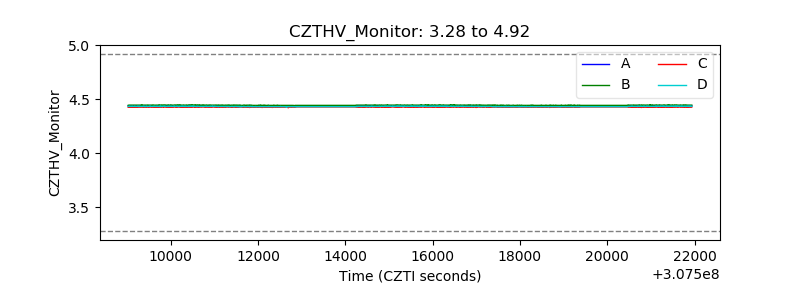 |
| D_VDD | 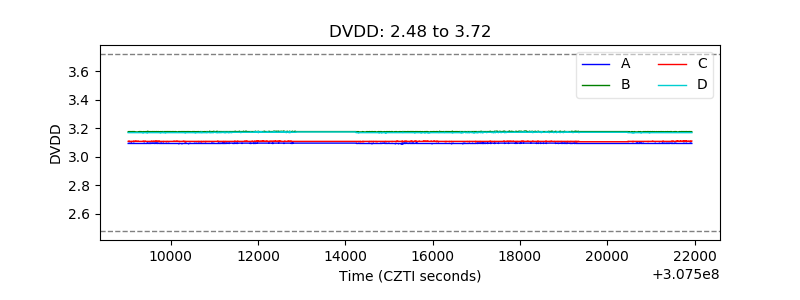 |
| Temperature 1 | 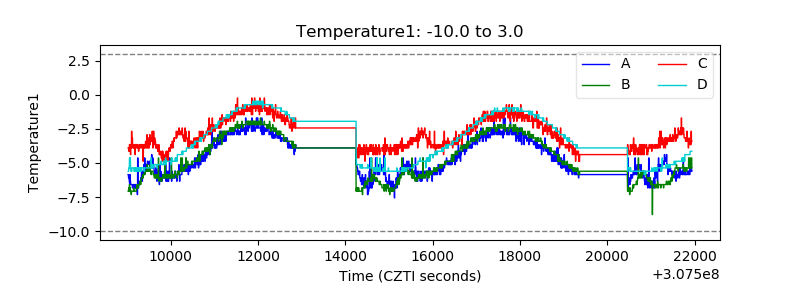 |
| Veto HV Monitor | 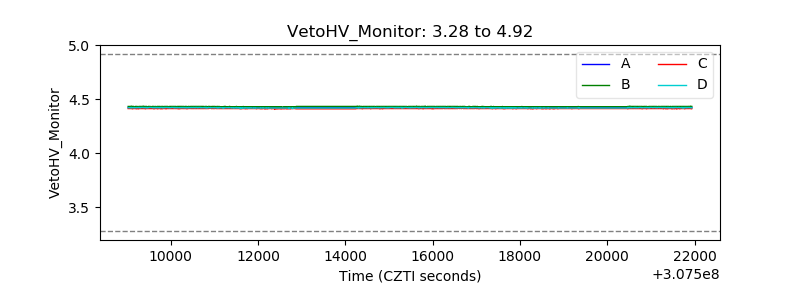 |
| Veto LLD | 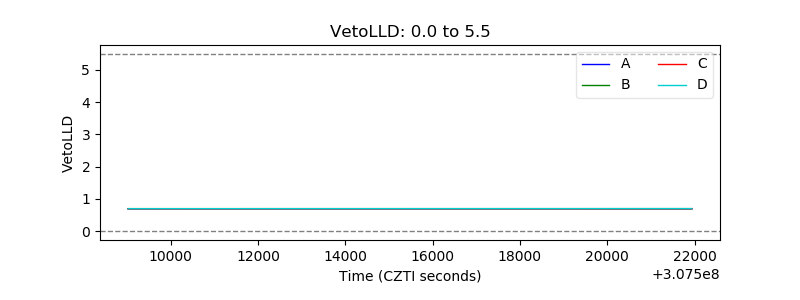 |
| Alpha Counter | 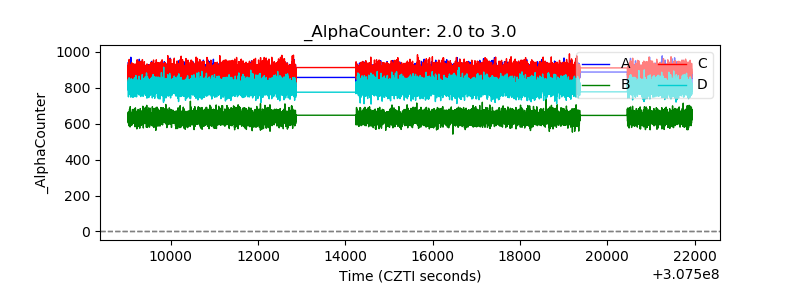 |
| _CPM_Rate | 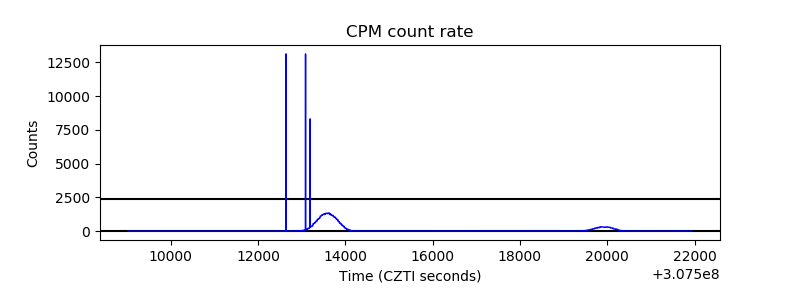 |
| CZT Counter | 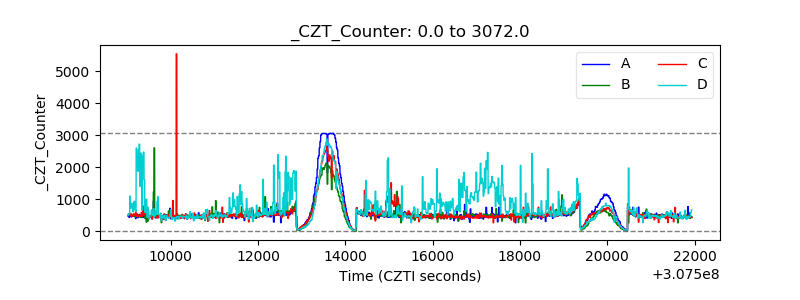 |
| +2.5 Volts monitor | 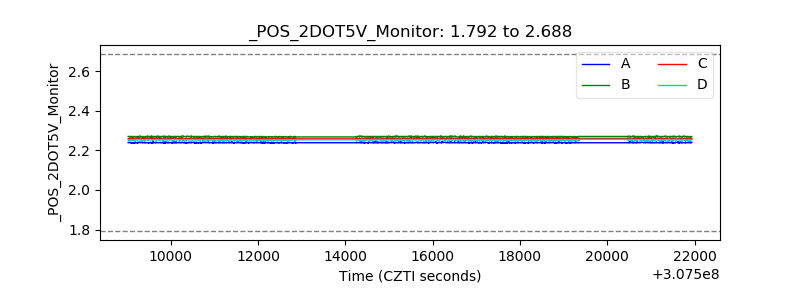 |
| +5 Volts monitor |  |
| _ROLL_ROT | 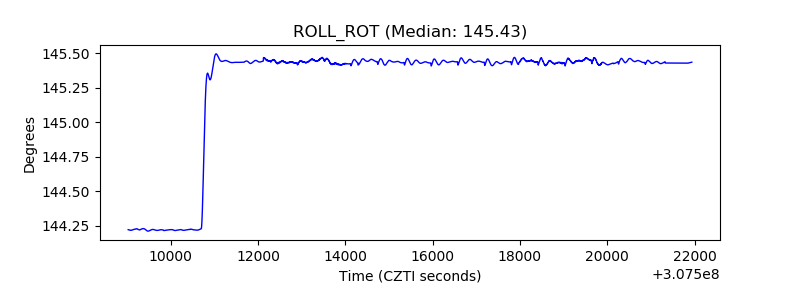 |
| _Roll_DEC | 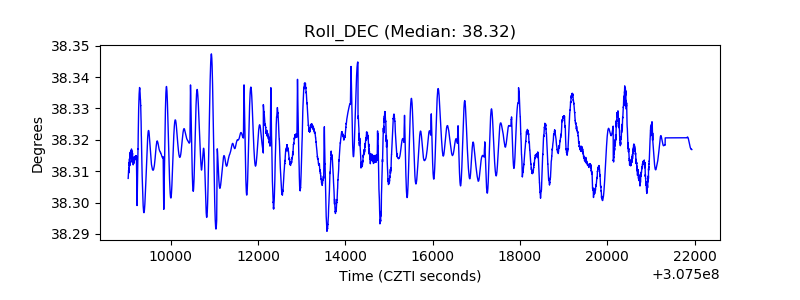 |
| _Roll_RA | 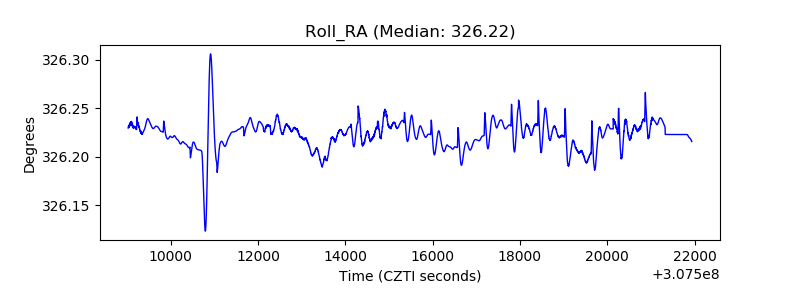 |
| Veto Counter | 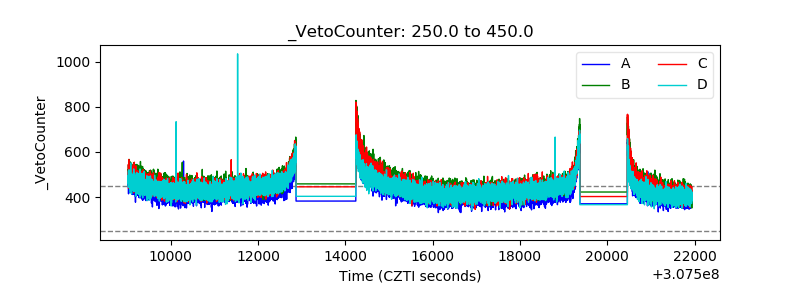 |