| Param | Original file | Final file |
|---|---|---|
| Filename | modeM0/AS1A06_002T02_9000003206_21658cztM0_level2.evt | modeM0/AS1A06_002T02_9000003206_21658cztM0_level2_quad_clean.evt |
| Size (bytes) | 618,840,000 | 108,262,080 |
| Size | 590.2 MB | 103.2 MB |
| Events in quadrant A | 4,231,982 | 677,930 |
| Events in quadrant B | 4,606,296 | 689,982 |
| Events in quadrant C | 4,365,660 | 660,542 |
| Events in quadrant D | 4,937,024 | 636,064 |
| Mode M0 | |||
|---|---|---|---|
| Quadrant | BADHDUFLAG | Total packets | Discarded packets |
| A | 0 | 18354 | 2 |
| B | 0 | 19139 | 2 |
| C | 0 | 18540 | 2 |
| D | 0 | 20430 | 2 |
| Mode M9 | |||
|---|---|---|---|
| Quadrant | BADHDUFLAG | Total packets | Discarded packets |
| A | 0 | 8 | 0 |
| B | 0 | 8 | 0 |
| C | 0 | 8 | 0 |
| D | 0 | 8 | 0 |
| Mode SS | |||
|---|---|---|---|
| Quadrant | BADHDUFLAG | Total packets | Discarded packets |
| A | 0 | 180 | 0 |
| B | 0 | 180 | 0 |
| C | 0 | 180 | 0 |
| D | 0 | 180 | 0 |
| Quadrant | Total seconds | Saturated seconds | Saturation percentage |
|---|---|---|---|
| A | 8851 | 316 | 3.570218% |
| B | 8852 | 399 | 4.507456% |
| C | 8852 | 338 | 3.818346% |
| D | 8852 | 319 | 3.603705% |
Noise dominated data is calculated using 1-second bins in cleaned event files. If a bin has >2000 counts, and if more than 50% of those come from <1% of pixels, then it is considered to be noise-dominated and hence unusable.
| Quadrant | # 1 sec bins | Bins with >0 counts | Bins with >2000 counts | High rate bins dominated by noise | Noise dominated (total time) | Noise dominated (detector-on time) | Marked lightcurve |
|---|---|---|---|---|---|---|---|
| A | 9641 | 8854 | 0 | 0 | 0.00% | 0.00% | 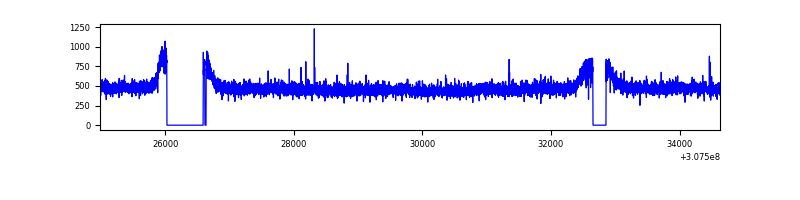 |
| B | 9642 | 8855 | 21 | 21 | 0.22% | 0.24% | 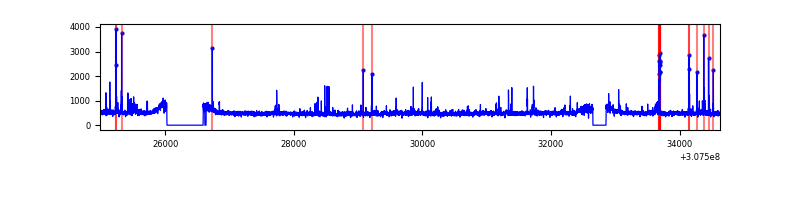 |
| C | 9642 | 8855 | 1 | 1 | 0.01% | 0.01% | 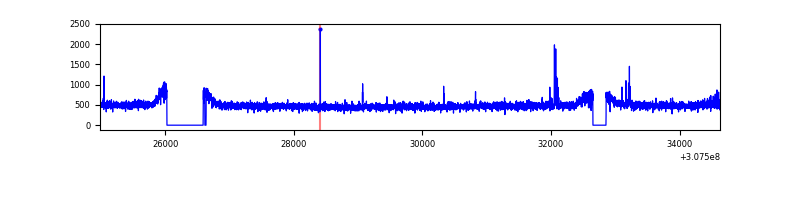 |
| D | 9642 | 8855 | 65 | 65 | 0.67% | 0.73% | 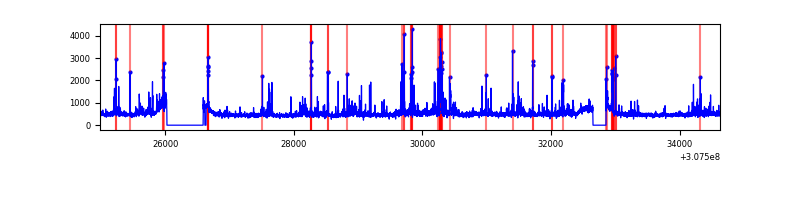 |
Top three noisy pixels from each quadrant. If the there are fewer than three noisy pixels in the level2.evt file, extra rows are filled as -1
| Pixel properties | Quadrant properties | ||||||
|---|---|---|---|---|---|---|---|
| Quadrant | DetID | PixID | Counts | Sigma | Mean | Median | Sigma |
| A | 15 | 236 | 12590 | 51.66 | 1095 | 1068 | 223.0 |
| A | 13 | 254 | 10680 | 43.1 | 1095 | 1068 | 223.0 |
| A | 3 | 137 | 9500 | 37.81 | 1095 | 1068 | 223.0 |
| B | 3 | 64 | 154769 | 727.2 | 1093 | 1063 | 211.4 |
| B | 0 | 230 | 39742 | 183.0 | 1093 | 1063 | 211.4 |
| B | 6 | 36 | 32597 | 149.19 | 1093 | 1063 | 211.4 |
| C | 14 | 238 | 163826 | 655.49 | 1054 | 1057 | 248.3 |
| C | 10 | 22 | 44828 | 176.27 | 1054 | 1057 | 248.3 |
| C | 9 | 54 | 40593 | 159.22 | 1054 | 1057 | 248.3 |
| D | 1 | 52 | 391987 | 1515.31 | 1058 | 1023 | 258.0 |
| D | 7 | 238 | 215798 | 832.43 | 1058 | 1023 | 258.0 |
| D | 2 | 136 | 133301 | 512.69 | 1058 | 1023 | 258.0 |
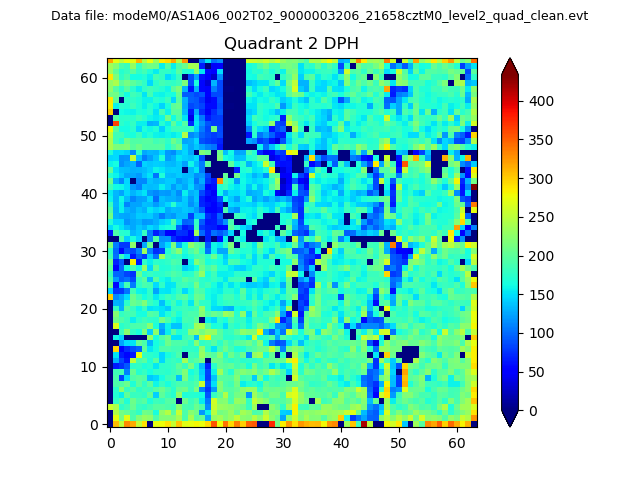
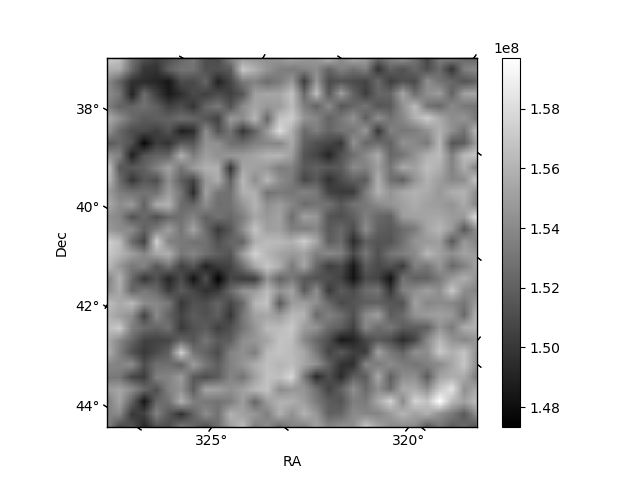
Histogram calculated using DETX and DETY for each event in the final _common_clean file
| Quadrant A | 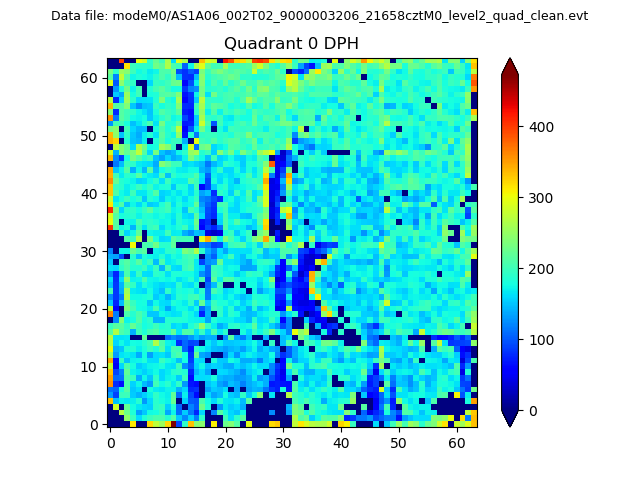 |
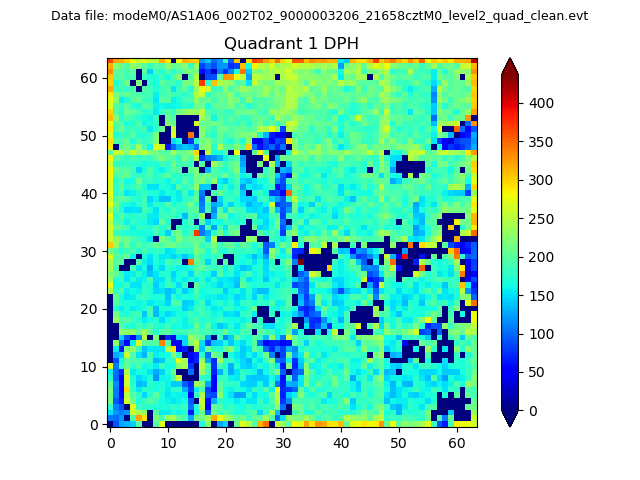 |
Quadrant B |
|---|---|---|---|
| Quadrant D | 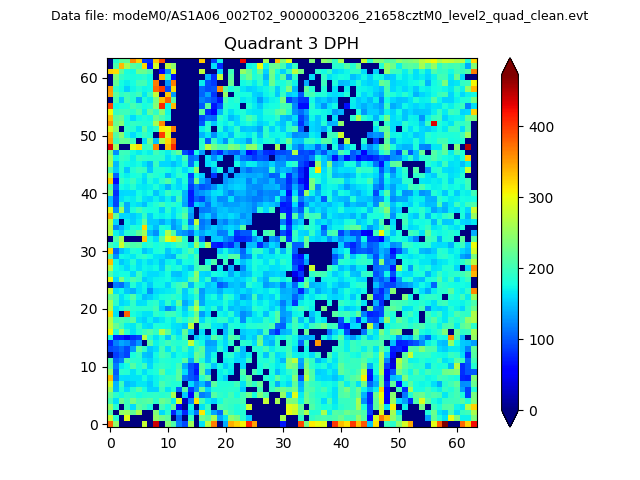 |
 |
Quadrant C |
| Plot type | Count rate plots | Images |
|---|---|---|
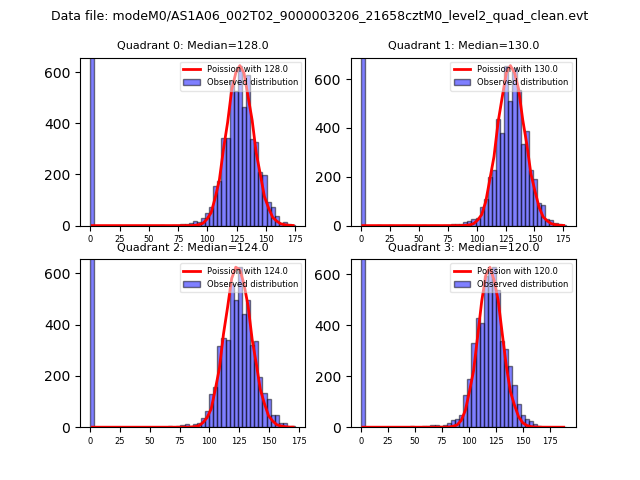
| Comparison with Poisson distribution Blue bars denote a histogram of data divided into 1 sec bins. Red curve is a Poisson curve with rate = median count rate of data. |
 |
 |
| Quadrant-wise count rates Data is divided into 100 sec bins |
 |
|
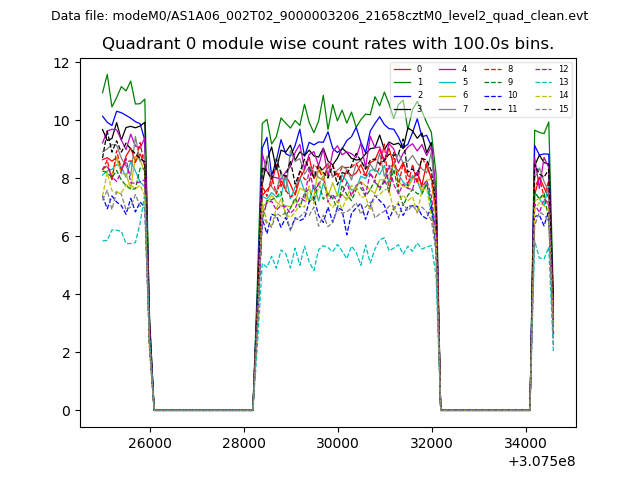
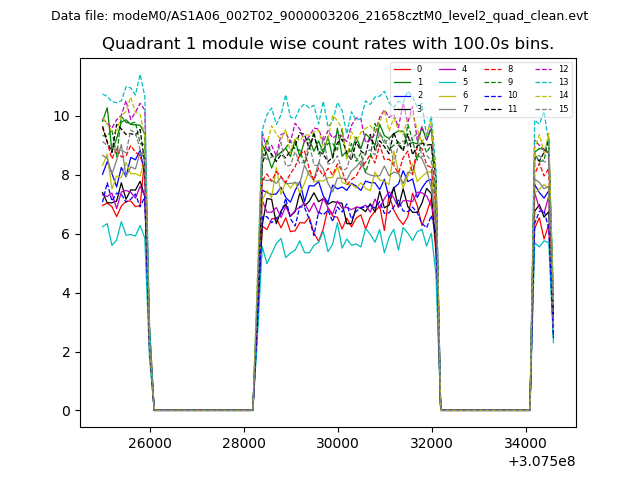
| Module-wise count rates for Quadrant A Data is divided into 100 sec bins |
 |
 |
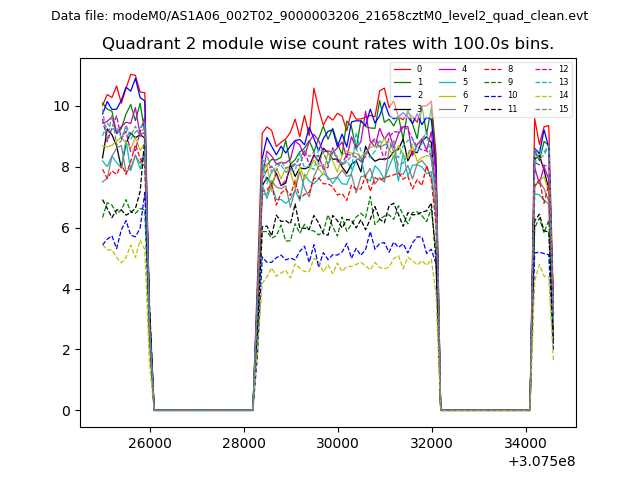
| Module-wise count rates for Quadrant B Data is divided into 100 sec bins |
 |
 |
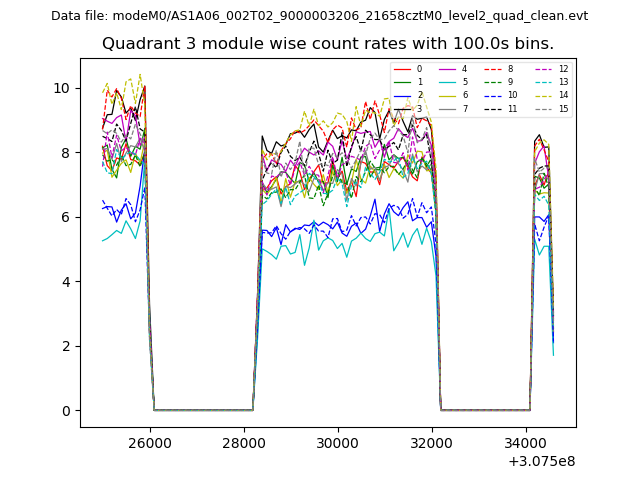
| Module-wise count rates for Quadrant C Data is divided into 100 sec bins |
 |
 |
| Module-wise count rates for Quadrant D Data is divided into 100 sec bins |
 |
 |
| Parameter | Plot |
|---|---|
| CZT HV Monitor | 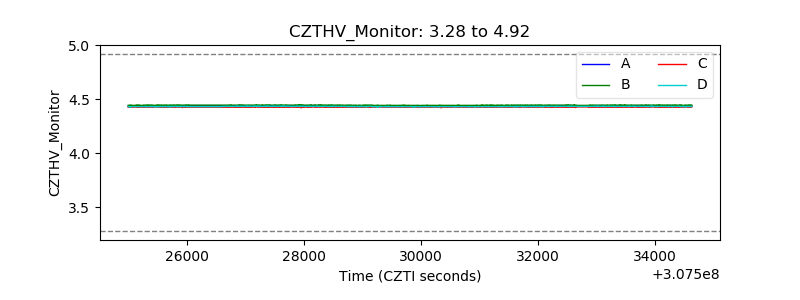 |
| D_VDD | 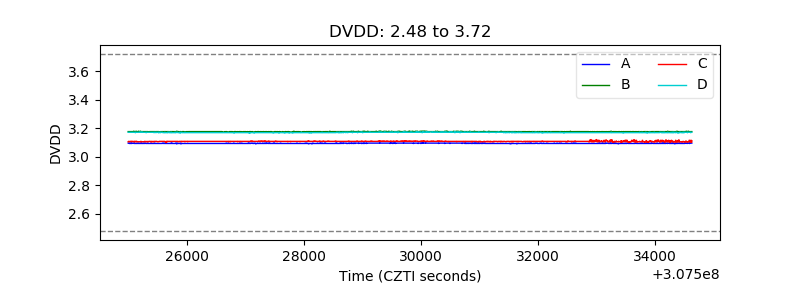 |
| Temperature 1 | 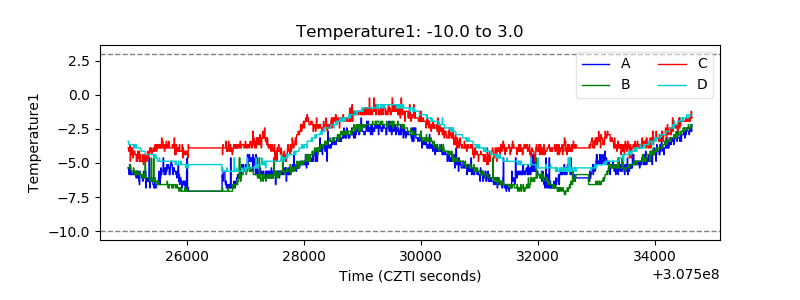 |
| Veto HV Monitor |  |
| Veto LLD | 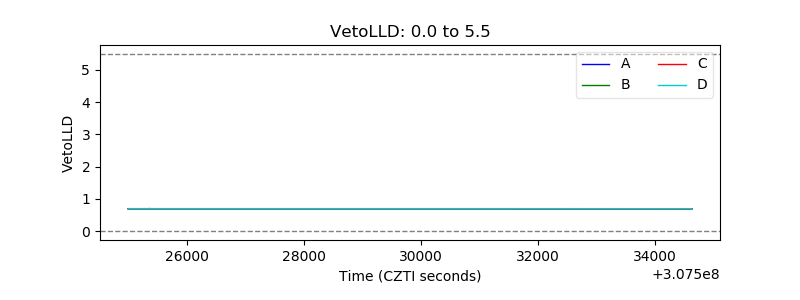 |
| Alpha Counter | 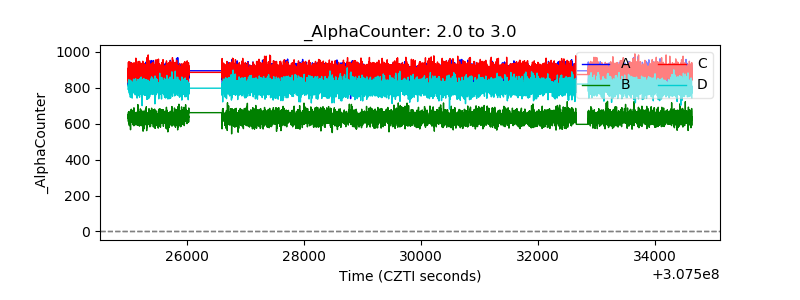 |
| _CPM_Rate | 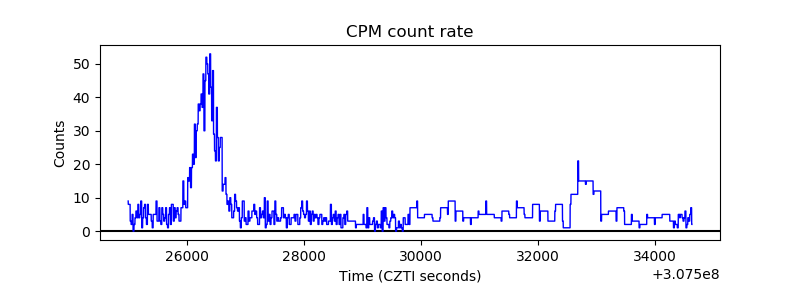 |
| CZT Counter | 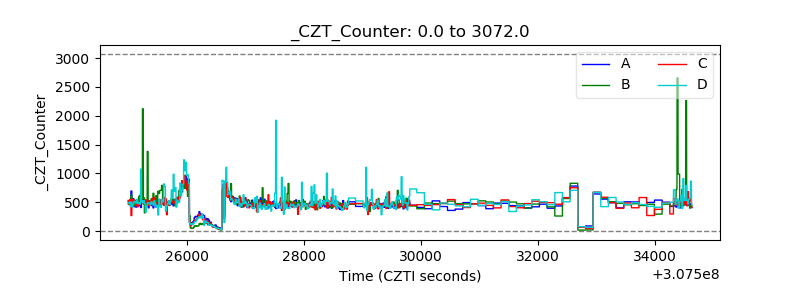 |
| +2.5 Volts monitor |  |
| +5 Volts monitor |  |
| _ROLL_ROT | 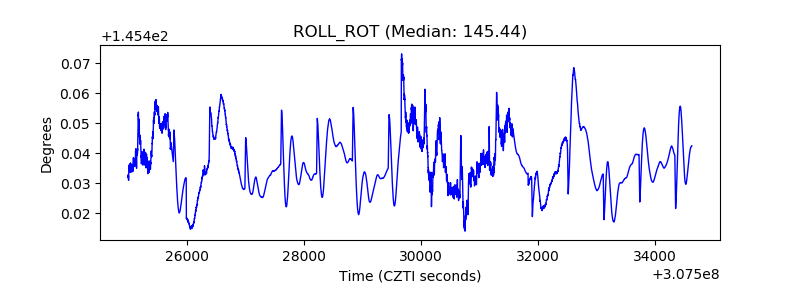 |
| _Roll_DEC | 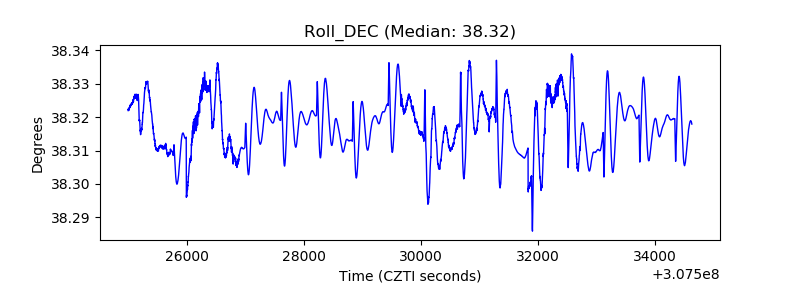 |
| _Roll_RA | 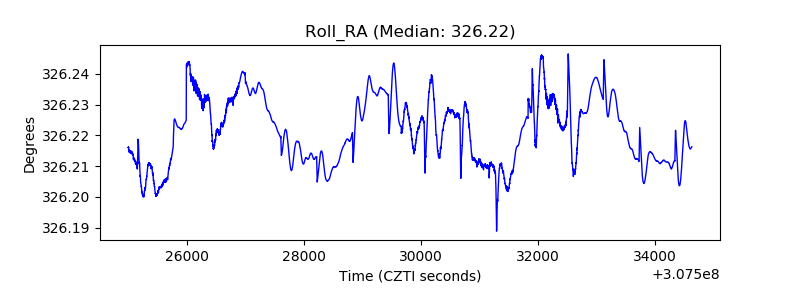 |
| Veto Counter | 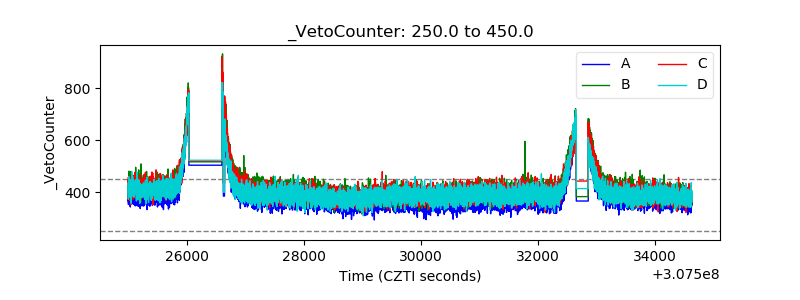 |