| Param | Original file | Final file |
|---|---|---|
| Filename | modeM0/AS1A06_002T02_9000003206_21659cztM0_level2.evt | modeM0/AS1A06_002T02_9000003206_21659cztM0_level2_quad_clean.evt |
| Size (bytes) | 575,066,880 | 92,626,560 |
| Size | 548.4 MB | 88.3 MB |
| Events in quadrant A | 3,753,450 | 578,359 |
| Events in quadrant B | 4,063,242 | 587,633 |
| Events in quadrant C | 3,896,204 | 559,527 |
| Events in quadrant D | 5,166,329 | 529,604 |
| Mode M0 | |||
|---|---|---|---|
| Quadrant | BADHDUFLAG | Total packets | Discarded packets |
| A | 0 | 16347 | 2 |
| B | 0 | 17020 | 2 |
| C | 0 | 16534 | 2 |
| D | 0 | 20550 | 2 |
| Mode M9 | |||
|---|---|---|---|
| Quadrant | BADHDUFLAG | Total packets | Discarded packets |
| A | 0 | 3 | 0 |
| B | 0 | 3 | 0 |
| C | 0 | 3 | 0 |
| D | 0 | 3 | 0 |
| Mode SS | |||
|---|---|---|---|
| Quadrant | BADHDUFLAG | Total packets | Discarded packets |
| A | 0 | 162 | 0 |
| B | 0 | 162 | 0 |
| C | 0 | 162 | 0 |
| D | 0 | 162 | 0 |
| Quadrant | Total seconds | Saturated seconds | Saturation percentage |
|---|---|---|---|
| A | 7906 | 256 | 3.238047% |
| B | 7906 | 319 | 4.034910% |
| C | 7907 | 277 | 3.503225% |
| D | 7907 | 441 | 5.577337% |
Noise dominated data is calculated using 1-second bins in cleaned event files. If a bin has >2000 counts, and if more than 50% of those come from <1% of pixels, then it is considered to be noise-dominated and hence unusable.
| Quadrant | # 1 sec bins | Bins with >0 counts | Bins with >2000 counts | High rate bins dominated by noise | Noise dominated (total time) | Noise dominated (detector-on time) | Marked lightcurve |
|---|---|---|---|---|---|---|---|
| A | 8246 | 7909 | 0 | 0 | 0.00% | 0.00% | 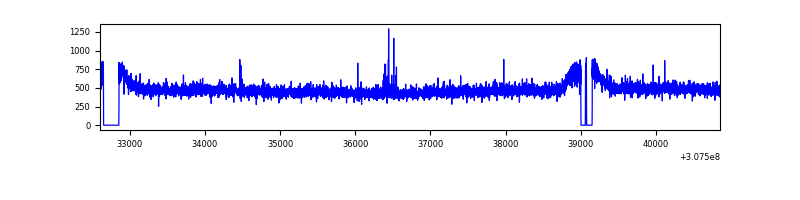 |
| B | 8246 | 7909 | 26 | 26 | 0.32% | 0.33% | 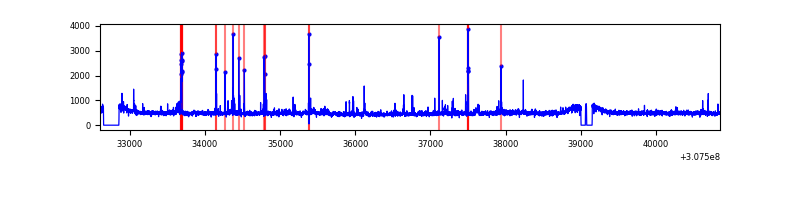 |
| C | 8247 | 7910 | 0 | 0 | 0.00% | 0.00% | 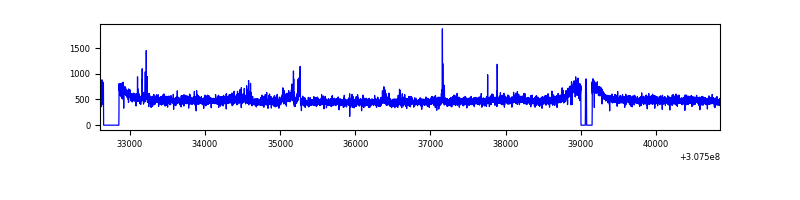 |
| D | 8247 | 7910 | 213 | 213 | 2.58% | 2.69% | 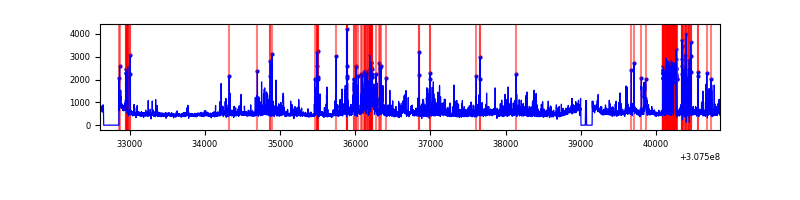 |
Top three noisy pixels from each quadrant. If the there are fewer than three noisy pixels in the level2.evt file, extra rows are filled as -1
| Pixel properties | Quadrant properties | ||||||
|---|---|---|---|---|---|---|---|
| Quadrant | DetID | PixID | Counts | Sigma | Mean | Median | Sigma |
| A | 15 | 236 | 20735 | 100.83 | 969 | 946 | 196.3 |
| A | 13 | 254 | 10428 | 48.31 | 969 | 946 | 196.3 |
| A | 3 | 137 | 8599 | 39.0 | 969 | 946 | 196.3 |
| B | 3 | 64 | 163574 | 874.91 | 965 | 938 | 185.9 |
| B | 0 | 230 | 32260 | 168.5 | 965 | 938 | 185.9 |
| B | 4 | 171 | 23983 | 123.97 | 965 | 938 | 185.9 |
| C | 14 | 238 | 146103 | 666.23 | 928 | 933 | 217.9 |
| C | 9 | 54 | 75244 | 341.03 | 928 | 933 | 217.9 |
| C | 10 | 22 | 21474 | 94.27 | 928 | 933 | 217.9 |
| D | 1 | 52 | 659510 | 2918.88 | 927 | 896 | 225.6 |
| D | 7 | 238 | 328617 | 1452.41 | 927 | 896 | 225.6 |
| D | 13 | 174 | 217291 | 959.03 | 927 | 896 | 225.6 |
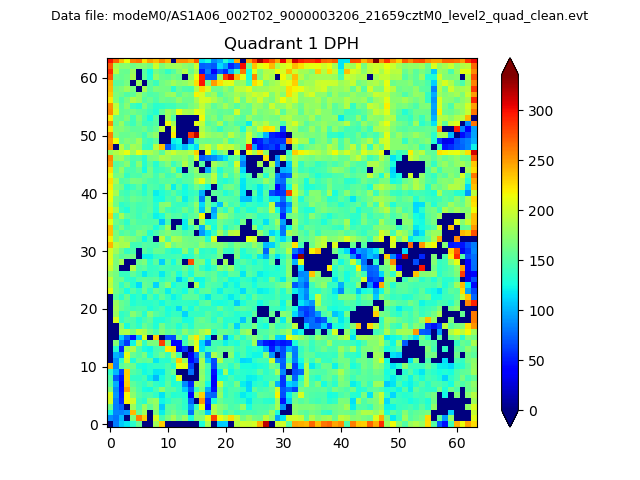
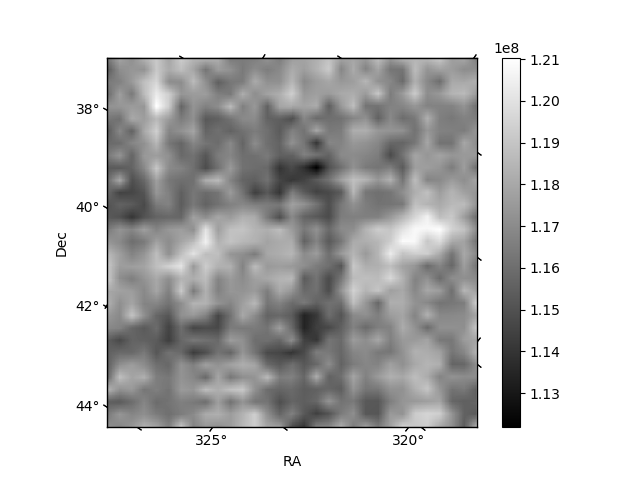
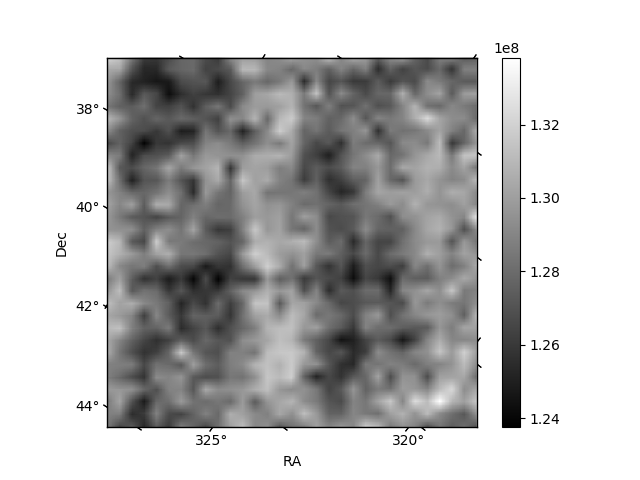
Histogram calculated using DETX and DETY for each event in the final _common_clean file
| Quadrant A |  |
 |
Quadrant B |
|---|---|---|---|
| Quadrant D | 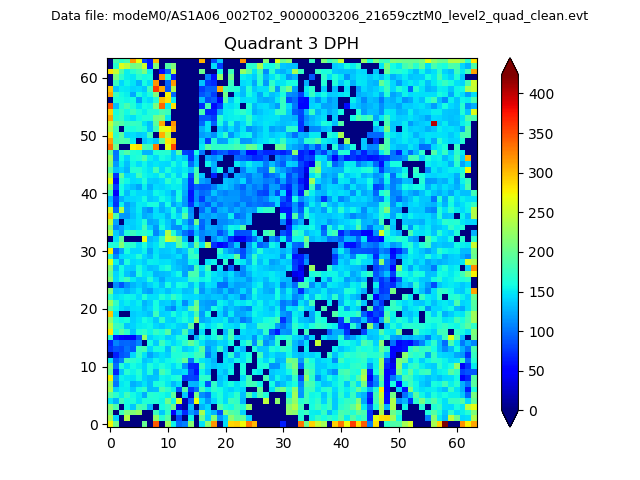 |
 |
Quadrant C |
| Plot type | Count rate plots | Images |
|---|---|---|
| Comparison with Poisson distribution Blue bars denote a histogram of data divided into 1 sec bins. Red curve is a Poisson curve with rate = median count rate of data. |
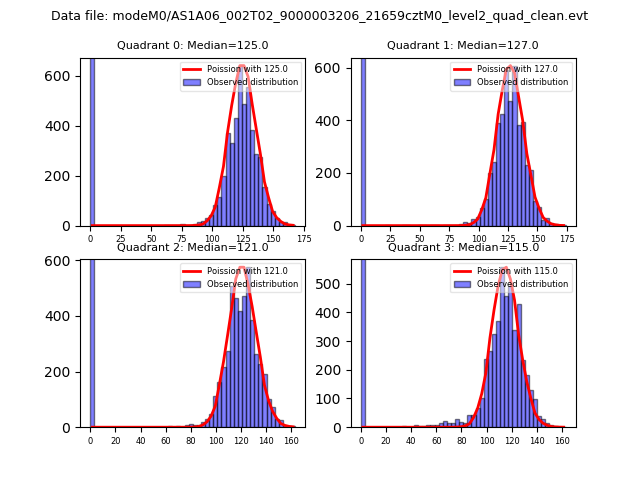 |
 |
| Quadrant-wise count rates Data is divided into 100 sec bins |
 |
|
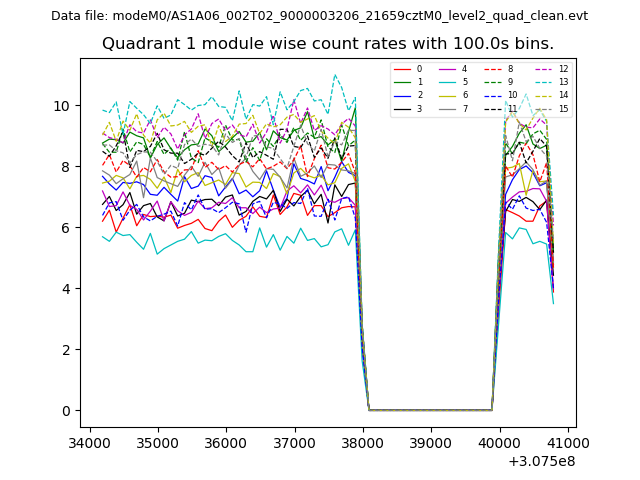
| Module-wise count rates for Quadrant A Data is divided into 100 sec bins |
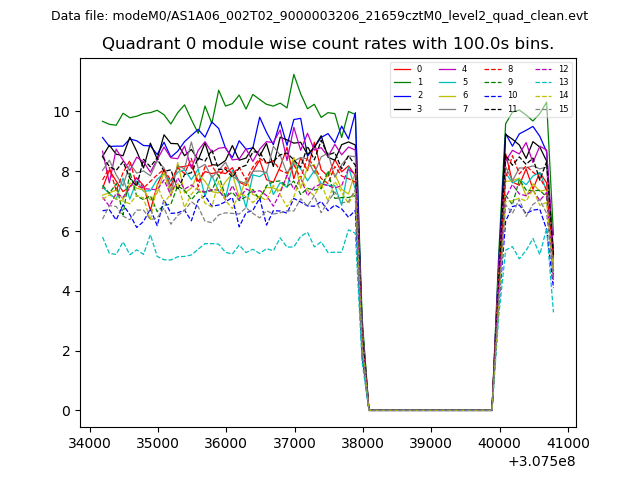 |
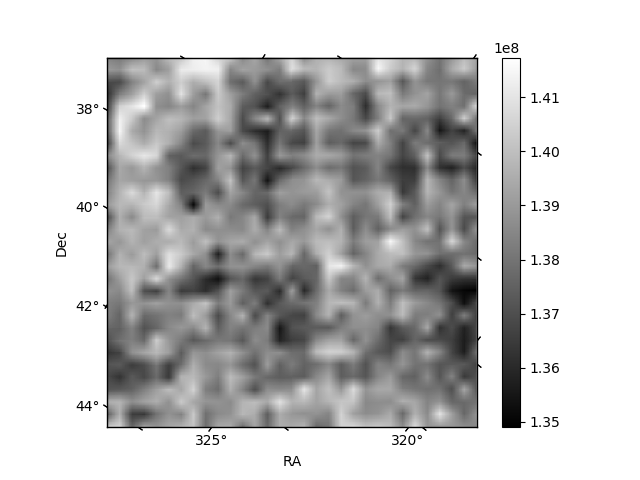 |
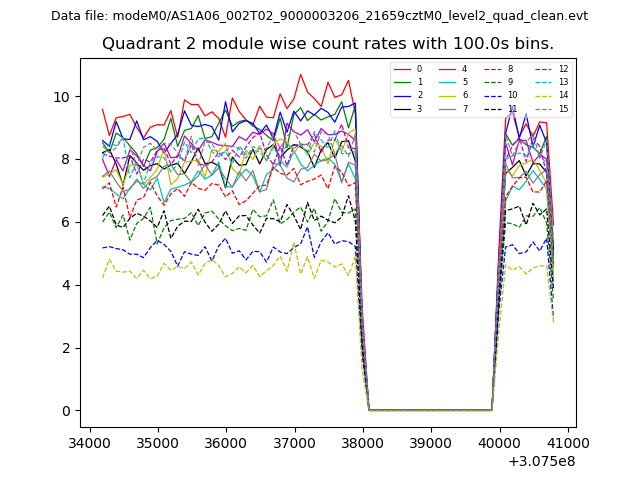
| Module-wise count rates for Quadrant B Data is divided into 100 sec bins |
 |
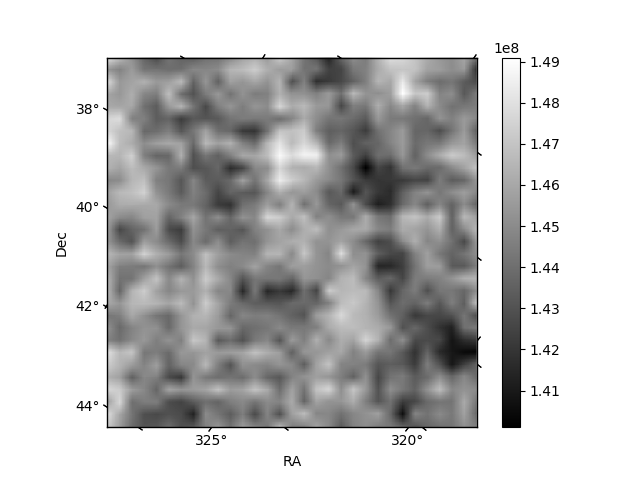 |
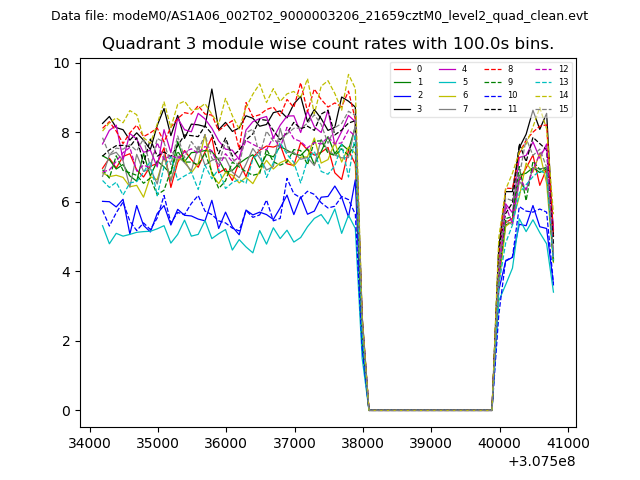
| Module-wise count rates for Quadrant C Data is divided into 100 sec bins |
 |
 |
| Module-wise count rates for Quadrant D Data is divided into 100 sec bins |
 |
 |
| Parameter | Plot |
|---|---|
| CZT HV Monitor | 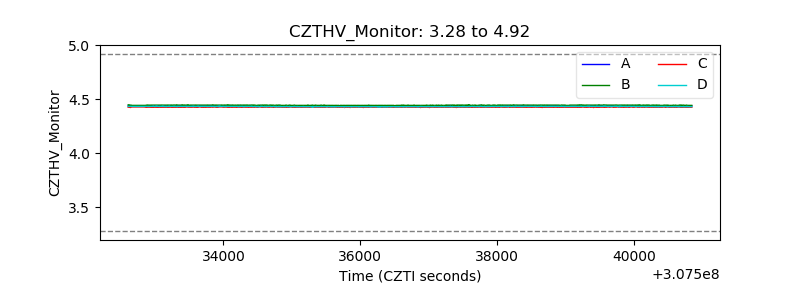 |
| D_VDD | 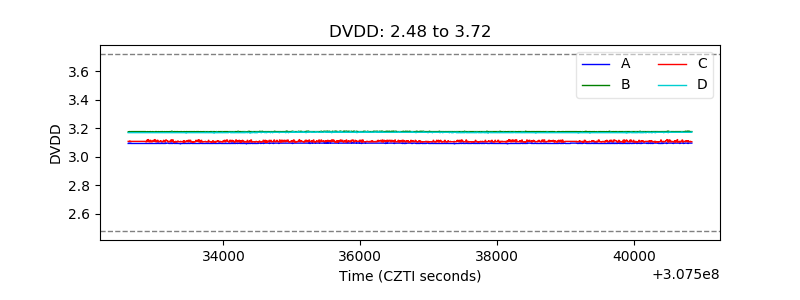 |
| Temperature 1 | 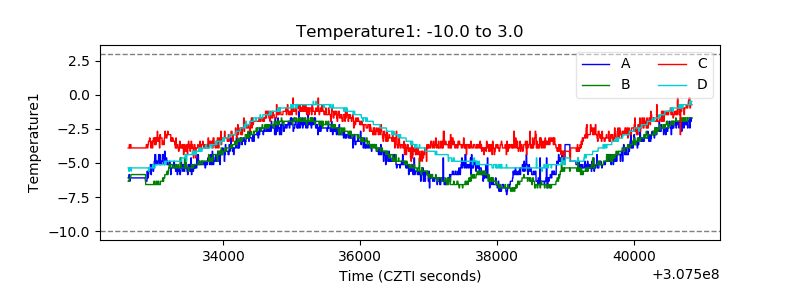 |
| Veto HV Monitor | 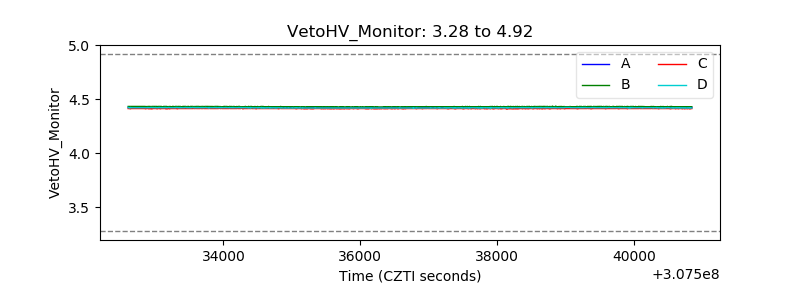 |
| Veto LLD | 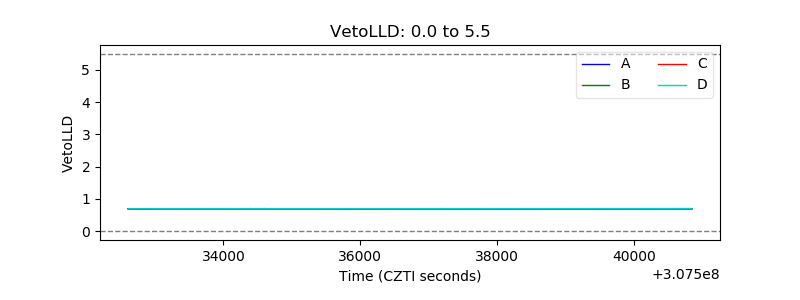 |
| Alpha Counter |  |
| _CPM_Rate | 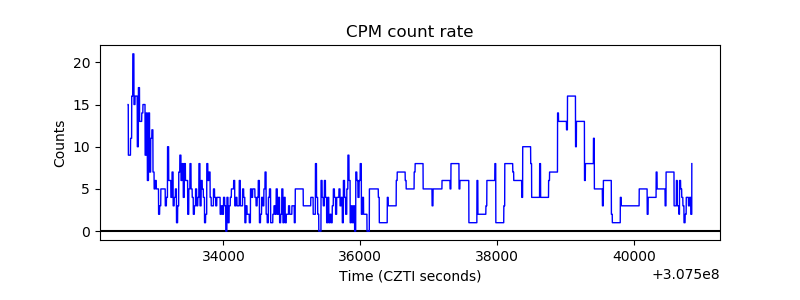 |
| CZT Counter | 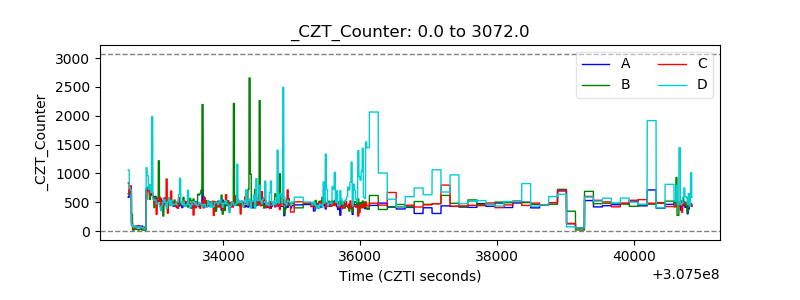 |
| +2.5 Volts monitor |  |
| +5 Volts monitor |  |
| _ROLL_ROT | 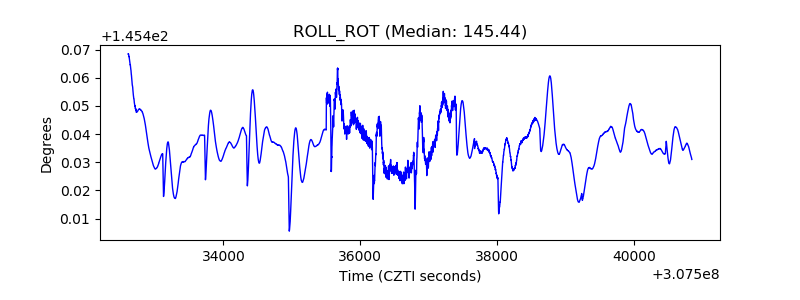 |
| _Roll_DEC | 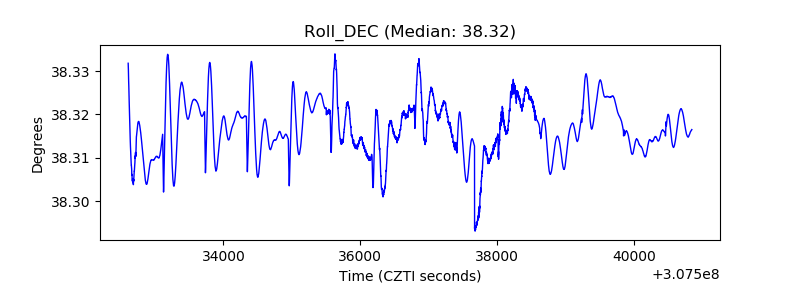 |
| _Roll_RA |  |
| Veto Counter | 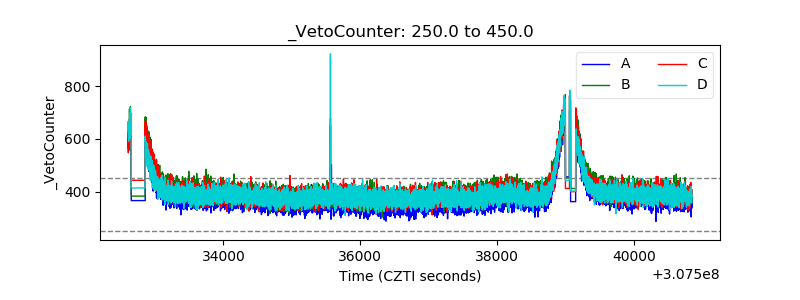 |