| Param | Original file | Final file |
|---|---|---|
| Filename | modeM0/AS1A06_002T02_9000003206_21662cztM0_level2.evt | modeM0/AS1A06_002T02_9000003206_21662cztM0_level2_quad_clean.evt |
| Size (bytes) | 1,535,840,640 | 246,340,800 |
| Size | 1.4 GB | 234.9 MB |
| Events in quadrant A | 9,026,023 | 1,592,216 |
| Events in quadrant B | 10,016,333 | 1,614,671 |
| Events in quadrant C | 9,099,250 | 1,546,199 |
| Events in quadrant D | 17,089,917 | 1,399,682 |
| Mode M0 | |||
|---|---|---|---|
| Quadrant | BADHDUFLAG | Total packets | Discarded packets |
| A | 0 | 39545 | 4 |
| B | 0 | 41929 | 4 |
| C | 0 | 39251 | 4 |
| D | 0 | 63552 | 4 |
| Mode M9 | |||
|---|---|---|---|
| Quadrant | BADHDUFLAG | Total packets | Discarded packets |
| A | 0 | 19 | 0 |
| B | 0 | 19 | 0 |
| C | 0 | 19 | 0 |
| D | 0 | 19 | 0 |
| Mode SS | |||
|---|---|---|---|
| Quadrant | BADHDUFLAG | Total packets | Discarded packets |
| A | 0 | 386 | 0 |
| B | 0 | 386 | 0 |
| C | 0 | 386 | 0 |
| D | 0 | 386 | 0 |
| Quadrant | Total seconds | Saturated seconds | Saturation percentage |
|---|---|---|---|
| A | 18985 | 343 | 1.806689% |
| B | 18985 | 532 | 2.802212% |
| C | 18985 | 406 | 2.138530% |
| D | 18985 | 2548 | 13.421122% |
Noise dominated data is calculated using 1-second bins in cleaned event files. If a bin has >2000 counts, and if more than 50% of those come from <1% of pixels, then it is considered to be noise-dominated and hence unusable.
| Quadrant | # 1 sec bins | Bins with >0 counts | Bins with >2000 counts | High rate bins dominated by noise | Noise dominated (total time) | Noise dominated (detector-on time) | Marked lightcurve |
|---|---|---|---|---|---|---|---|
| A | 20820 | 18990 | 5 | 5 | 0.02% | 0.03% | 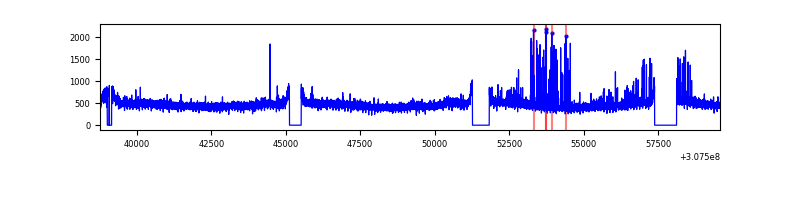 |
| B | 20820 | 18990 | 114 | 114 | 0.55% | 0.60% | 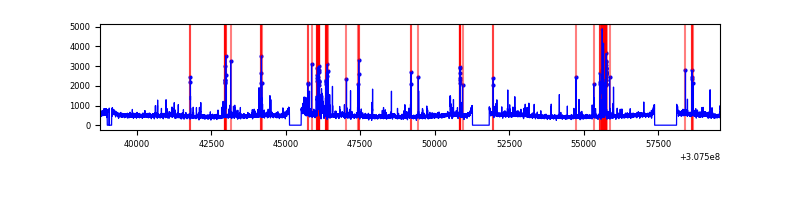 |
| C | 20820 | 18990 | 4 | 4 | 0.02% | 0.02% | 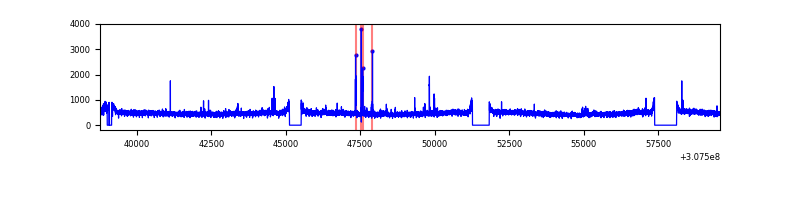 |
| D | 20820 | 18989 | 2036 | 2036 | 9.78% | 10.72% | 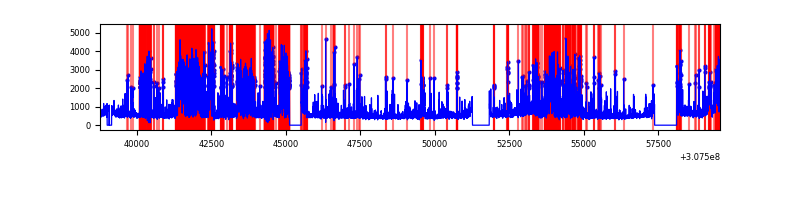 |
Top three noisy pixels from each quadrant. If the there are fewer than three noisy pixels in the level2.evt file, extra rows are filled as -1
| Pixel properties | Quadrant properties | ||||||
|---|---|---|---|---|---|---|---|
| Quadrant | DetID | PixID | Counts | Sigma | Mean | Median | Sigma |
| A | 15 | 236 | 187400 | 402.01 | 2287 | 2234 | 460.6 |
| A | 3 | 1 | 30940 | 62.32 | 2287 | 2234 | 460.6 |
| A | 13 | 254 | 27062 | 53.9 | 2287 | 2234 | 460.6 |
| B | 3 | 64 | 550656 | 1269.42 | 2277 | 2218 | 432.0 |
| B | 0 | 197 | 158082 | 360.76 | 2277 | 2218 | 432.0 |
| B | 0 | 189 | 83342 | 187.77 | 2277 | 2218 | 432.0 |
| C | 14 | 238 | 342502 | 660.52 | 2202 | 2208 | 515.2 |
| C | 10 | 22 | 99811 | 189.45 | 2202 | 2208 | 515.2 |
| C | 9 | 54 | 48822 | 90.48 | 2202 | 2208 | 515.2 |
| D | 1 | 52 | 5218761 | 10160.16 | 2118 | 2052 | 513.4 |
| D | 1 | 20 | 1623800 | 3158.54 | 2118 | 2052 | 513.4 |
| D | 2 | 136 | 534217 | 1036.45 | 2118 | 2052 | 513.4 |
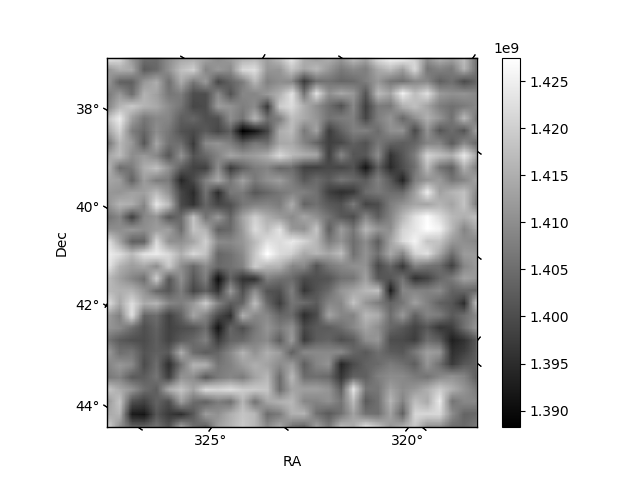
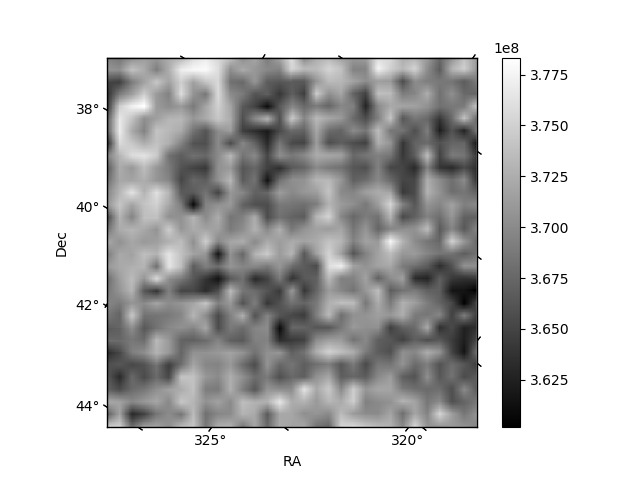
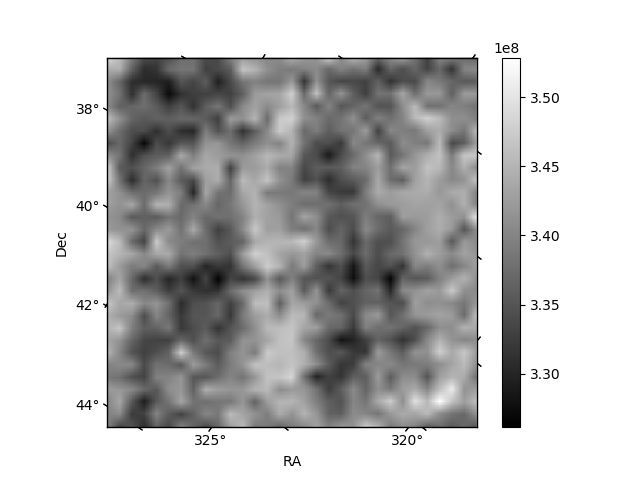
Histogram calculated using DETX and DETY for each event in the final _common_clean file
| Quadrant A | 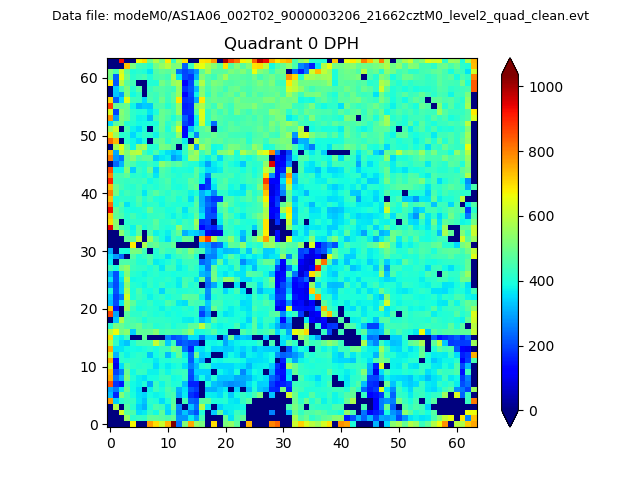 |
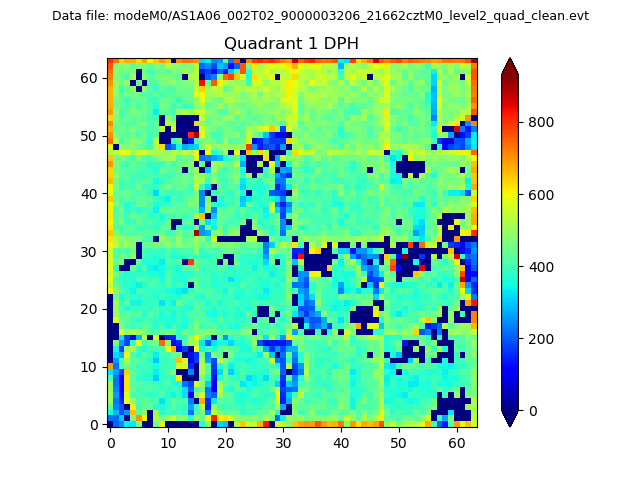 |
Quadrant B |
|---|---|---|---|
| Quadrant D | 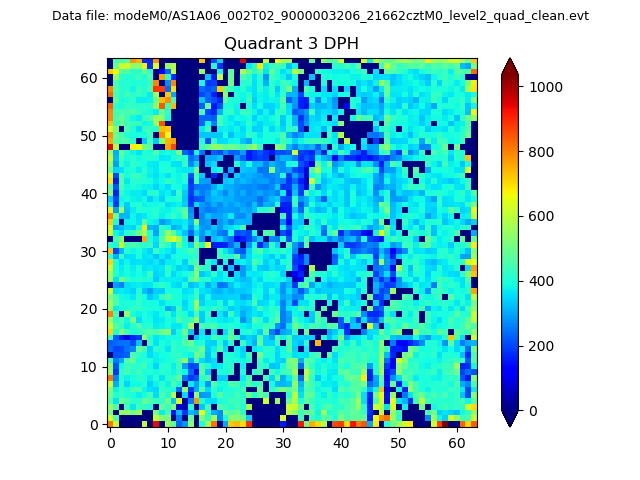 |
 |
Quadrant C |
| Plot type | Count rate plots | Images |
|---|---|---|
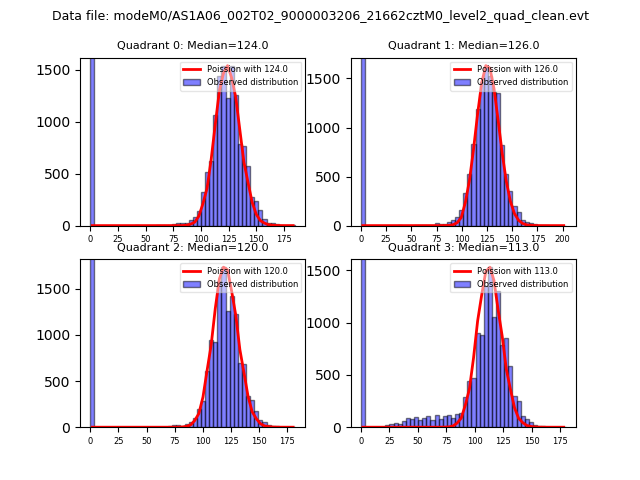
| Comparison with Poisson distribution Blue bars denote a histogram of data divided into 1 sec bins. Red curve is a Poisson curve with rate = median count rate of data. |
 |
 |
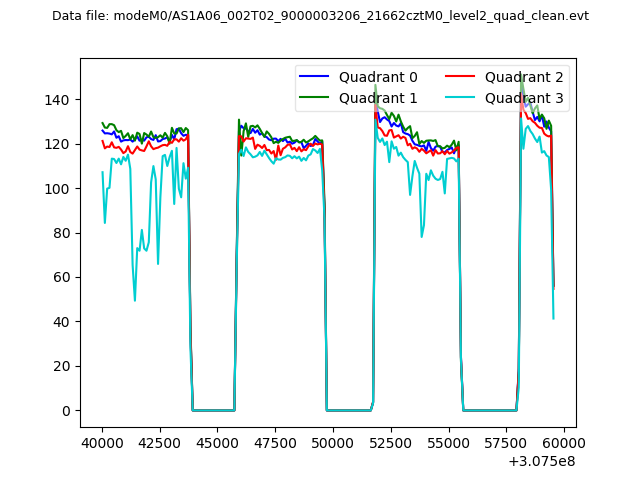
| Quadrant-wise count rates Data is divided into 100 sec bins |
 |
|
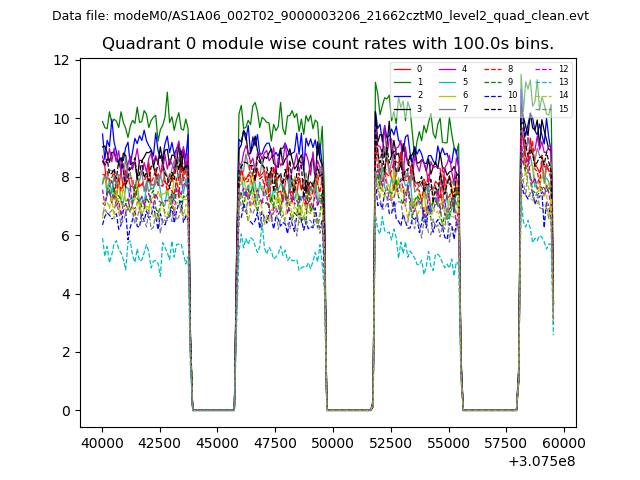
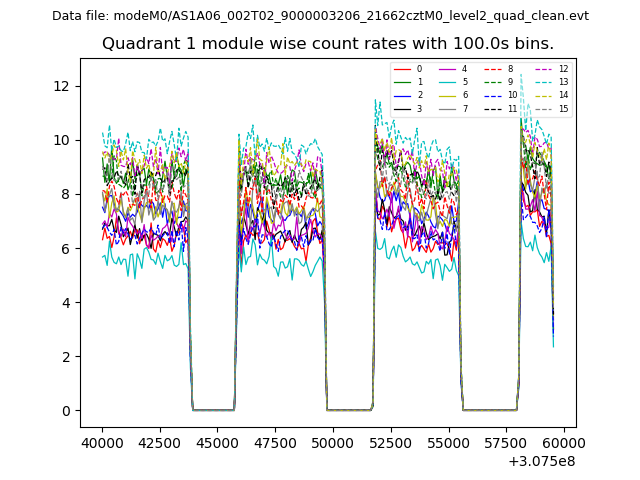
| Module-wise count rates for Quadrant A Data is divided into 100 sec bins |
 |
 |
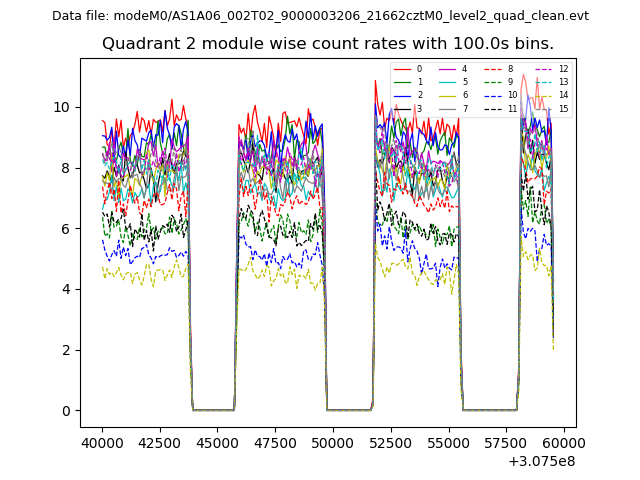
| Module-wise count rates for Quadrant B Data is divided into 100 sec bins |
 |
 |
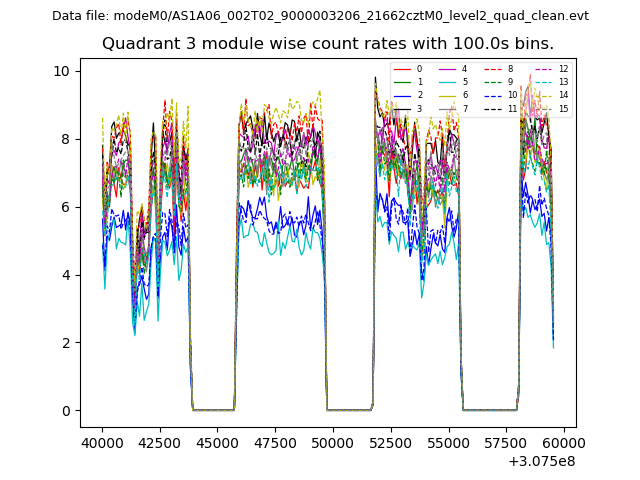
| Module-wise count rates for Quadrant C Data is divided into 100 sec bins |
 |
 |
| Module-wise count rates for Quadrant D Data is divided into 100 sec bins |
 |
 |
| Parameter | Plot |
|---|---|
| CZT HV Monitor | 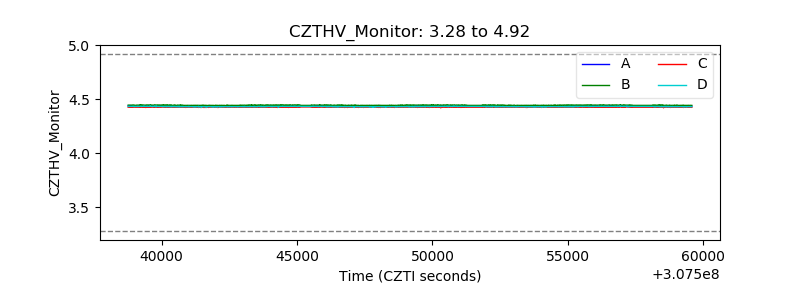 |
| D_VDD | 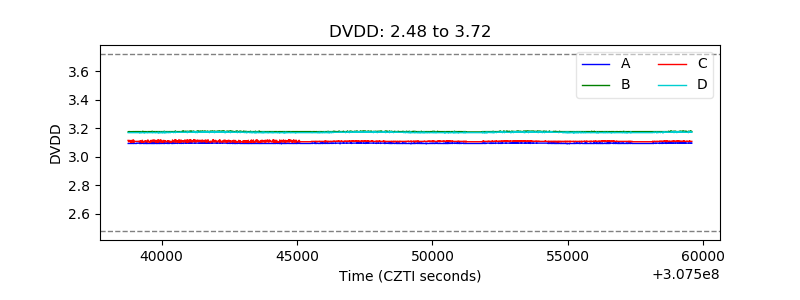 |
| Temperature 1 | 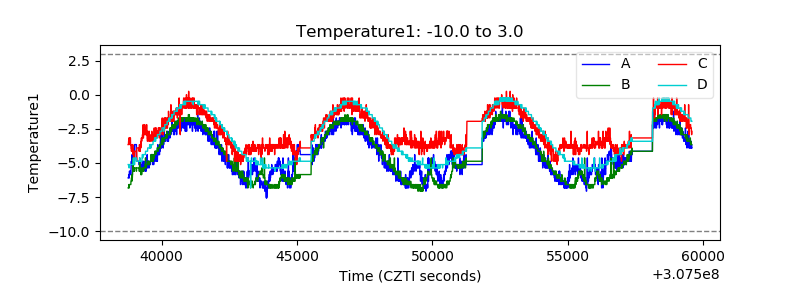 |
| Veto HV Monitor | 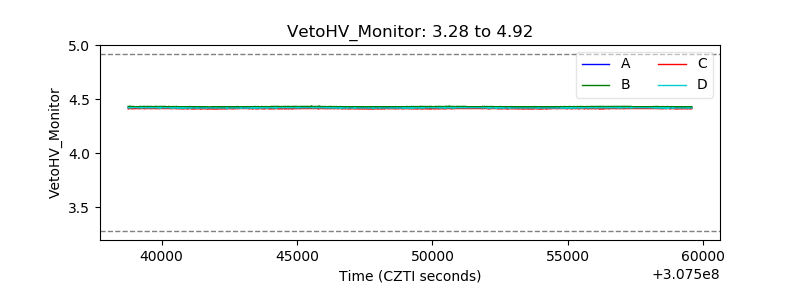 |
| Veto LLD | 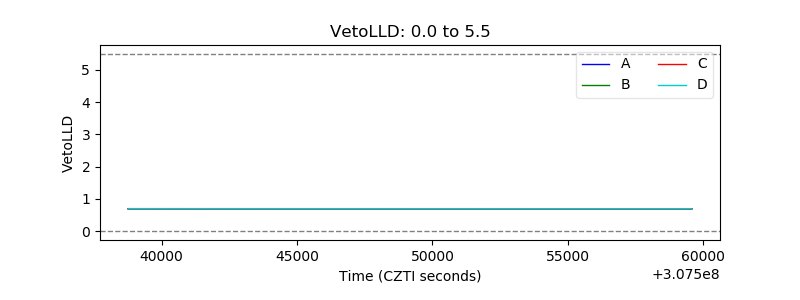 |
| Alpha Counter | 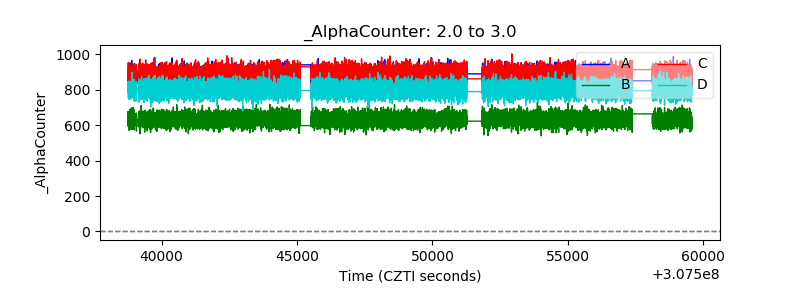 |
| _CPM_Rate | 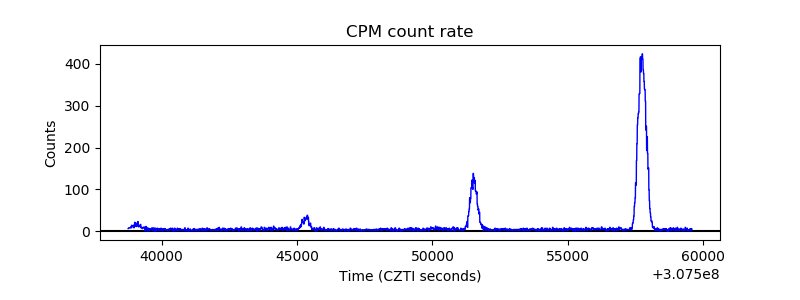 |
| CZT Counter |  |
| +2.5 Volts monitor |  |
| +5 Volts monitor | 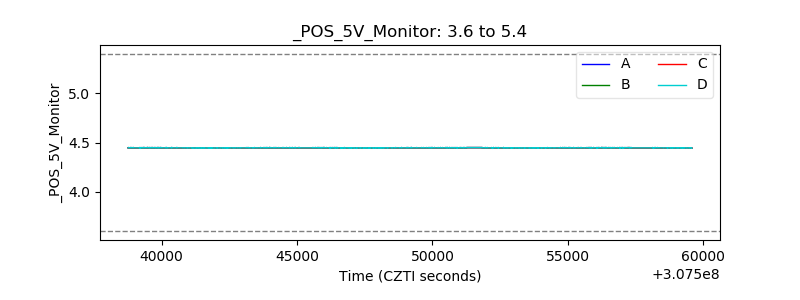 |
| _ROLL_ROT | 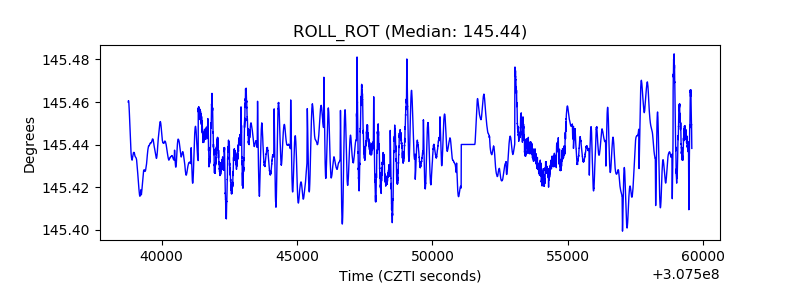 |
| _Roll_DEC | 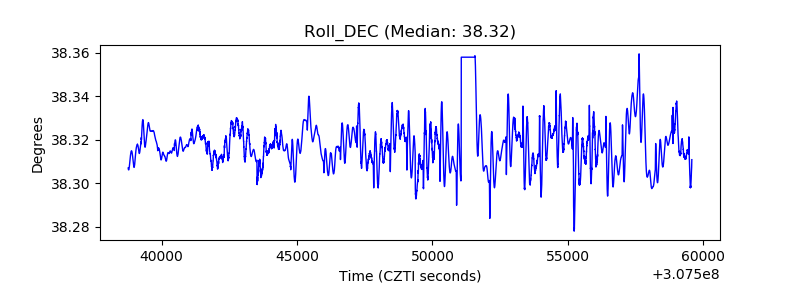 |
| _Roll_RA | 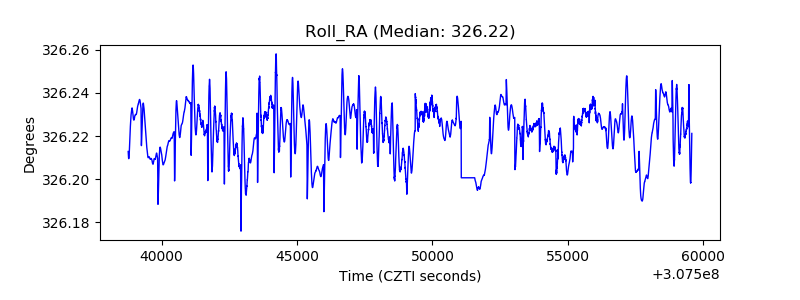 |
| Veto Counter | 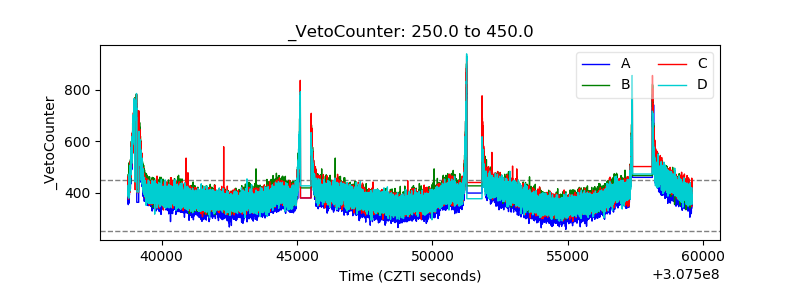 |