| Param | Original file | Final file |
|---|---|---|
| Filename | modeM0/AS1A06_002T02_9000003206_21664cztM0_level2.evt | modeM0/AS1A06_002T02_9000003206_21664cztM0_level2_quad_clean.evt |
| Size (bytes) | 541,249,920 | 94,991,040 |
| Size | 516.2 MB | 90.6 MB |
| Events in quadrant A | 3,096,880 | 618,788 |
| Events in quadrant B | 3,754,807 | 627,890 |
| Events in quadrant C | 3,154,765 | 607,313 |
| Events in quadrant D | 5,939,396 | 564,021 |
| Mode M0 | |||
|---|---|---|---|
| Quadrant | BADHDUFLAG | Total packets | Discarded packets |
| A | 0 | 13641 | 2 |
| B | 0 | 15510 | 2 |
| C | 0 | 13673 | 2 |
| D | 0 | 22150 | 2 |
| Mode M9 | |||
|---|---|---|---|
| Quadrant | BADHDUFLAG | Total packets | Discarded packets |
| A | 0 | 13 | 0 |
| B | 0 | 14 | 0 |
| C | 0 | 14 | 0 |
| D | 0 | 14 | 0 |
| Mode SS | |||
|---|---|---|---|
| Quadrant | BADHDUFLAG | Total packets | Discarded packets |
| A | 0 | 134 | 0 |
| B | 0 | 134 | 0 |
| C | 0 | 134 | 0 |
| D | 0 | 134 | 0 |
| Quadrant | Total seconds | Saturated seconds | Saturation percentage |
|---|---|---|---|
| A | 6575 | 33 | 0.501901% |
| B | 6575 | 132 | 2.007605% |
| C | 6575 | 76 | 1.155894% |
| D | 6575 | 511 | 7.771863% |
Noise dominated data is calculated using 1-second bins in cleaned event files. If a bin has >2000 counts, and if more than 50% of those come from <1% of pixels, then it is considered to be noise-dominated and hence unusable.
| Quadrant | # 1 sec bins | Bins with >0 counts | Bins with >2000 counts | High rate bins dominated by noise | Noise dominated (total time) | Noise dominated (detector-on time) | Marked lightcurve |
|---|---|---|---|---|---|---|---|
| A | 7655 | 6576 | 0 | 0 | 0.00% | 0.00% | 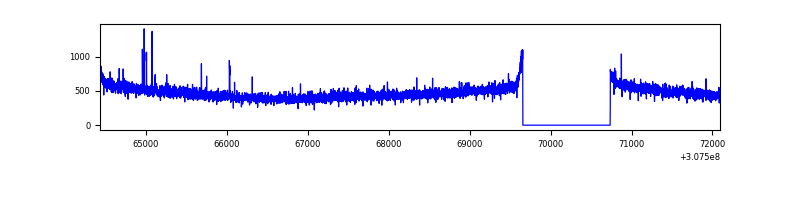 |
| B | 7655 | 6576 | 67 | 67 | 0.88% | 1.02% | 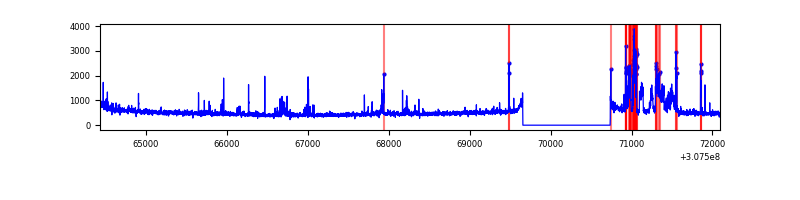 |
| C | 7655 | 6576 | 0 | 0 | 0.00% | 0.00% | 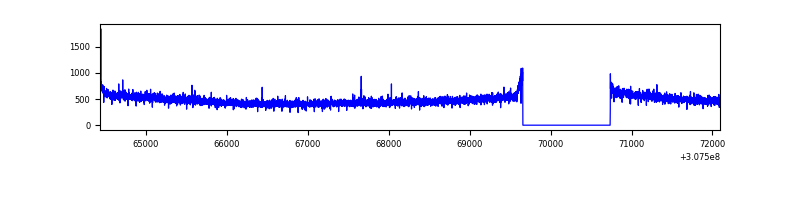 |
| D | 7655 | 6576 | 452 | 452 | 5.90% | 6.87% | 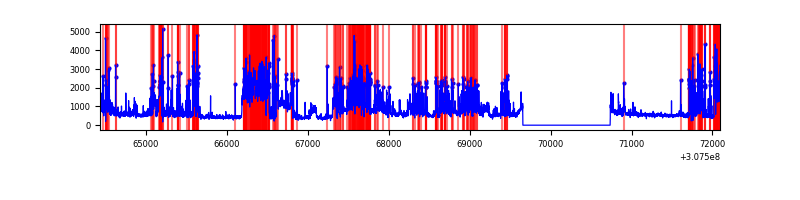 |
Top three noisy pixels from each quadrant. If the there are fewer than three noisy pixels in the level2.evt file, extra rows are filled as -1
| Pixel properties | Quadrant properties | ||||||
|---|---|---|---|---|---|---|---|
| Quadrant | DetID | PixID | Counts | Sigma | Mean | Median | Sigma |
| A | 15 | 236 | 13699 | 80.94 | 799 | 783 | 159.6 |
| A | 13 | 254 | 9302 | 53.38 | 799 | 783 | 159.6 |
| A | 0 | 226 | 6800 | 37.7 | 799 | 783 | 159.6 |
| B | 3 | 64 | 501819 | 3308.62 | 797 | 777 | 151.4 |
| B | 0 | 230 | 50480 | 328.21 | 797 | 777 | 151.4 |
| B | 0 | 229 | 24098 | 154.0 | 797 | 777 | 151.4 |
| C | 14 | 238 | 121821 | 661.61 | 777 | 780 | 182.9 |
| C | 13 | 61 | 5530 | 25.96 | 777 | 780 | 182.9 |
| C | 10 | 22 | 5085 | 23.53 | 777 | 780 | 182.9 |
| D | 7 | 223 | 1914973 | 10375.02 | 763 | 741 | 184.5 |
| D | 1 | 52 | 528670 | 2861.34 | 763 | 741 | 184.5 |
| D | 13 | 153 | 191047 | 1031.44 | 763 | 741 | 184.5 |
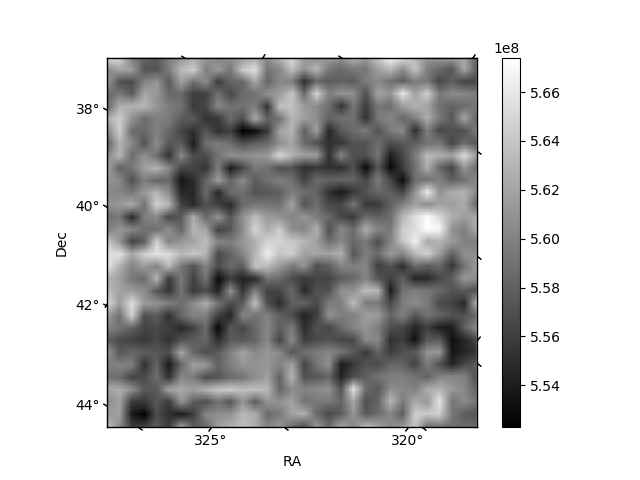
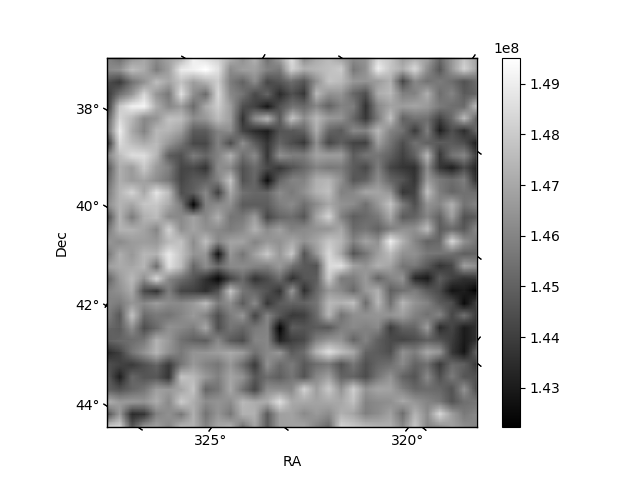
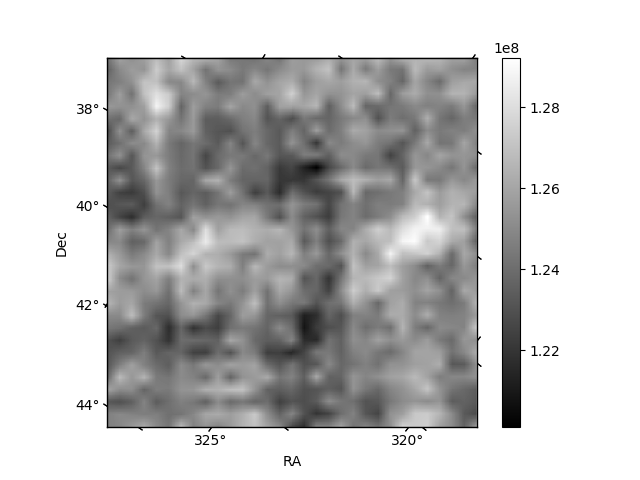
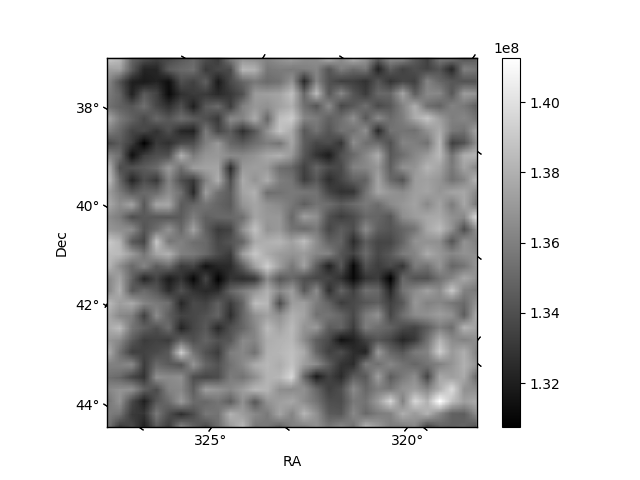
Histogram calculated using DETX and DETY for each event in the final _common_clean file
| Quadrant A | 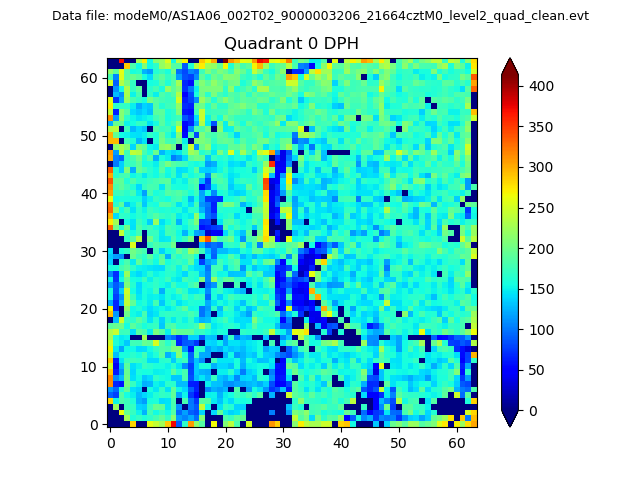 |
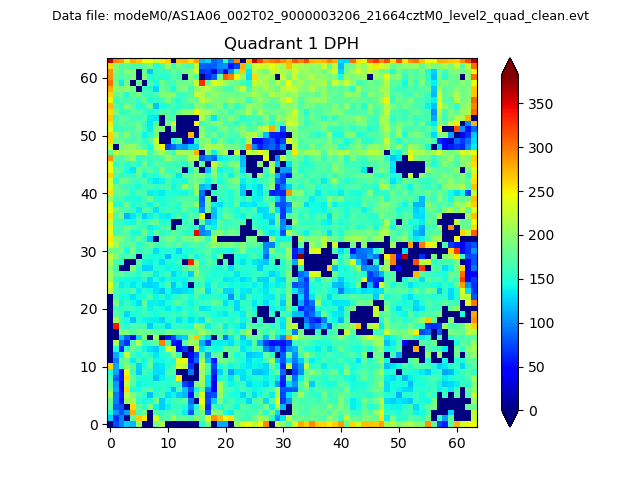 |
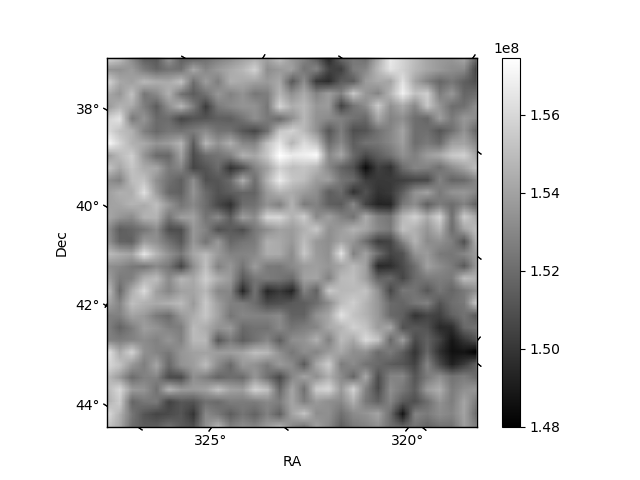
Quadrant B |
|---|---|---|---|
| Quadrant D | 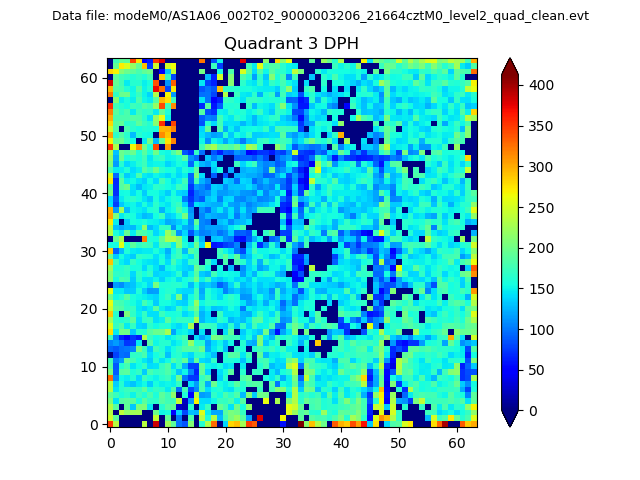 |
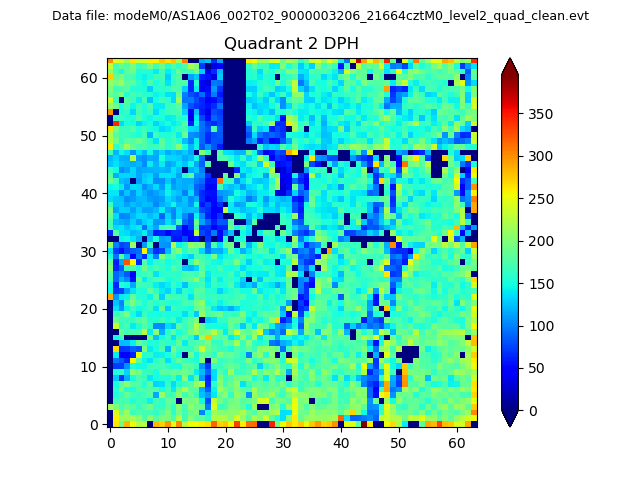 |
Quadrant C |
| Plot type | Count rate plots | Images |
|---|---|---|
| Comparison with Poisson distribution Blue bars denote a histogram of data divided into 1 sec bins. Red curve is a Poisson curve with rate = median count rate of data. |
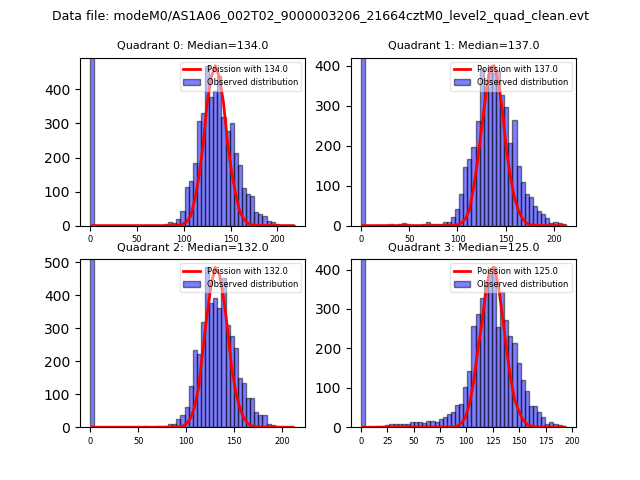 |
 |
| Quadrant-wise count rates Data is divided into 100 sec bins |
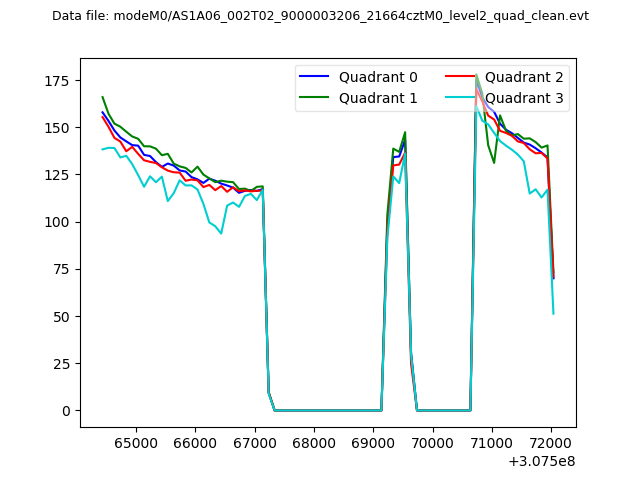 |
|
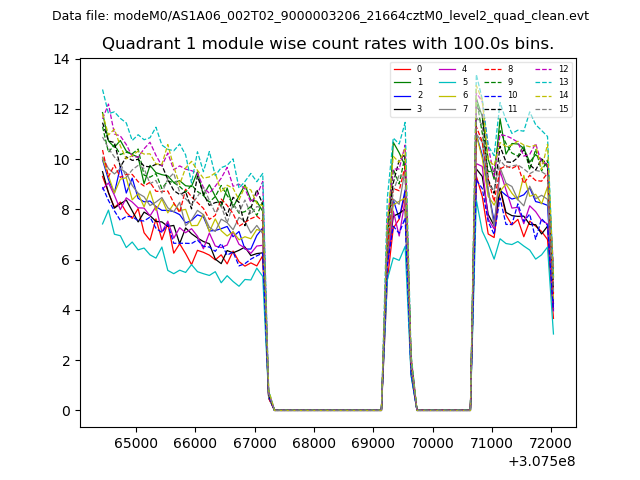
| Module-wise count rates for Quadrant A Data is divided into 100 sec bins |
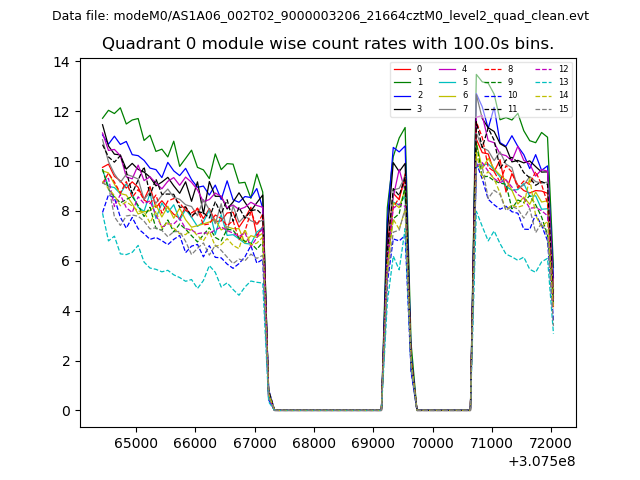 |
 |
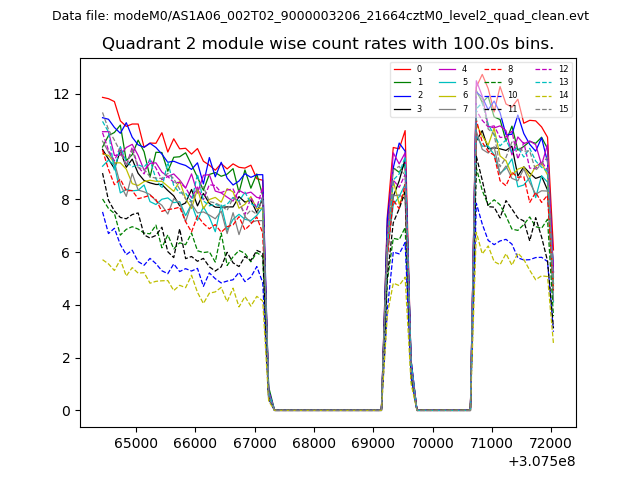
| Module-wise count rates for Quadrant B Data is divided into 100 sec bins |
 |
 |
| Module-wise count rates for Quadrant C Data is divided into 100 sec bins |
 |
 |
| Module-wise count rates for Quadrant D Data is divided into 100 sec bins |
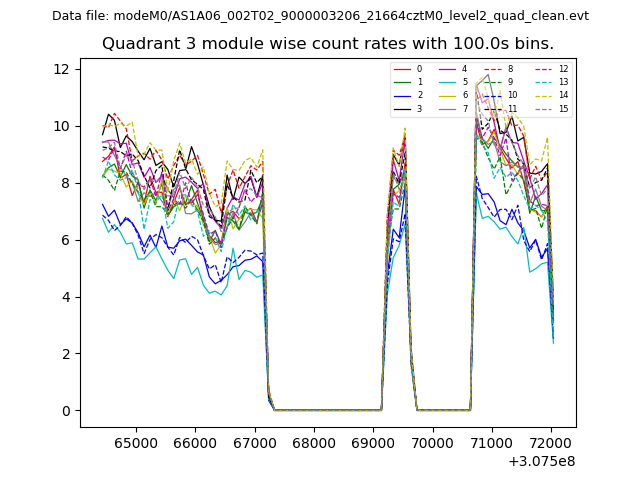 |
 |
| Parameter | Plot |
|---|---|
| CZT HV Monitor | 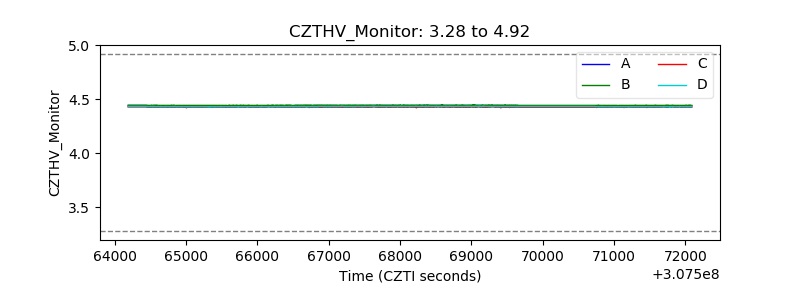 |
| D_VDD | 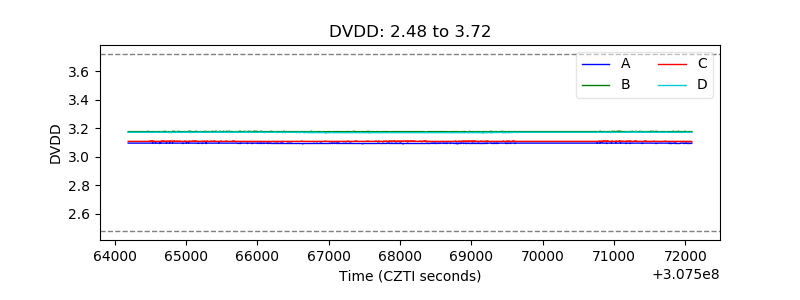 |
| Temperature 1 | 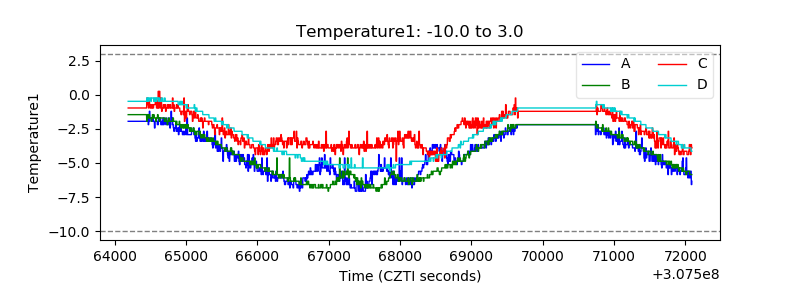 |
| Veto HV Monitor | 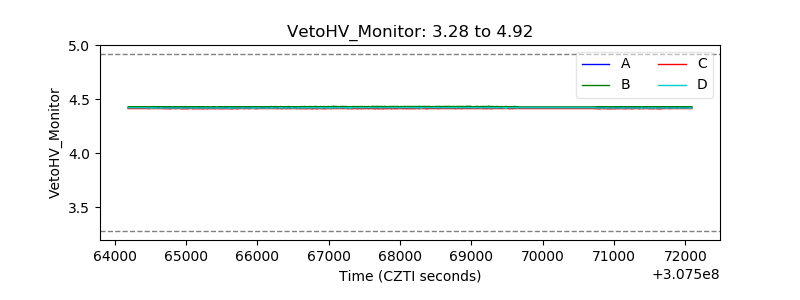 |
| Veto LLD | 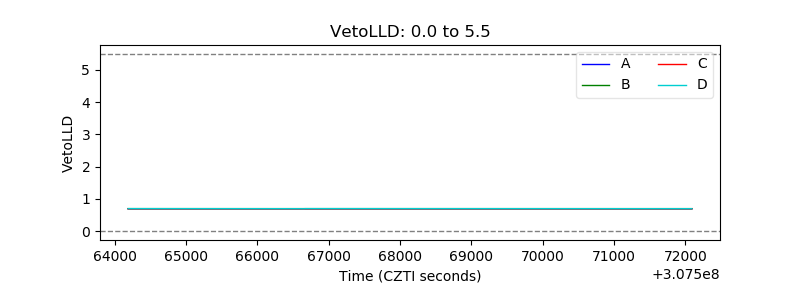 |
| Alpha Counter | 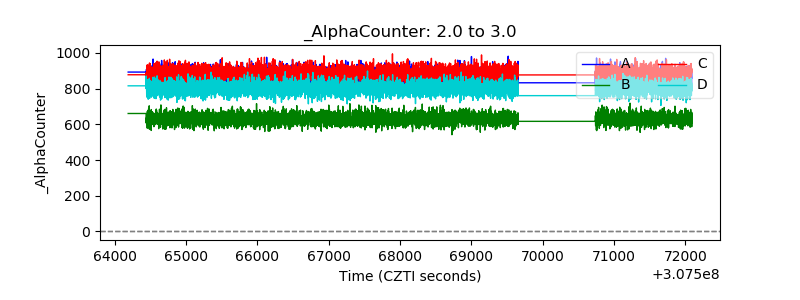 |
| _CPM_Rate | 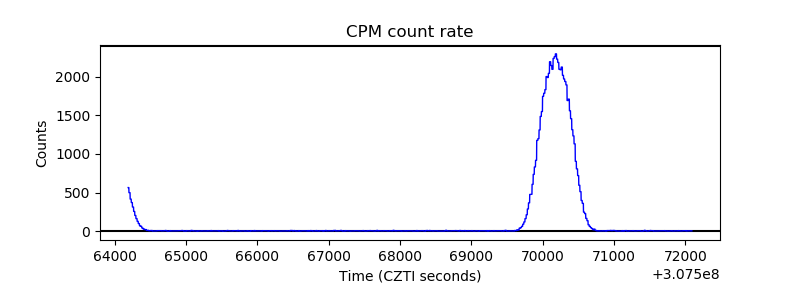 |
| CZT Counter | 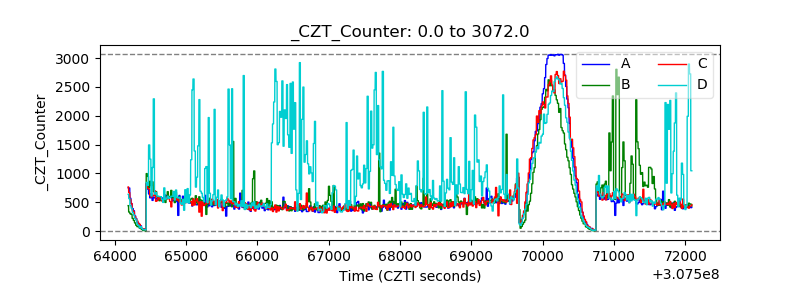 |
| +2.5 Volts monitor |  |
| +5 Volts monitor |  |
| _ROLL_ROT | 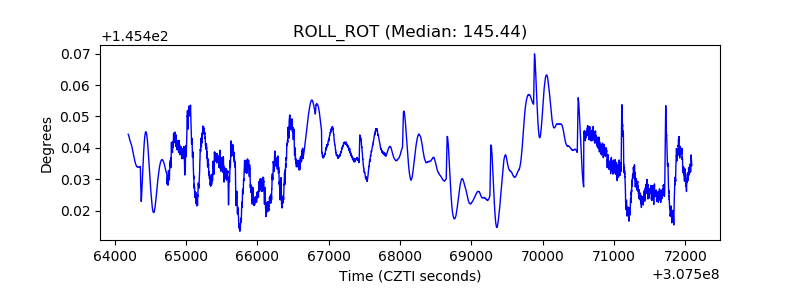 |
| _Roll_DEC | 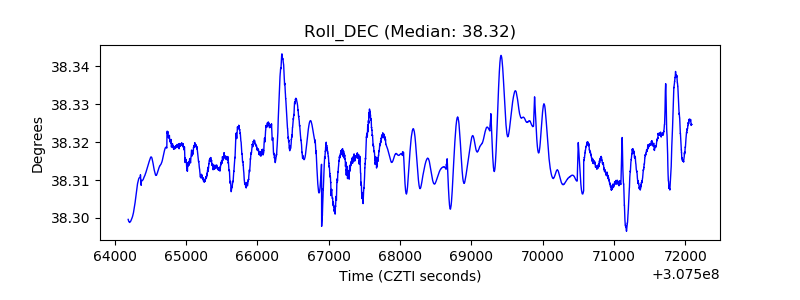 |
| _Roll_RA | 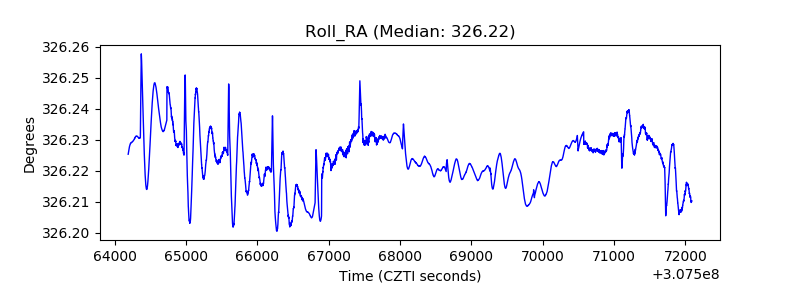 |
| Veto Counter | 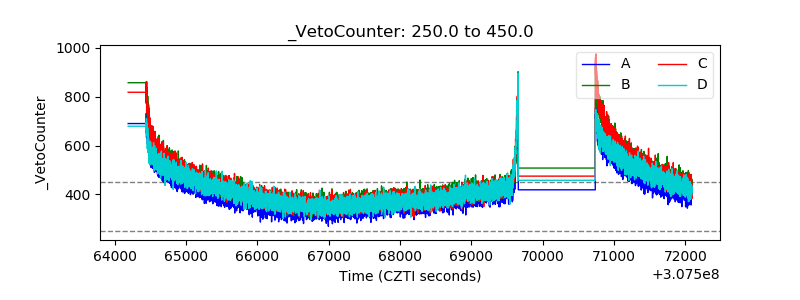 |