| Param | Original file | Final file |
|---|---|---|
| Filename | modeM0/AS1A06_002T02_9000003206_21666cztM0_level2.evt | modeM0/AS1A06_002T02_9000003206_21666cztM0_level2_quad_clean.evt |
| Size (bytes) | 510,033,600 | 95,719,680 |
| Size | 486.4 MB | 91.3 MB |
| Events in quadrant A | 3,045,547 | 631,104 |
| Events in quadrant B | 3,719,603 | 642,536 |
| Events in quadrant C | 3,262,234 | 618,534 |
| Events in quadrant D | 4,986,140 | 561,354 |
| Mode M0 | |||
|---|---|---|---|
| Quadrant | BADHDUFLAG | Total packets | Discarded packets |
| A | 0 | 13242 | 2 |
| B | 0 | 15236 | 2 |
| C | 0 | 13884 | 2 |
| D | 0 | 19247 | 2 |
| Mode M9 | |||
|---|---|---|---|
| Quadrant | BADHDUFLAG | Total packets | Discarded packets |
| A | 0 | 16 | 0 |
| B | 0 | 17 | 0 |
| C | 0 | 17 | 0 |
| D | 0 | 17 | 0 |
| Mode SS | |||
|---|---|---|---|
| Quadrant | BADHDUFLAG | Total packets | Discarded packets |
| A | 0 | 130 | 0 |
| B | 0 | 130 | 0 |
| C | 0 | 130 | 0 |
| D | 0 | 130 | 0 |
| Quadrant | Total seconds | Saturated seconds | Saturation percentage |
|---|---|---|---|
| A | 6378 | 29 | 0.454688% |
| B | 6377 | 140 | 2.195390% |
| C | 6377 | 69 | 1.082013% |
| D | 6377 | 514 | 8.060216% |
Noise dominated data is calculated using 1-second bins in cleaned event files. If a bin has >2000 counts, and if more than 50% of those come from <1% of pixels, then it is considered to be noise-dominated and hence unusable.
| Quadrant | # 1 sec bins | Bins with >0 counts | Bins with >2000 counts | High rate bins dominated by noise | Noise dominated (total time) | Noise dominated (detector-on time) | Marked lightcurve |
|---|---|---|---|---|---|---|---|
| A | 7588 | 6379 | 0 | 0 | 0.00% | 0.00% | 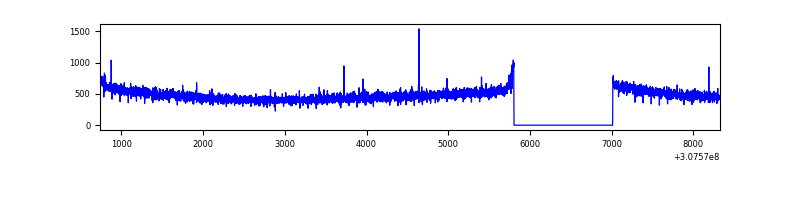 |
| B | 7587 | 6378 | 76 | 76 | 1.00% | 1.19% |  |
| C | 7587 | 6378 | 6 | 6 | 0.08% | 0.09% | 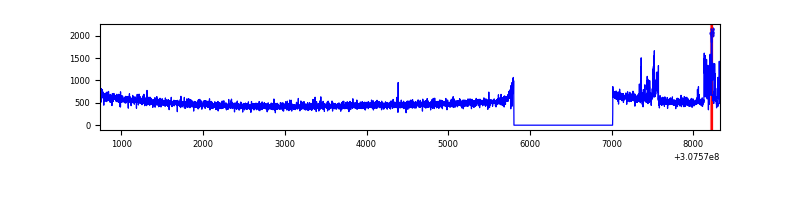 |
| D | 7587 | 6378 | 466 | 466 | 6.14% | 7.31% | 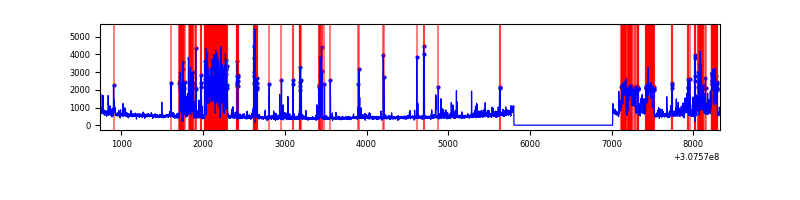 |
Top three noisy pixels from each quadrant. If the there are fewer than three noisy pixels in the level2.evt file, extra rows are filled as -1
| Pixel properties | Quadrant properties | ||||||
|---|---|---|---|---|---|---|---|
| Quadrant | DetID | PixID | Counts | Sigma | Mean | Median | Sigma |
| A | 13 | 254 | 10070 | 58.98 | 789 | 773 | 157.6 |
| A | 0 | 226 | 6606 | 37.01 | 789 | 773 | 157.6 |
| A | 3 | 137 | 6512 | 36.41 | 789 | 773 | 157.6 |
| B | 3 | 64 | 497159 | 3358.36 | 791 | 772 | 147.8 |
| B | 0 | 230 | 55016 | 366.99 | 791 | 772 | 147.8 |
| B | 4 | 171 | 19155 | 124.37 | 791 | 772 | 147.8 |
| C | 9 | 54 | 135075 | 746.47 | 768 | 773 | 179.9 |
| C | 14 | 238 | 122176 | 674.78 | 768 | 773 | 179.9 |
| C | 10 | 22 | 9333 | 47.58 | 768 | 773 | 179.9 |
| D | 1 | 52 | 986673 | 5450.07 | 749 | 726 | 180.9 |
| D | 7 | 223 | 568758 | 3139.94 | 749 | 726 | 180.9 |
| D | 7 | 238 | 369791 | 2040.1 | 749 | 726 | 180.9 |
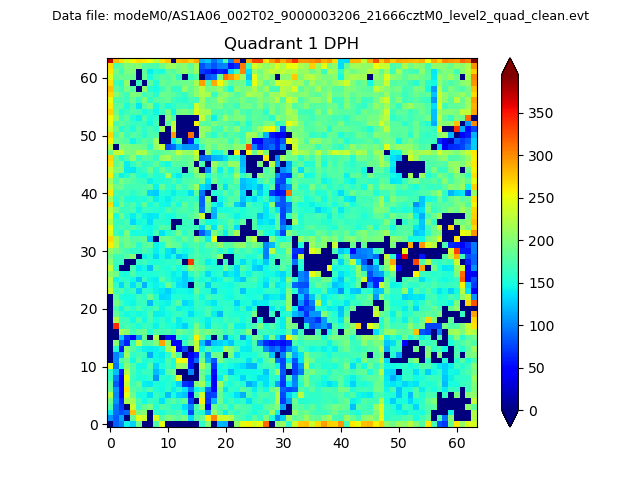
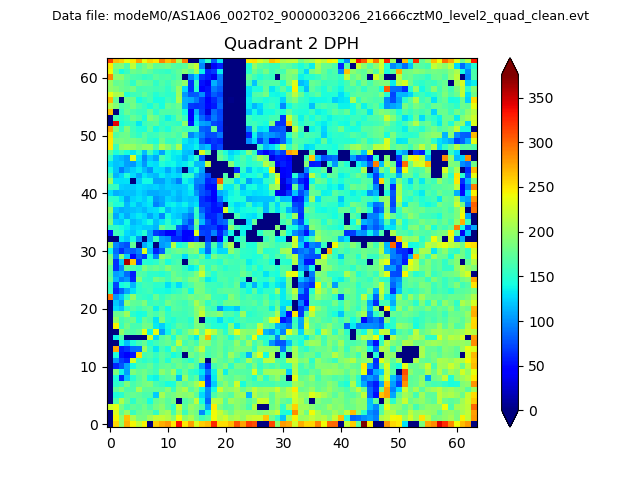
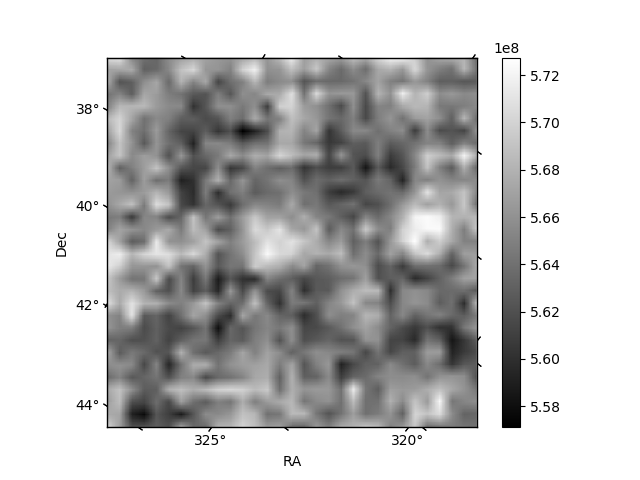
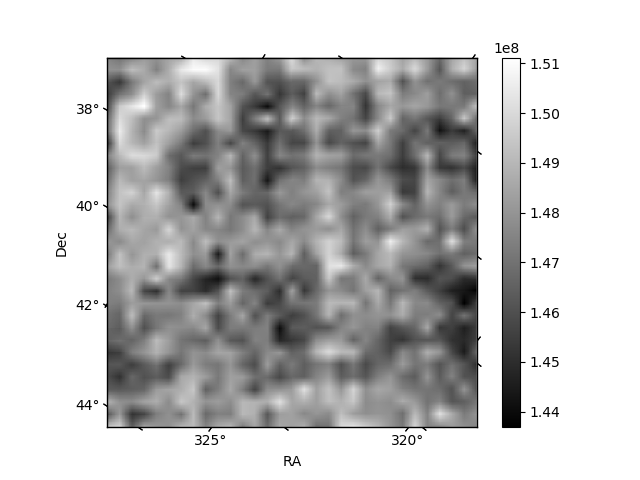
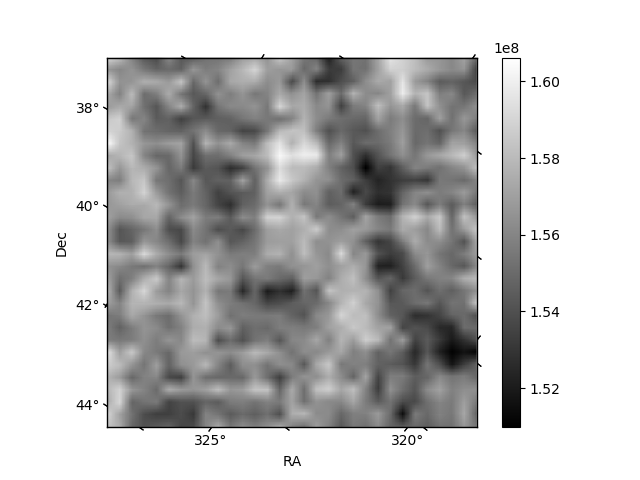
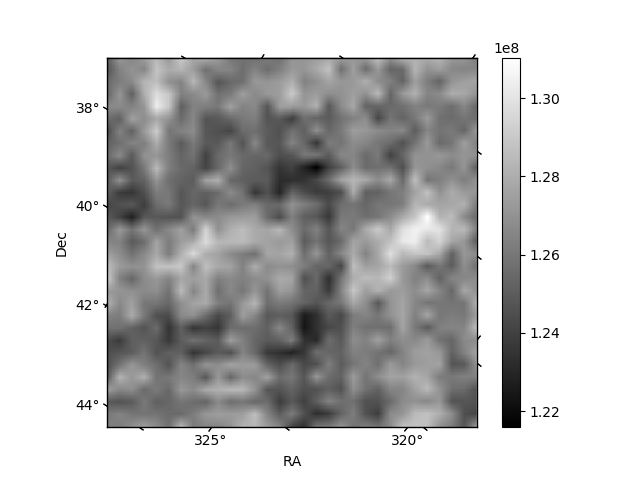
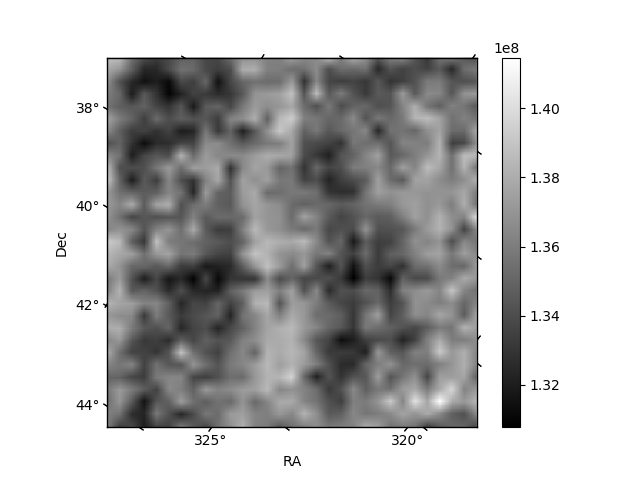
Histogram calculated using DETX and DETY for each event in the final _common_clean file
| Quadrant A | 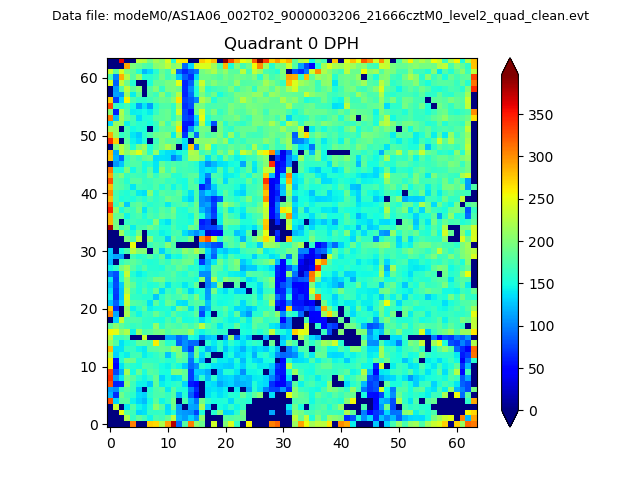 |
 |
Quadrant B |
|---|---|---|---|
| Quadrant D | 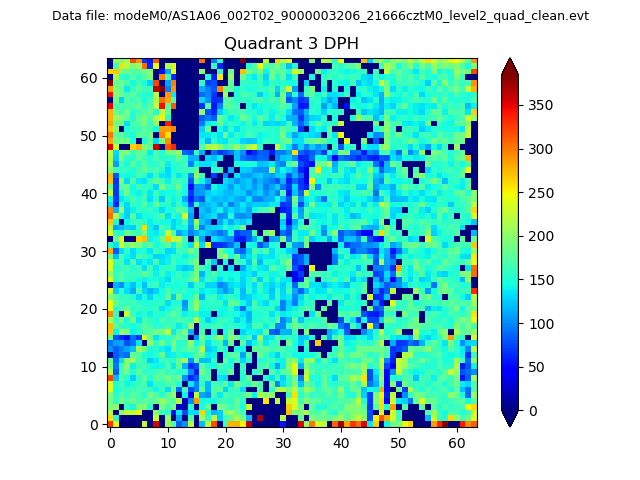 |
 |
Quadrant C |
| Plot type | Count rate plots | Images |
|---|---|---|
| Comparison with Poisson distribution Blue bars denote a histogram of data divided into 1 sec bins. Red curve is a Poisson curve with rate = median count rate of data. |
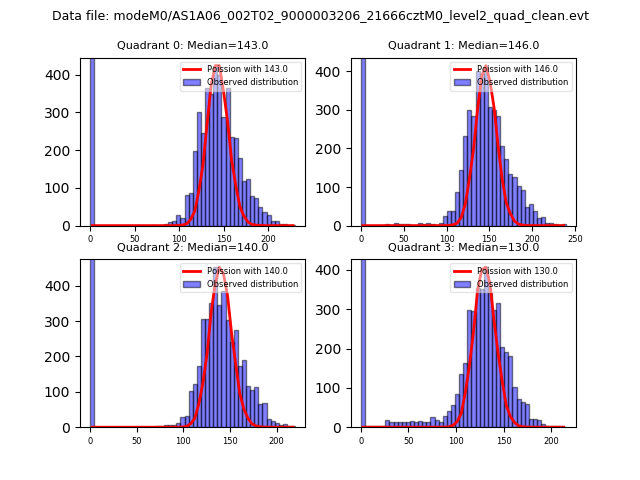 |
 |
| Quadrant-wise count rates Data is divided into 100 sec bins |
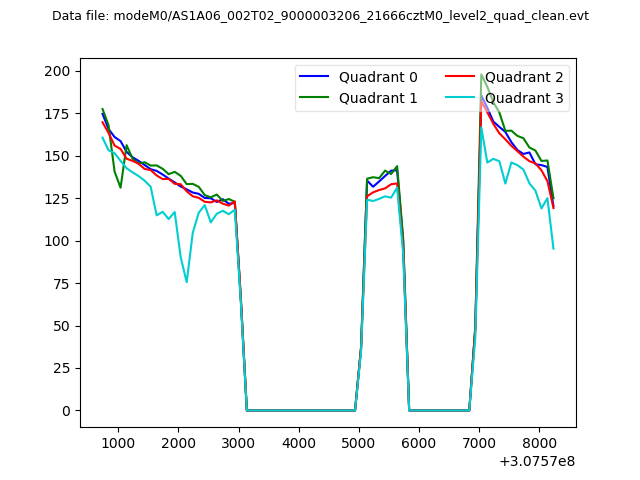 |
|
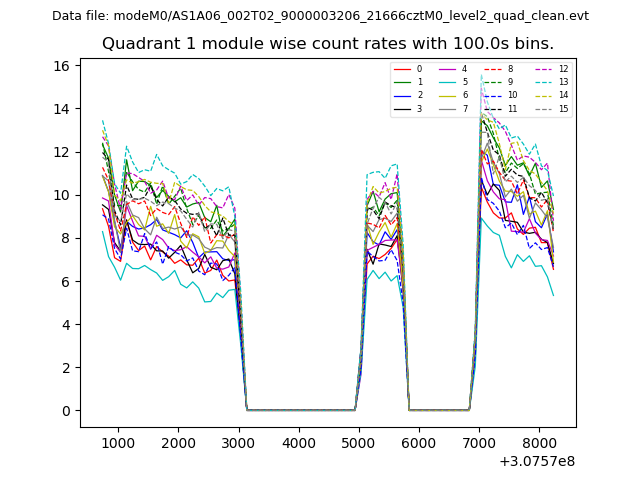
| Module-wise count rates for Quadrant A Data is divided into 100 sec bins |
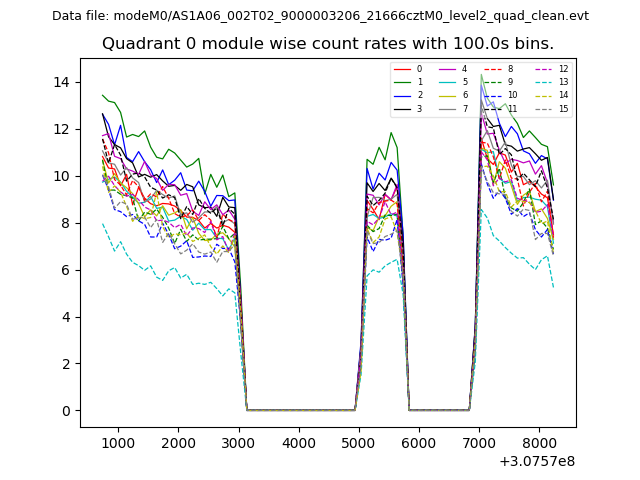 |
 |
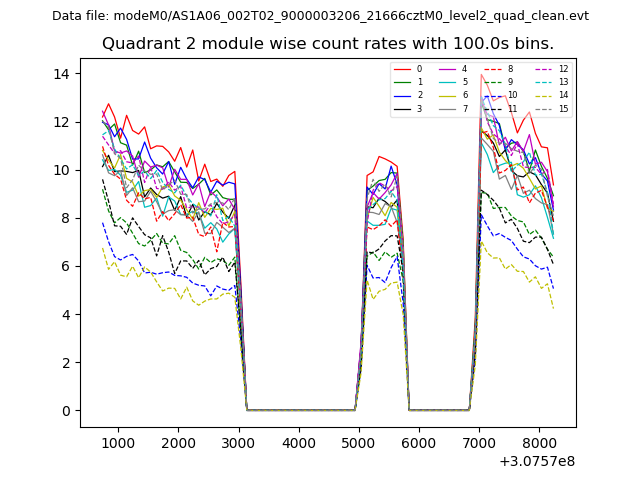
| Module-wise count rates for Quadrant B Data is divided into 100 sec bins |
 |
 |
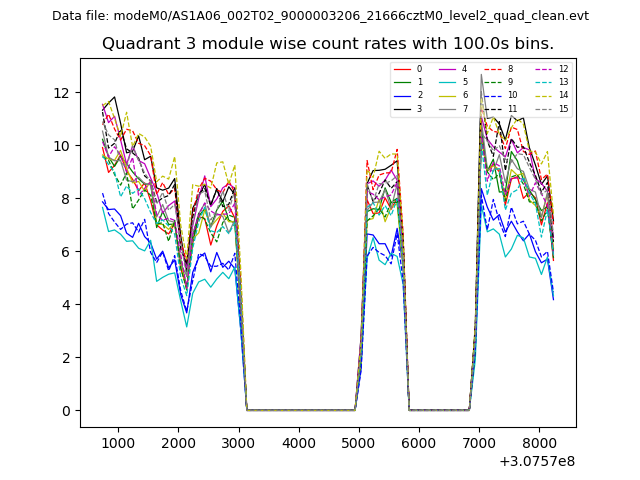
| Module-wise count rates for Quadrant C Data is divided into 100 sec bins |
 |
 |
| Module-wise count rates for Quadrant D Data is divided into 100 sec bins |
 |
 |
| Parameter | Plot |
|---|---|
| CZT HV Monitor | 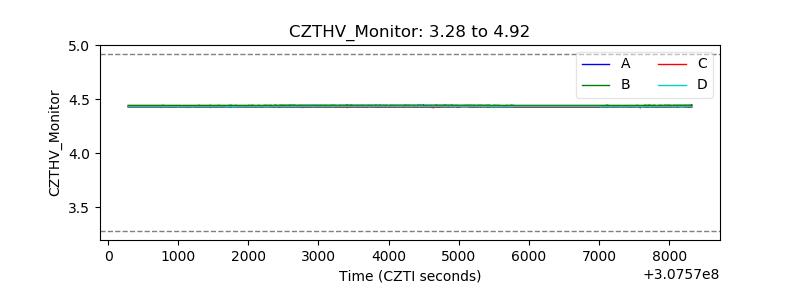 |
| D_VDD | 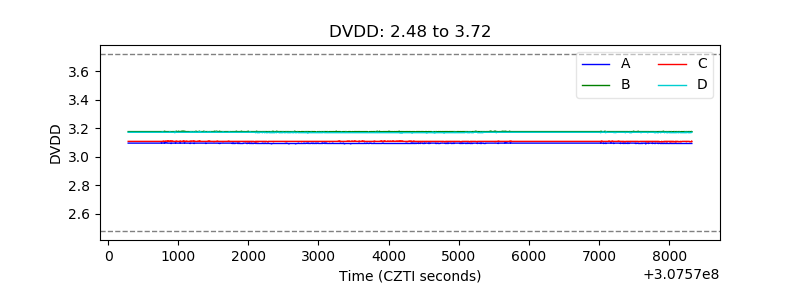 |
| Temperature 1 | 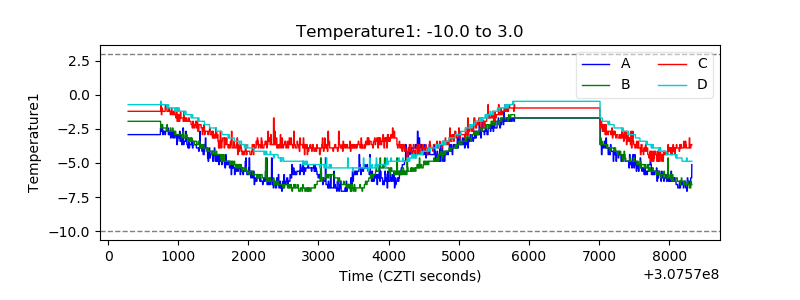 |
| Veto HV Monitor | 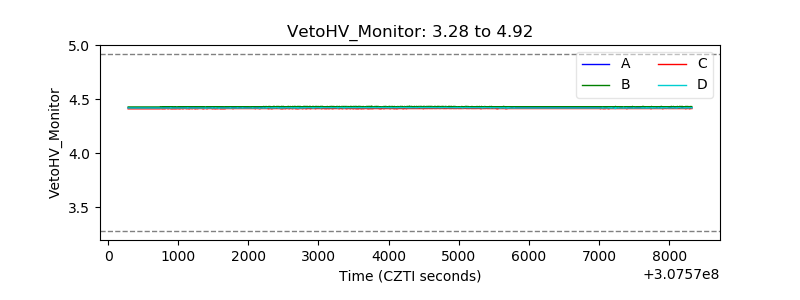 |
| Veto LLD | 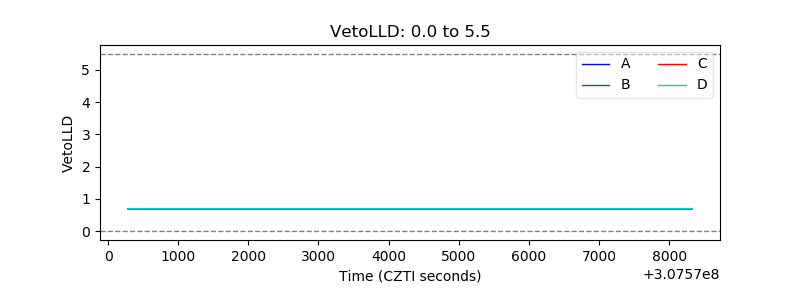 |
| Alpha Counter | 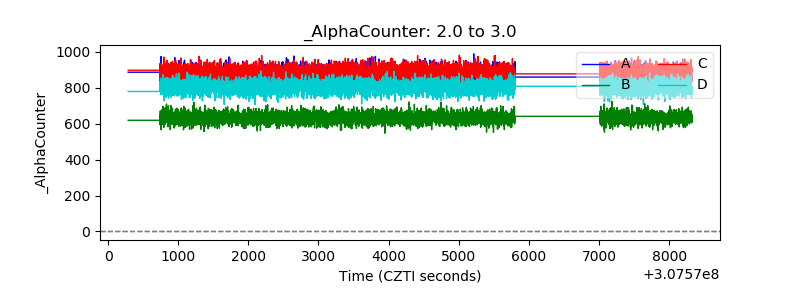 |
| _CPM_Rate | 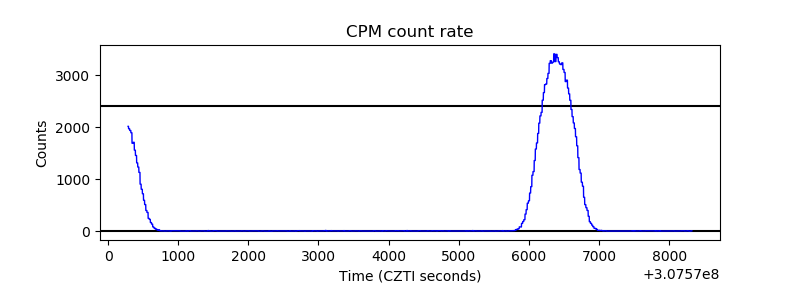 |
| CZT Counter | 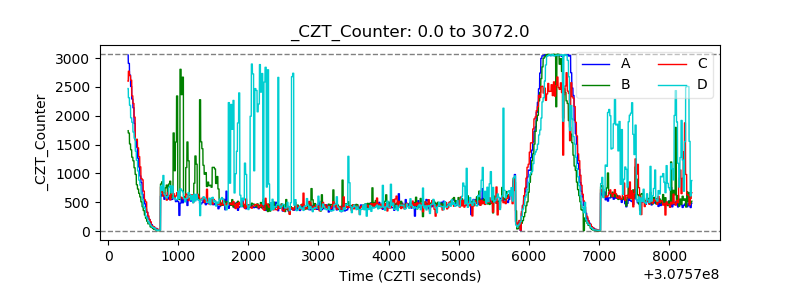 |
| +2.5 Volts monitor |  |
| +5 Volts monitor | 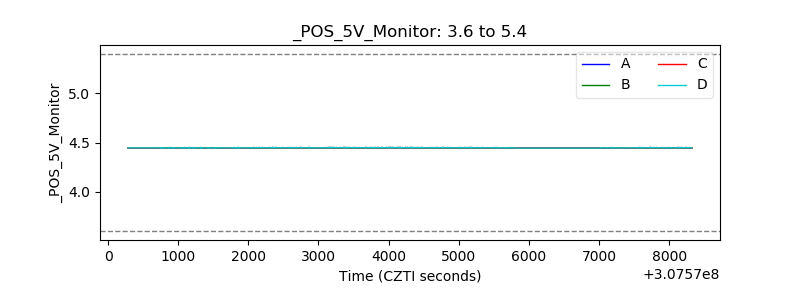 |
| _ROLL_ROT | 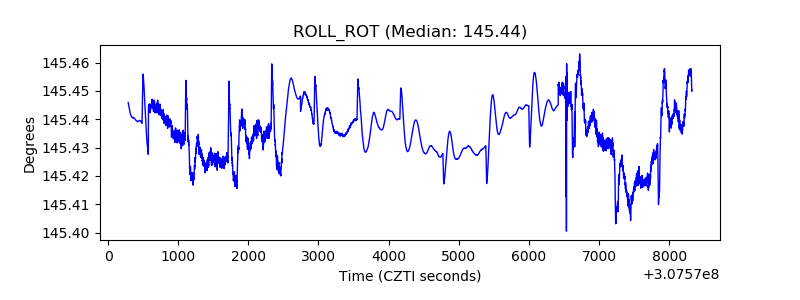 |
| _Roll_DEC | 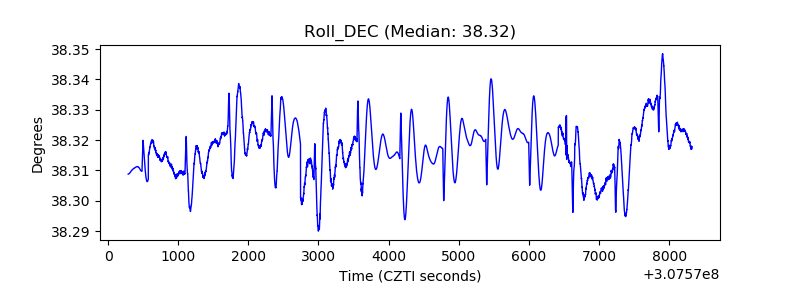 |
| _Roll_RA | 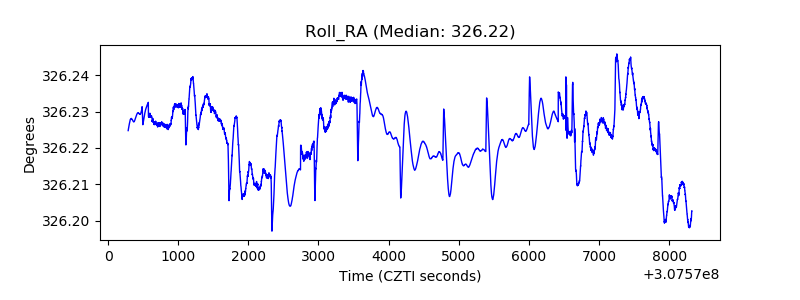 |
| Veto Counter | 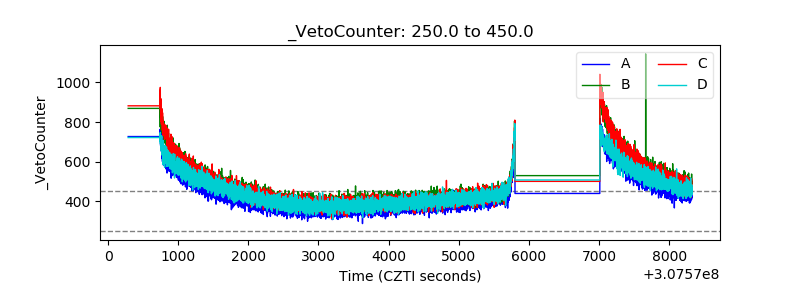 |