| Param | Original file | Final file |
|---|---|---|
| Filename | modeM0/AS1A06_002T02_9000003206_21668cztM0_level2.evt | modeM0/AS1A06_002T02_9000003206_21668cztM0_level2_quad_clean.evt |
| Size (bytes) | 348,791,040 | 49,138,560 |
| Size | 332.6 MB | 46.9 MB |
| Events in quadrant A | 2,350,933 | 310,053 |
| Events in quadrant B | 2,056,642 | 326,424 |
| Events in quadrant C | 1,976,317 | 305,447 |
| Events in quadrant D | 3,904,427 | 260,857 |
| Mode M0 | |||
|---|---|---|---|
| Quadrant | BADHDUFLAG | Total packets | Discarded packets |
| A | 0 | 9635 | 1 |
| B | 0 | 8597 | 1 |
| C | 0 | 8400 | 1 |
| D | 0 | 14294 | 1 |
| Mode M9 | |||
|---|---|---|---|
| Quadrant | BADHDUFLAG | Total packets | Discarded packets |
| A | 0 | 10 | 0 |
| B | 0 | 11 | 0 |
| C | 0 | 11 | 0 |
| D | 0 | 11 | 0 |
| Mode SS | |||
|---|---|---|---|
| Quadrant | BADHDUFLAG | Total packets | Discarded packets |
| A | 0 | 82 | 0 |
| B | 0 | 82 | 0 |
| C | 0 | 82 | 0 |
| D | 0 | 82 | 0 |
| Quadrant | Total seconds | Saturated seconds | Saturation percentage |
|---|---|---|---|
| A | 4032 | 8 | 0.198413% |
| B | 4032 | 10 | 0.248016% |
| C | 4032 | 12 | 0.297619% |
| D | 4032 | 460 | 11.408730% |
Noise dominated data is calculated using 1-second bins in cleaned event files. If a bin has >2000 counts, and if more than 50% of those come from <1% of pixels, then it is considered to be noise-dominated and hence unusable.
| Quadrant | # 1 sec bins | Bins with >0 counts | Bins with >2000 counts | High rate bins dominated by noise | Noise dominated (total time) | Noise dominated (detector-on time) | Marked lightcurve |
|---|---|---|---|---|---|---|---|
| A | 4032 | 4032 | 1 | 1 | 0.02% | 0.02% | 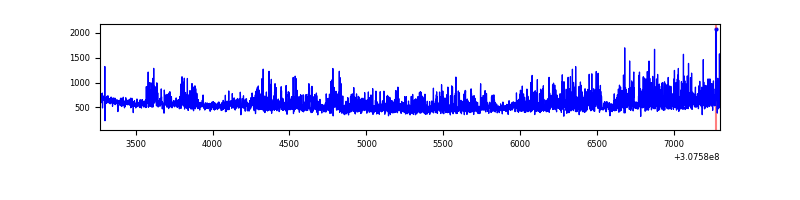 |
| B | 4032 | 4032 | 3 | 3 | 0.07% | 0.07% | 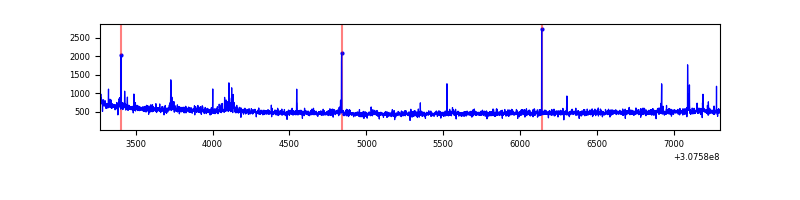 |
| C | 4032 | 4032 | 0 | 0 | 0.00% | 0.00% | 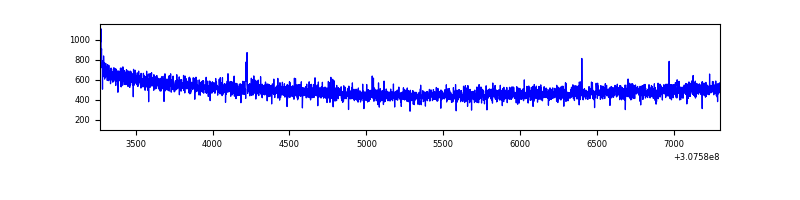 |
| D | 4032 | 4032 | 452 | 452 | 11.21% | 11.21% | 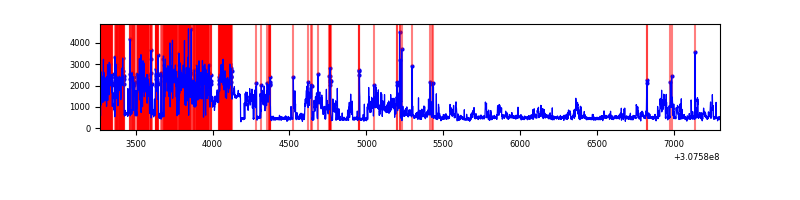 |
Top three noisy pixels from each quadrant. If the there are fewer than three noisy pixels in the level2.evt file, extra rows are filled as -1
| Pixel properties | Quadrant properties | ||||||
|---|---|---|---|---|---|---|---|
| Quadrant | DetID | PixID | Counts | Sigma | Mean | Median | Sigma |
| A | 15 | 236 | 421956 | 4208.16 | 500 | 491 | 100.2 |
| A | 13 | 254 | 6246 | 57.46 | 500 | 491 | 100.2 |
| A | 0 | 226 | 4263 | 37.66 | 500 | 491 | 100.2 |
| B | 3 | 64 | 33629 | 345.92 | 508 | 496 | 95.8 |
| B | 0 | 230 | 21316 | 217.37 | 508 | 496 | 95.8 |
| B | 12 | 111 | 10970 | 109.35 | 508 | 496 | 95.8 |
| C | 14 | 238 | 78181 | 682.93 | 485 | 490 | 113.8 |
| C | 10 | 22 | 4803 | 37.91 | 485 | 490 | 113.8 |
| C | 13 | 61 | 3468 | 26.18 | 485 | 490 | 113.8 |
| D | 7 | 238 | 1663176 | 14831.83 | 463 | 450 | 112.1 |
| D | 1 | 52 | 346896 | 3090.36 | 463 | 450 | 112.1 |
| D | 13 | 172 | 62003 | 549.06 | 463 | 450 | 112.1 |
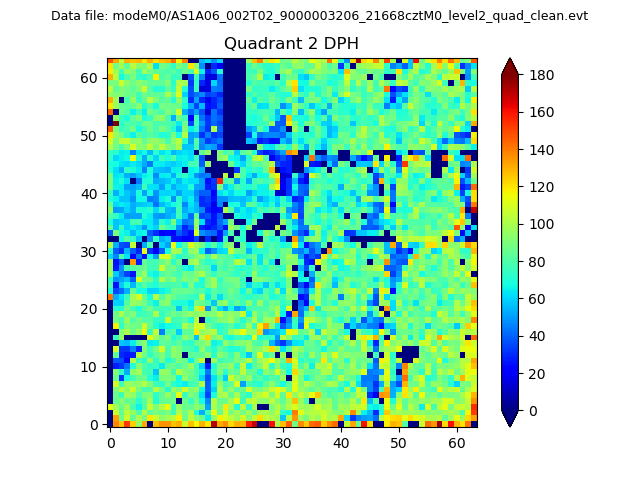
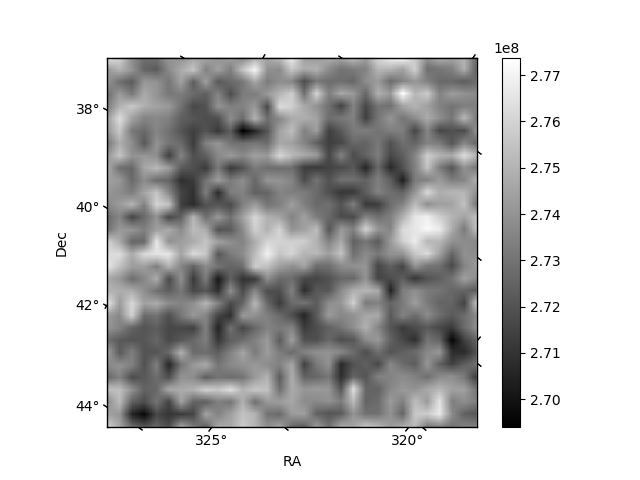
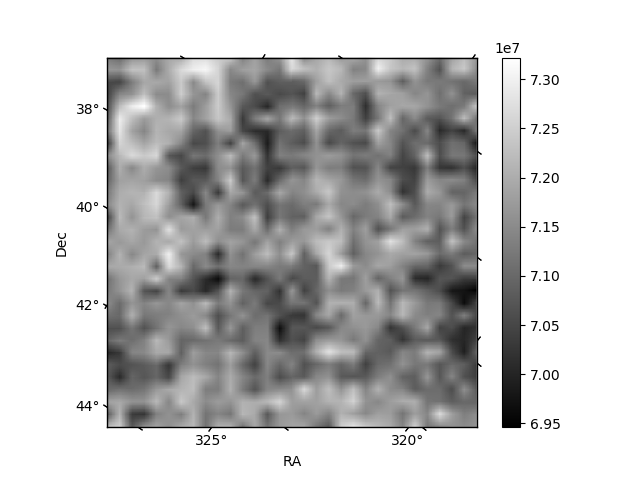
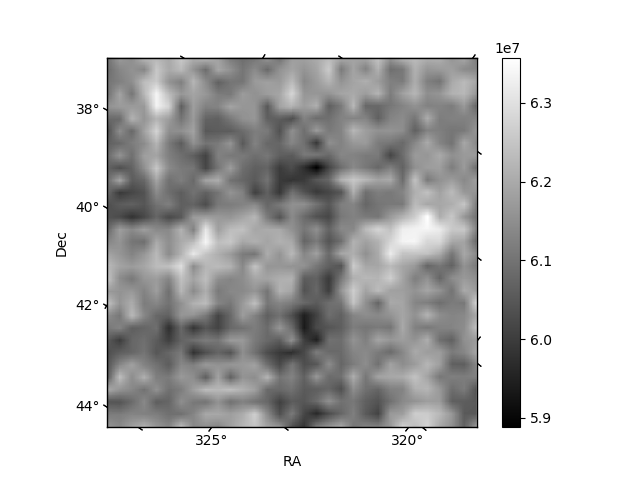
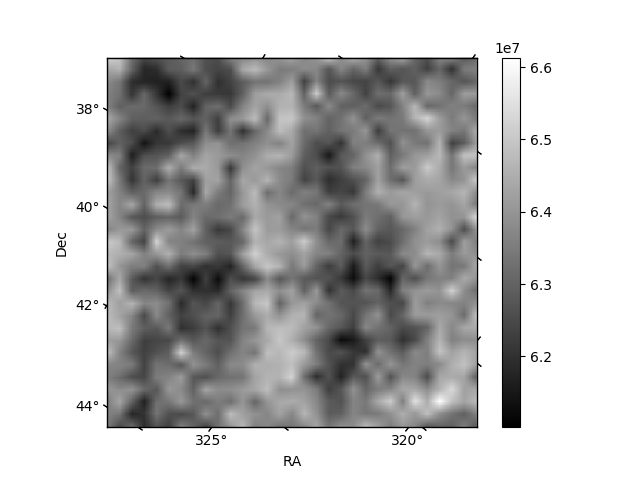
Histogram calculated using DETX and DETY for each event in the final _common_clean file
| Quadrant A | 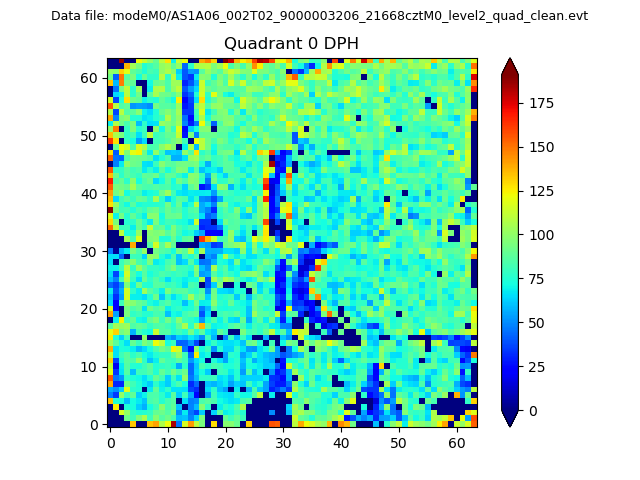 |
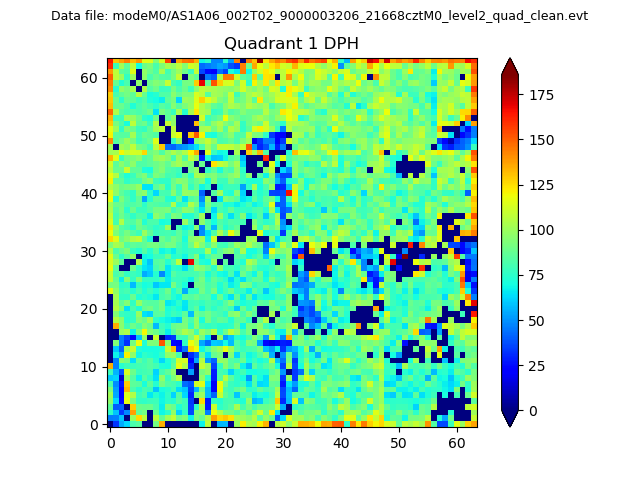 |
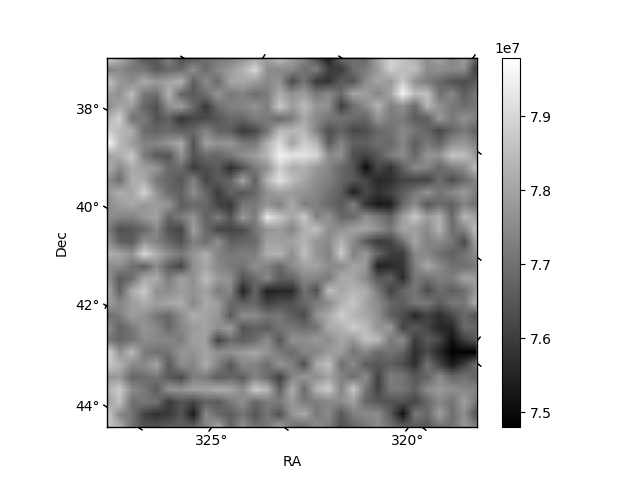
Quadrant B |
|---|---|---|---|
| Quadrant D | 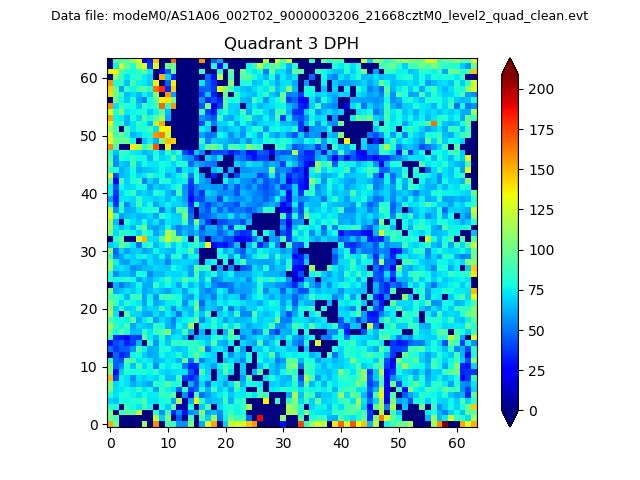 |
 |
Quadrant C |
| Plot type | Count rate plots | Images |
|---|---|---|
| Comparison with Poisson distribution Blue bars denote a histogram of data divided into 1 sec bins. Red curve is a Poisson curve with rate = median count rate of data. |
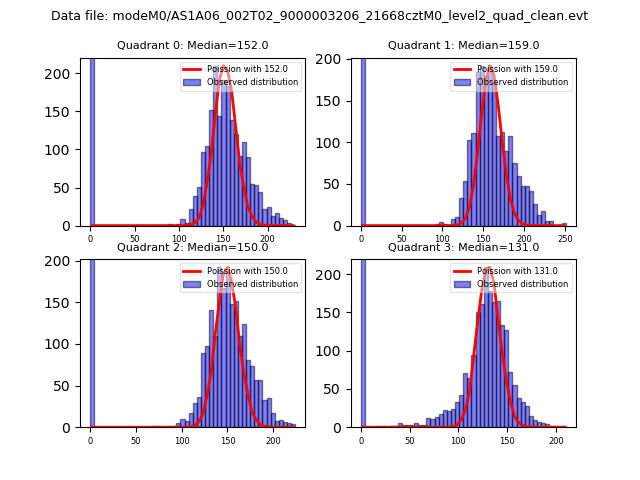 |
 |
| Quadrant-wise count rates Data is divided into 100 sec bins |
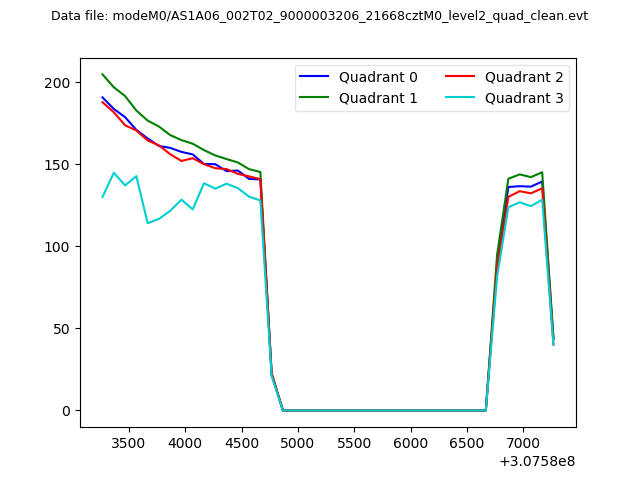 |
|
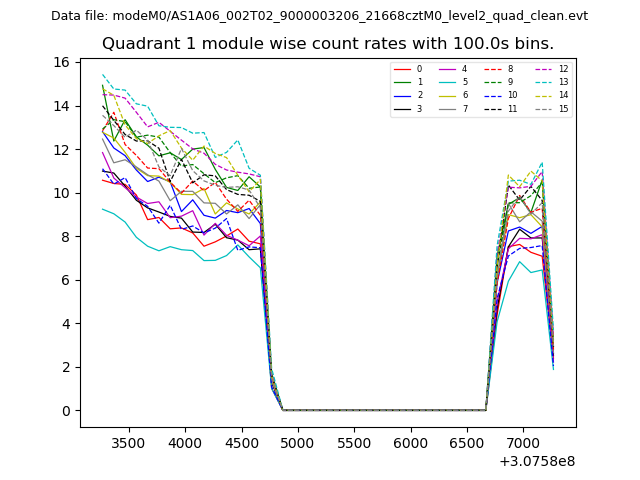
| Module-wise count rates for Quadrant A Data is divided into 100 sec bins |
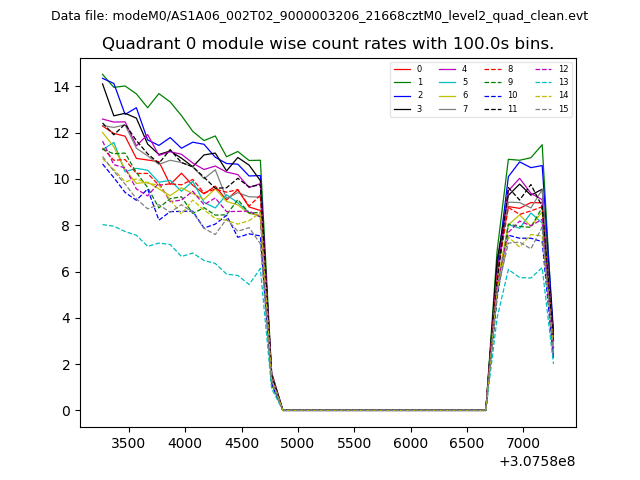 |
 |
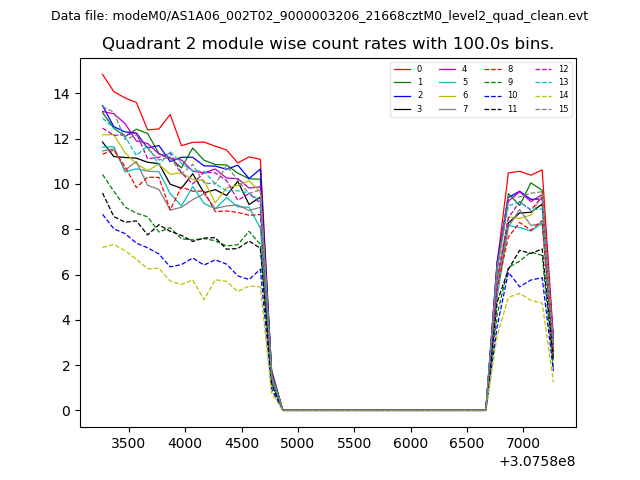
| Module-wise count rates for Quadrant B Data is divided into 100 sec bins |
 |
 |
| Module-wise count rates for Quadrant C Data is divided into 100 sec bins |
 |
 |
| Module-wise count rates for Quadrant D Data is divided into 100 sec bins |
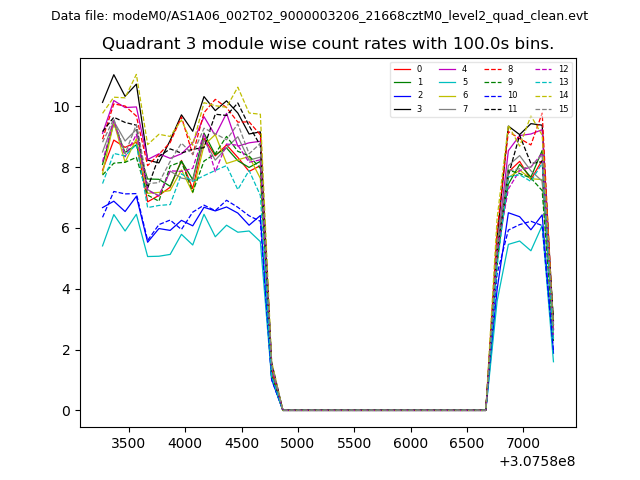 |
 |
| Parameter | Plot |
|---|---|
| CZT HV Monitor | 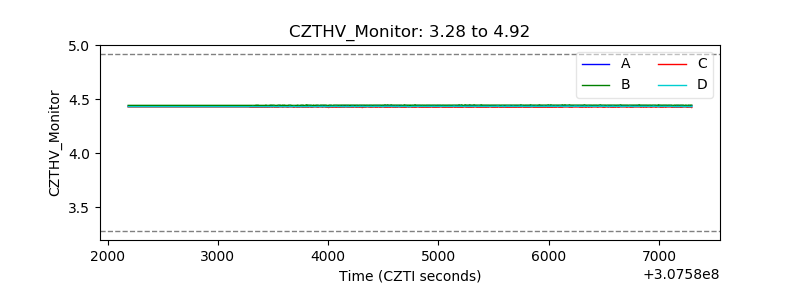 |
| D_VDD | 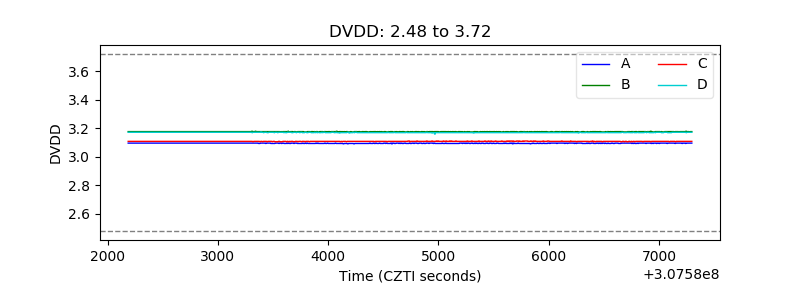 |
| Temperature 1 | 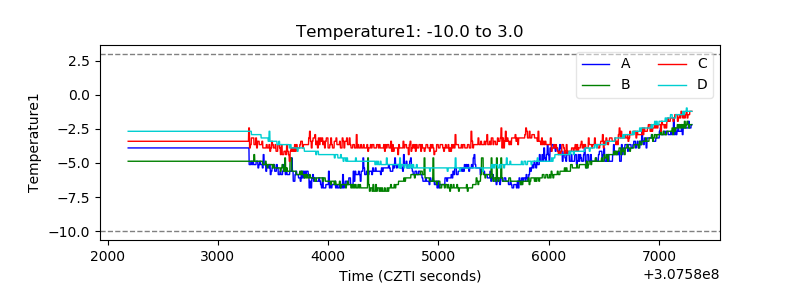 |
| Veto HV Monitor | 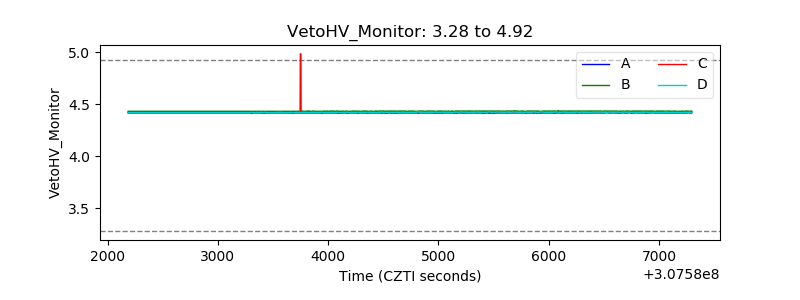 |
| Veto LLD | 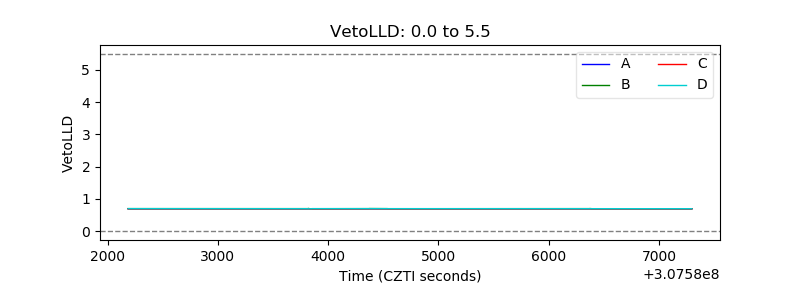 |
| Alpha Counter | 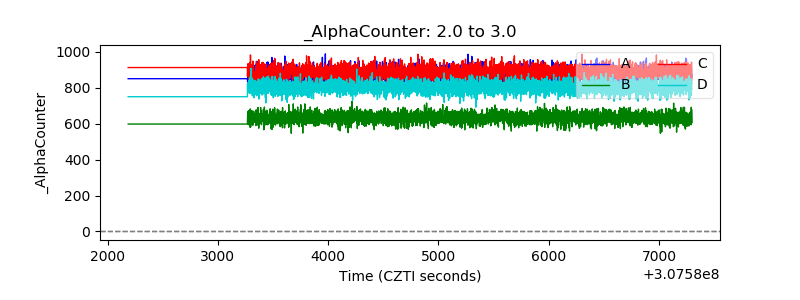 |
| _CPM_Rate | 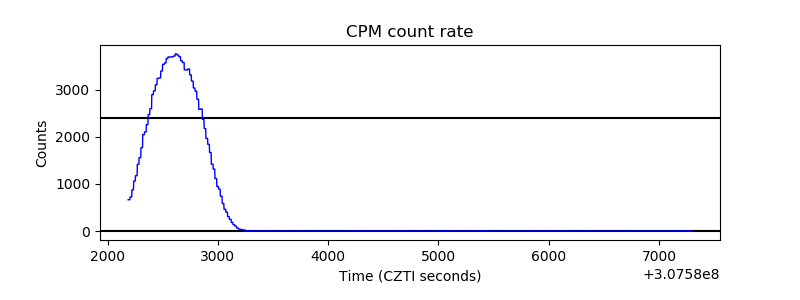 |
| CZT Counter | 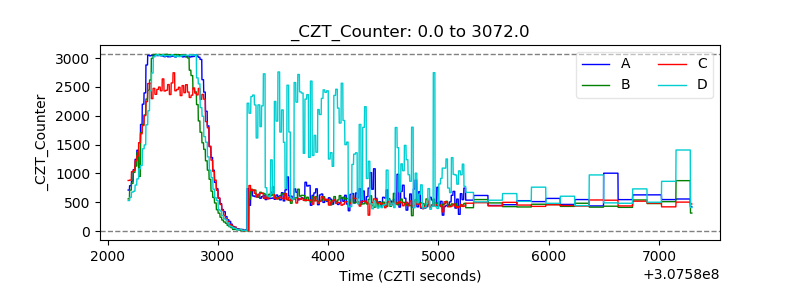 |
| +2.5 Volts monitor |  |
| +5 Volts monitor |  |
| _ROLL_ROT | 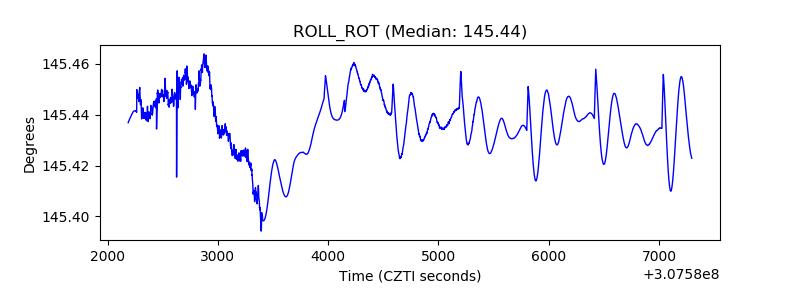 |
| _Roll_DEC | 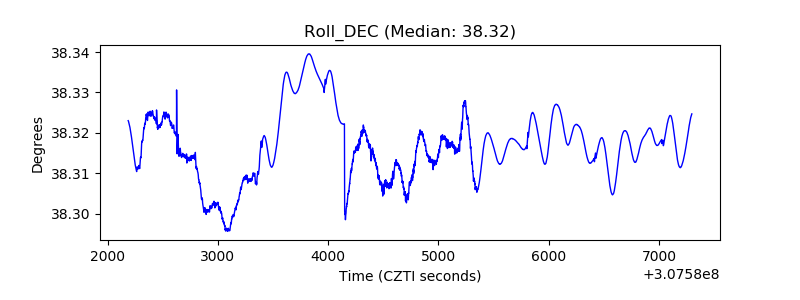 |
| _Roll_RA | 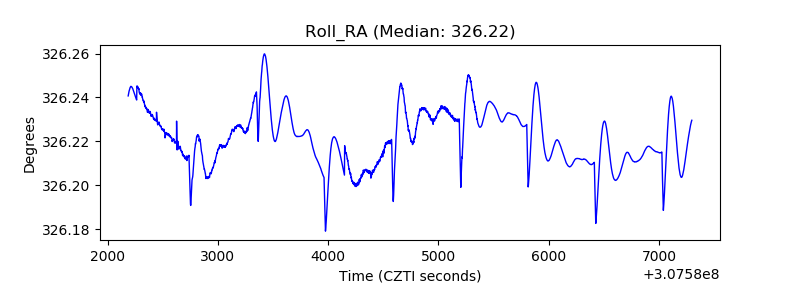 |
| Veto Counter | 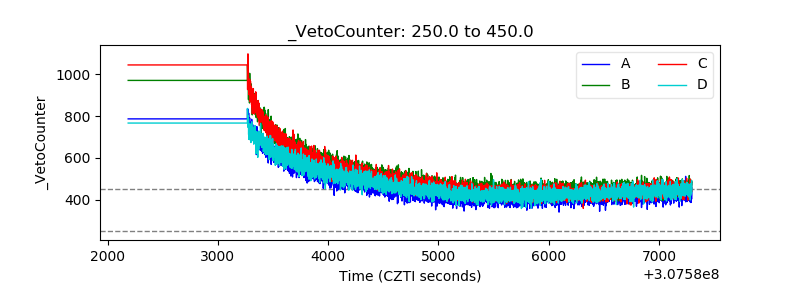 |