| Param | Original file | Final file |
|---|---|---|
| Filename | modeM0/AS1T03_143T01_9000003208cztM0_level2.fits | modeM0/AS1T03_143T01_9000003208cztM0_level2_quad_clean.evt |
| Size (bytes) | 832,337,280 | 702,555,840 |
| Size | 793.8 MB | 670.0 MB |
| Events in quadrant A | 5,221,966 | 4,156,826 |
| Events in quadrant B | 4,983,058 | 4,155,277 |
| Events in quadrant C | 5,090,898 | 3,964,768 |
| Events in quadrant D | 4,204,100 | 3,293,095 |
| Mode SS | |||
|---|---|---|---|
| Quadrant | BADHDUFLAG | Total packets | Discarded packets |
| A | 0 | 1694 | 0 |
| B | 0 | 1694 | 0 |
| C | 0 | 1694 | 0 |
| D | 0 | 1694 | 0 |
| Mode M9 | |||
|---|---|---|---|
| Quadrant | BADHDUFLAG | Total packets | Discarded packets |
| A | 0 | 149 | 0 |
| B | 0 | 149 | 0 |
| C | 0 | 149 | 0 |
| D | 0 | 149 | 0 |
| Mode M0 | |||
|---|---|---|---|
| Quadrant | BADHDUFLAG | Total packets | Discarded packets |
| A | 0 | 176535 | 0 |
| B | 0 | 184586 | 0 |
| C | 0 | 177643 | 0 |
| D | 0 | 262981 | 0 |
| Quadrant | Total seconds | Saturated seconds | Saturation percentage |
|---|---|---|---|
| A | 83214 | 924 | 1.110390% |
| B | 83214 | 1545 | 1.856659% |
| C | 83213 | 1452 | 1.744920% |
| D | 83214 | 7439 | 8.939602% |
Noise dominated data is calculated using 1-second bins in cleaned event files. If a bin has >2000 counts, and if more than 50% of those come from <1% of pixels, then it is considered to be noise-dominated and hence unusable.
| Quadrant | # 1 sec bins | Bins with >0 counts | Bins with >2000 counts | High rate bins dominated by noise | Noise dominated (total time) | Noise dominated (detector-on time) | Marked lightcurve |
|---|---|---|---|---|---|---|---|
| A | 96778 | 83214 | 0 | 0 | 0.00% | 0.00% |  |
| B | 96778 | 83212 | 0 | 0 | 0.00% | 0.00% |  |
| C | 96778 | 83214 | 0 | 0 | 0.00% | 0.00% |  |
| D | 96778 | 83078 | 0 | 0 | 0.00% | 0.00% |  |
Top three noisy pixels from each quadrant. If the there are fewer than three noisy pixels in the level2.evt file, extra rows are filled as -1
| Pixel properties | Quadrant properties | ||||||
|---|---|---|---|---|---|---|---|
| Quadrant | DetID | PixID | Counts | Sigma | Mean | Median | Sigma |
| A | 0 | 29 | 4949 | 10.96 | 1359 | 1278 | 335.0 |
| A | 7 | 110 | 4311 | 9.05 | 1359 | 1278 | 335.0 |
| A | 0 | 30 | 3831 | 7.62 | 1359 | 1278 | 335.0 |
| B | 2 | 9 | 4034 | 10.73 | 1322 | 1261 | 258.5 |
| B | 2 | 8 | 3396 | 8.26 | 1322 | 1261 | 258.5 |
| B | 5 | 128 | 3241 | 7.66 | 1322 | 1261 | 258.5 |
| C | 1 | 80 | 3834 | 7.51 | 1344 | 1257 | 343.3 |
| C | 1 | 81 | 3749 | 7.26 | 1344 | 1257 | 343.3 |
| C | 12 | 241 | 3549 | 6.68 | 1344 | 1257 | 343.3 |
| D | 3 | 14 | 3098 | 6.29 | 1203 | 1095 | 318.4 |
| D | 6 | 67 | 3055 | 6.15 | 1203 | 1095 | 318.4 |
| D | 10 | 189 | 3002 | 5.99 | 1203 | 1095 | 318.4 |
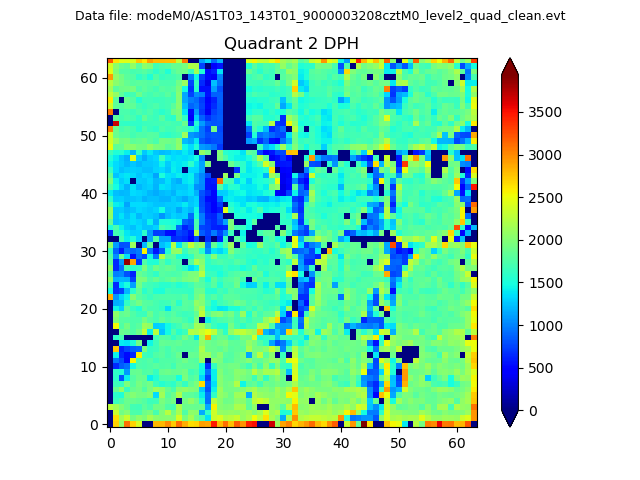
Histogram calculated using DETX and DETY for each event in the final _common_clean file
| Quadrant A | 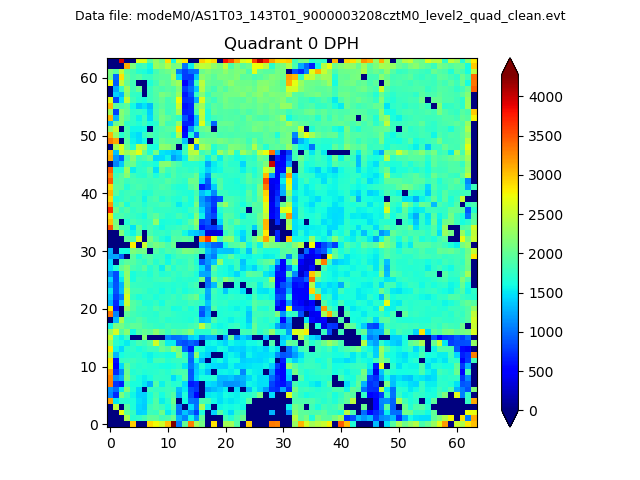 |
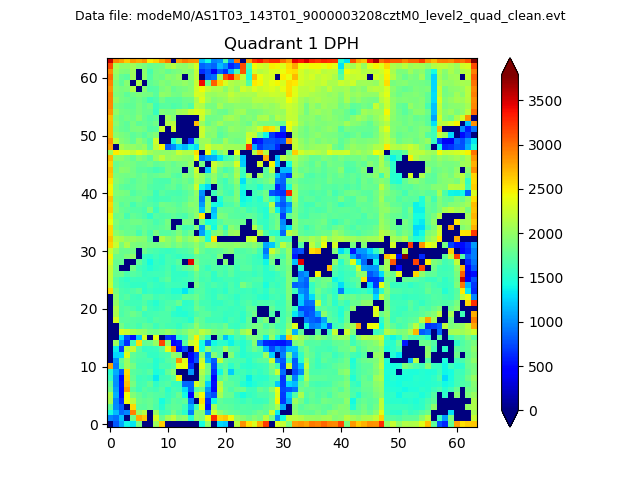 |
Quadrant B |
|---|---|---|---|
| Quadrant D | 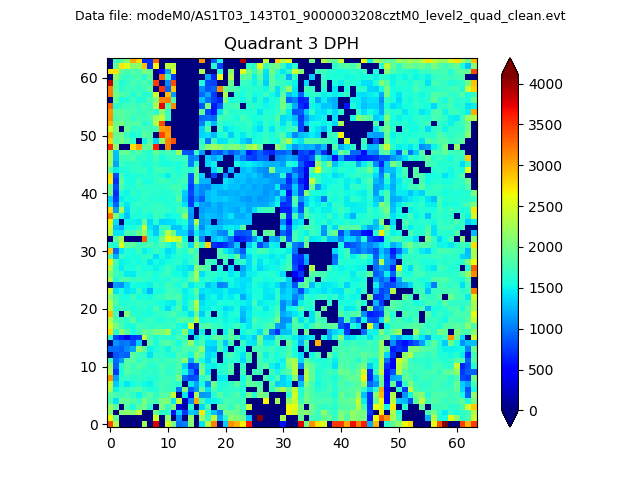 |
 |
Quadrant C |
| Plot type | Count rate plots | Images |
|---|---|---|
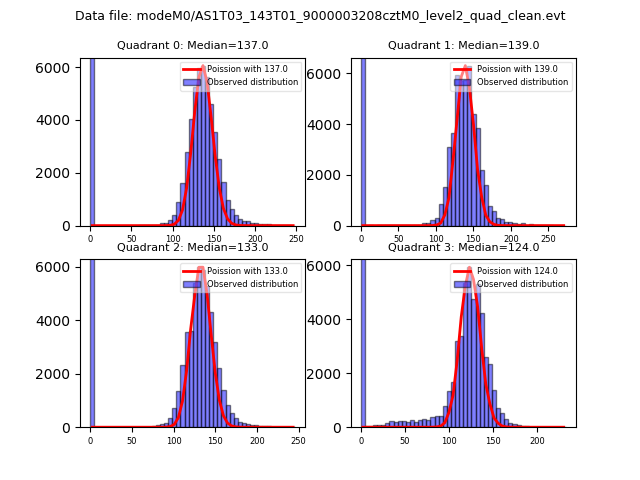
| Comparison with Poisson distribution Blue bars denote a histogram of data divided into 1 sec bins. Red curve is a Poisson curve with rate = median count rate of data. |
 |
 |
| Quadrant-wise count rates Data is divided into 100 sec bins |
 |
|
| Module-wise count rates for Quadrant A Data is divided into 100 sec bins |
 |
 |
| Module-wise count rates for Quadrant B Data is divided into 100 sec bins |
 |
 |
| Module-wise count rates for Quadrant C Data is divided into 100 sec bins |
 |
 |
| Module-wise count rates for Quadrant D Data is divided into 100 sec bins |
 |
 |
| Parameter | Plot |
|---|---|
| CZT HV Monitor |  |
| D_VDD |  |
| Temperature 1 |  |
| Veto HV Monitor |  |
| Veto LLD | 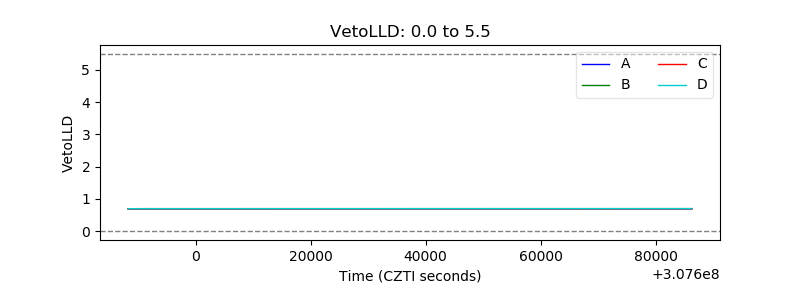 |
| Alpha Counter |  |
| _CPM_Rate |  |
| CZT Counter |  |
| +2.5 Volts monitor |  |
| +5 Volts monitor |  |
| _ROLL_ROT |  |
| _Roll_DEC |  |
| _Roll_RA |  |
| Veto Counter |  |