| Param | Original file | Final file |
|---|---|---|
| Filename | modeM0/AS1T03_143T01_9000003208_21668cztM0_level2.evt | modeM0/AS1T03_143T01_9000003208_21668cztM0_level2_quad_clean.evt |
| Size (bytes) | 139,976,640 | 4,328,640 |
| Size | 133.5 MB | 4.1 MB |
| Events in quadrant A | 1,137,489 | 5,682 |
| Events in quadrant B | 869,315 | 6,223 |
| Events in quadrant C | 840,051 | 5,837 |
| Events in quadrant D | 1,292,468 | 5,500 |
| Mode SS | |||
|---|---|---|---|
| Quadrant | BADHDUFLAG | Total packets | Discarded packets |
| A | 0 | 28 | 0 |
| B | 0 | 28 | 0 |
| C | 0 | 28 | 0 |
| D | 0 | 28 | 0 |
| Mode M9 | |||
|---|---|---|---|
| Quadrant | BADHDUFLAG | Total packets | Discarded packets |
| A | 0 | 13 | 0 |
| B | 0 | 13 | 0 |
| C | 0 | 13 | 0 |
| D | 0 | 13 | 0 |
| Mode M0 | |||
|---|---|---|---|
| Quadrant | BADHDUFLAG | Total packets | Discarded packets |
| A | 0 | 4431 | 1 |
| B | 0 | 3485 | 1 |
| C | 0 | 3371 | 1 |
| D | 0 | 4819 | 1 |
| Quadrant | Total seconds | Saturated seconds | Saturation percentage |
|---|---|---|---|
| A | 1439 | 17 | 1.181376% |
| B | 1439 | 16 | 1.111883% |
| C | 1439 | 11 | 0.764420% |
| D | 1438 | 56 | 3.894298% |
Noise dominated data is calculated using 1-second bins in cleaned event files. If a bin has >2000 counts, and if more than 50% of those come from <1% of pixels, then it is considered to be noise-dominated and hence unusable.
| Quadrant | # 1 sec bins | Bins with >0 counts | Bins with >2000 counts | High rate bins dominated by noise | Noise dominated (total time) | Noise dominated (detector-on time) | Marked lightcurve |
|---|---|---|---|---|---|---|---|
| A | 1439 | 1439 | 2 | 2 | 0.14% | 0.14% | 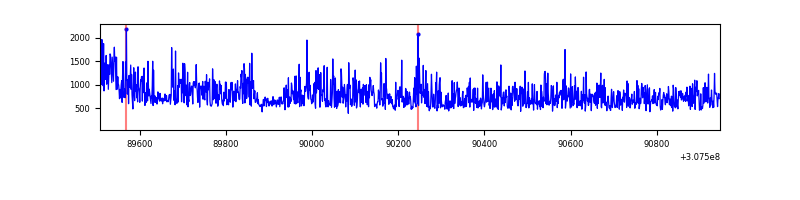 |
| B | 1439 | 1439 | 4 | 4 | 0.28% | 0.28% | 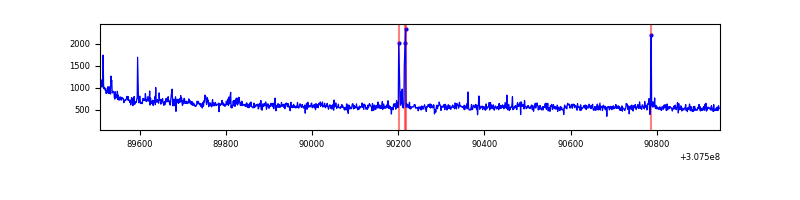 |
| C | 1439 | 1439 | 0 | 0 | 0.00% | 0.00% | 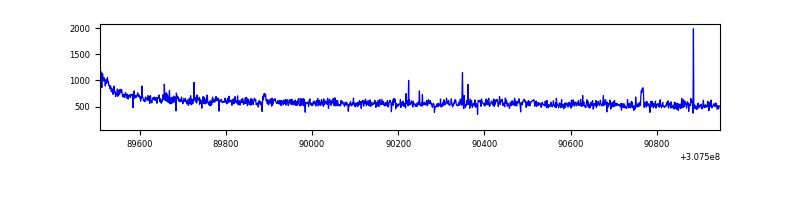 |
| D | 1438 | 1438 | 66 | 66 | 4.59% | 4.59% | 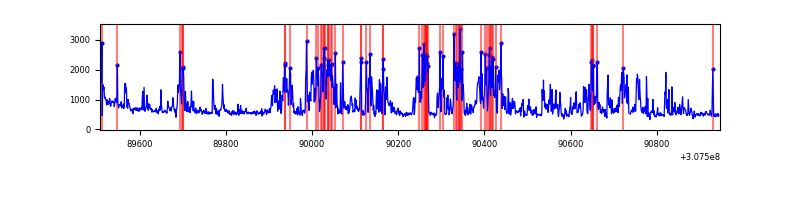 |
Top three noisy pixels from each quadrant. If the there are fewer than three noisy pixels in the level2.evt file, extra rows are filled as -1
| Pixel properties | Quadrant properties | ||||||
|---|---|---|---|---|---|---|---|
| Quadrant | DetID | PixID | Counts | Sigma | Mean | Median | Sigma |
| A | 15 | 236 | 342387 | 8042.55 | 206 | 203 | 42.5 |
| A | 13 | 254 | 2243 | 47.95 | 206 | 203 | 42.5 |
| A | 0 | 226 | 1717 | 35.58 | 206 | 203 | 42.5 |
| B | 3 | 64 | 25307 | 615.61 | 212 | 207 | 40.8 |
| B | 12 | 111 | 4418 | 103.28 | 212 | 207 | 40.8 |
| B | 11 | 111 | 3909 | 90.8 | 212 | 207 | 40.8 |
| C | 14 | 238 | 32432 | 665.84 | 202 | 204 | 48.4 |
| C | 9 | 54 | 10300 | 208.59 | 202 | 204 | 48.4 |
| C | 8 | 208 | 3130 | 60.45 | 202 | 204 | 48.4 |
| D | 7 | 238 | 471474 | 9505.9 | 198 | 193 | 49.6 |
| D | 1 | 52 | 30049 | 602.21 | 198 | 193 | 49.6 |
| D | 2 | 136 | 23677 | 473.68 | 198 | 193 | 49.6 |
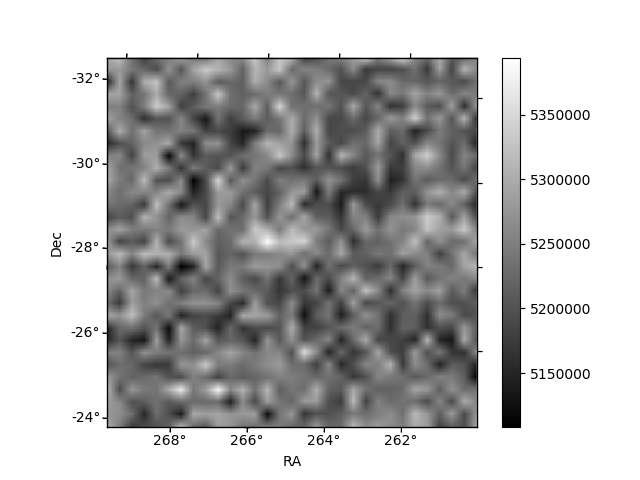
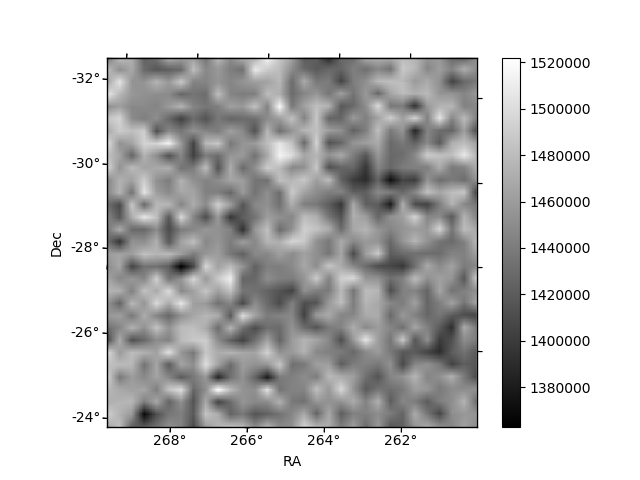
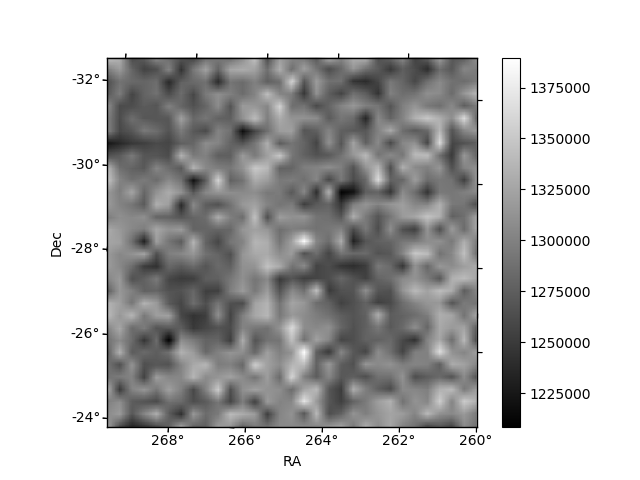
Histogram calculated using DETX and DETY for each event in the final _common_clean file
| Quadrant A | 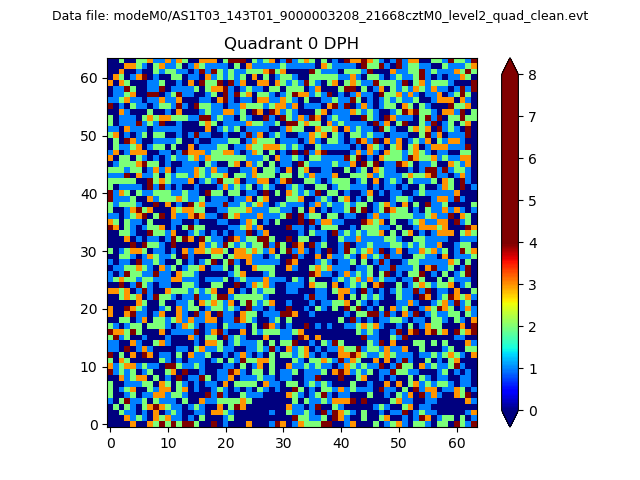 |
 |
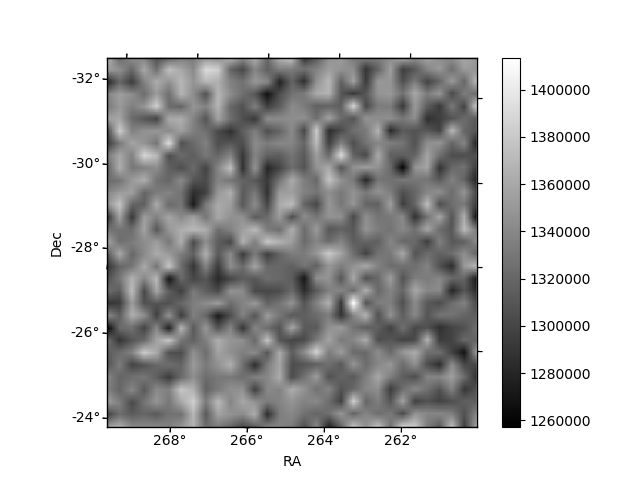
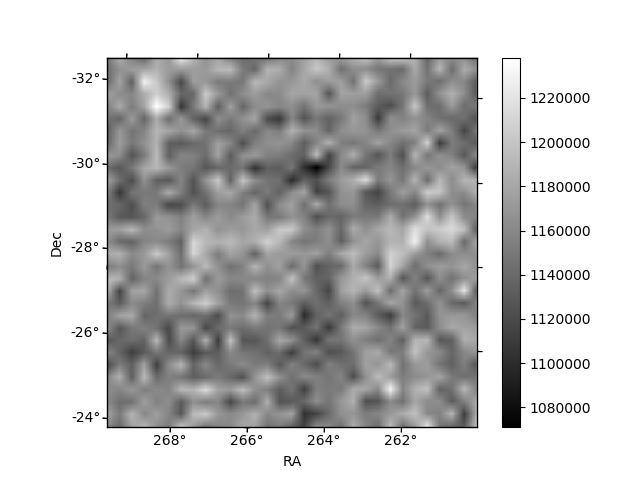
Quadrant B |
|---|---|---|---|
| Quadrant D | 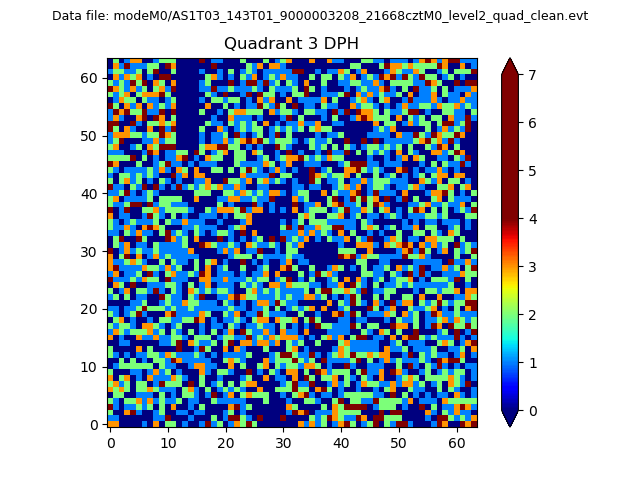 |
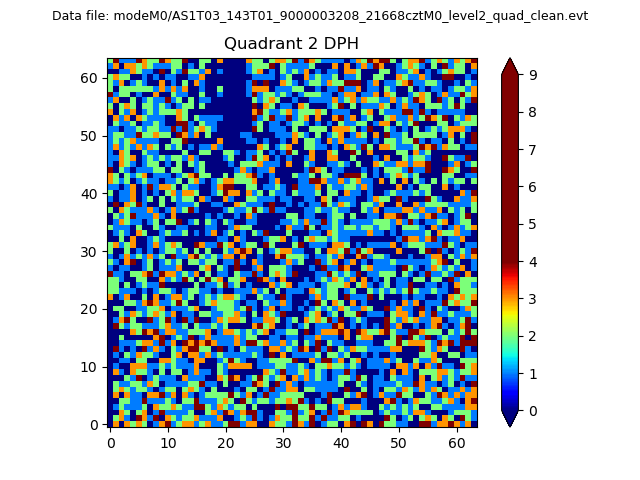 |
Quadrant C |
| Plot type | Count rate plots | Images |
|---|---|---|
| Comparison with Poisson distribution Blue bars denote a histogram of data divided into 1 sec bins. Red curve is a Poisson curve with rate = median count rate of data. |
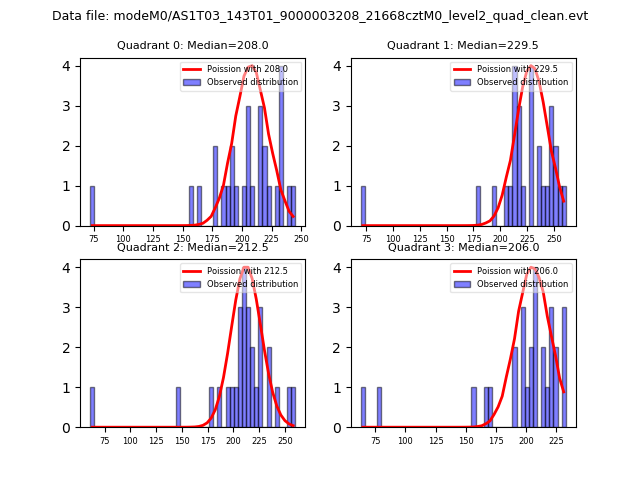 |
 |
| Quadrant-wise count rates Data is divided into 100 sec bins |
 |
|
| Module-wise count rates for Quadrant A Data is divided into 100 sec bins |
 |
 |
| Module-wise count rates for Quadrant B Data is divided into 100 sec bins |
 |
 |
| Module-wise count rates for Quadrant C Data is divided into 100 sec bins |
 |
 |
| Module-wise count rates for Quadrant D Data is divided into 100 sec bins |
 |
 |
| Parameter | Plot |
|---|---|
| CZT HV Monitor |  |
| D_VDD | 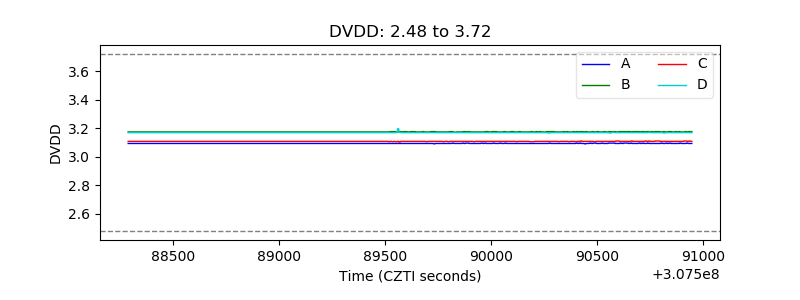 |
| Temperature 1 | 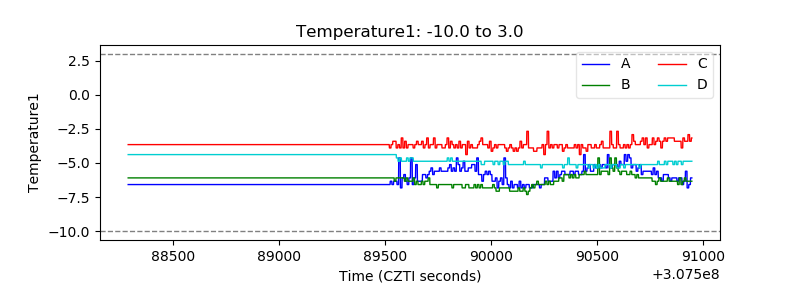 |
| Veto HV Monitor | 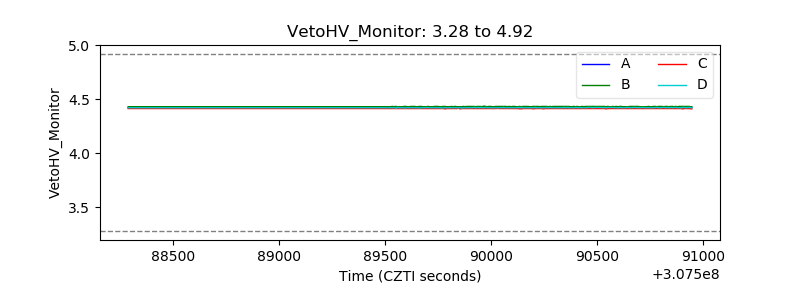 |
| Veto LLD | 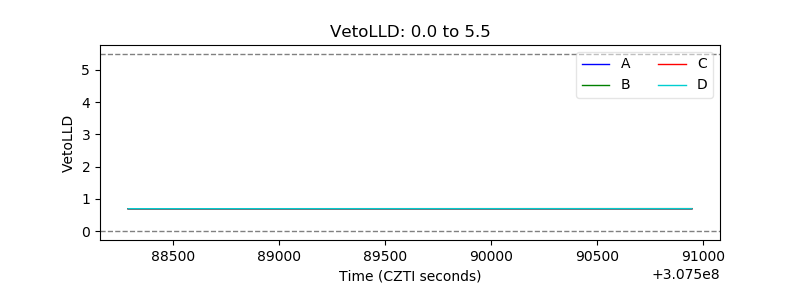 |
| Alpha Counter | 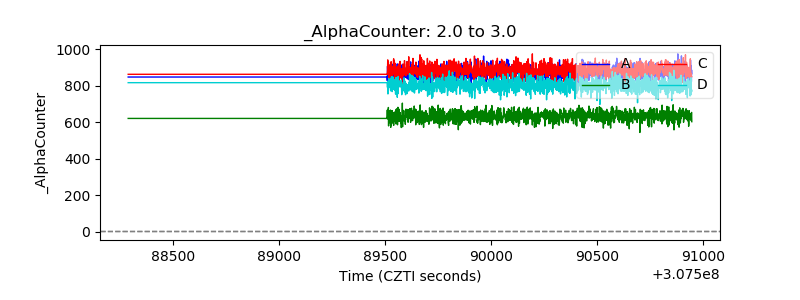 |
| _CPM_Rate | 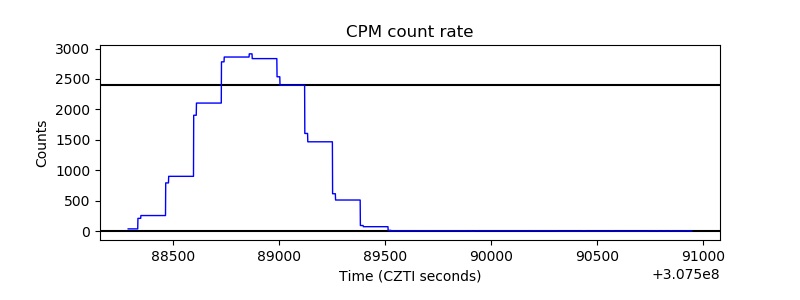 |
| CZT Counter |  |
| +2.5 Volts monitor |  |
| +5 Volts monitor | 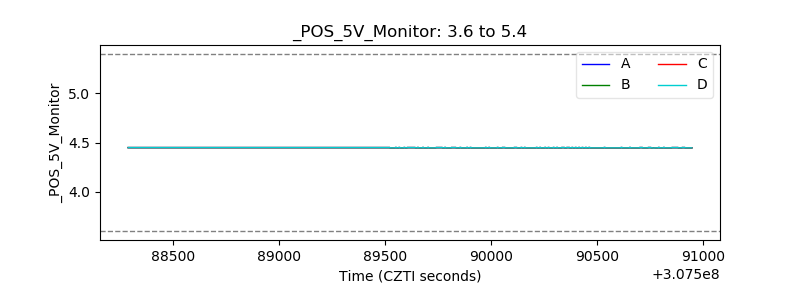 |
| _ROLL_ROT | 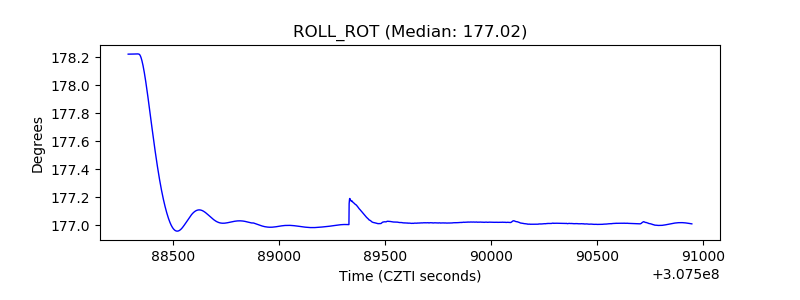 |
| _Roll_DEC | 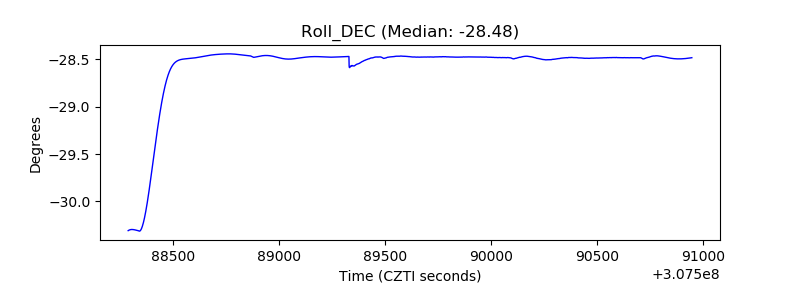 |
| _Roll_RA | 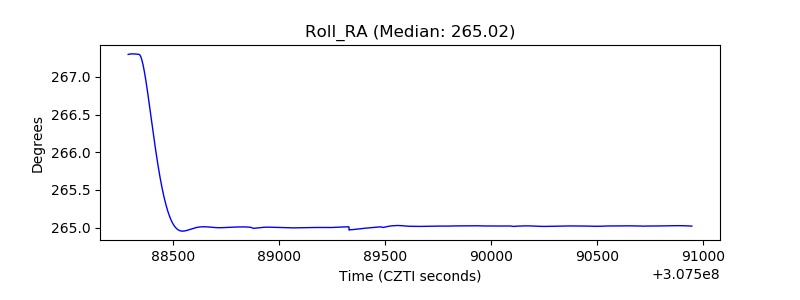 |
| Veto Counter | 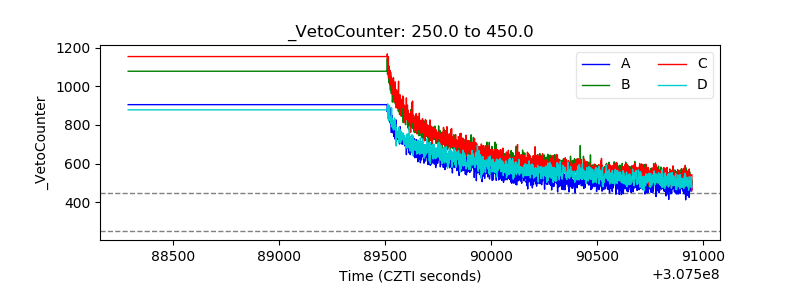 |