| Param | Original file | Final file |
|---|---|---|
| Filename | modeM0/AS1T03_143T01_9000003208_21669cztM0_level2.evt | modeM0/AS1T03_143T01_9000003208_21669cztM0_level2_quad_clean.evt |
| Size (bytes) | 549,774,720 | 64,854,720 |
| Size | 524.3 MB | 61.9 MB |
| Events in quadrant A | 4,284,084 | 386,969 |
| Events in quadrant B | 3,718,967 | 397,431 |
| Events in quadrant C | 3,433,605 | 379,937 |
| Events in quadrant D | 4,783,286 | 355,925 |
| Mode SS | |||
|---|---|---|---|
| Quadrant | BADHDUFLAG | Total packets | Discarded packets |
| A | 0 | 128 | 0 |
| B | 0 | 128 | 0 |
| C | 0 | 128 | 0 |
| D | 0 | 128 | 0 |
| Mode M9 | |||
|---|---|---|---|
| Quadrant | BADHDUFLAG | Total packets | Discarded packets |
| A | 0 | 18 | 0 |
| B | 0 | 19 | 0 |
| C | 0 | 19 | 0 |
| D | 0 | 19 | 0 |
| Mode M0 | |||
|---|---|---|---|
| Quadrant | BADHDUFLAG | Total packets | Discarded packets |
| A | 0 | 16746 | 2 |
| B | 0 | 14751 | 2 |
| C | 0 | 13756 | 2 |
| D | 0 | 18311 | 2 |
| Quadrant | Total seconds | Saturated seconds | Saturation percentage |
|---|---|---|---|
| A | 6354 | 62 | 0.975763% |
| B | 6354 | 102 | 1.605288% |
| C | 6354 | 97 | 1.526597% |
| D | 6354 | 311 | 4.894555% |
Noise dominated data is calculated using 1-second bins in cleaned event files. If a bin has >2000 counts, and if more than 50% of those come from <1% of pixels, then it is considered to be noise-dominated and hence unusable.
| Quadrant | # 1 sec bins | Bins with >0 counts | Bins with >2000 counts | High rate bins dominated by noise | Noise dominated (total time) | Noise dominated (detector-on time) | Marked lightcurve |
|---|---|---|---|---|---|---|---|
| A | 7704 | 6355 | 2 | 2 | 0.03% | 0.03% | 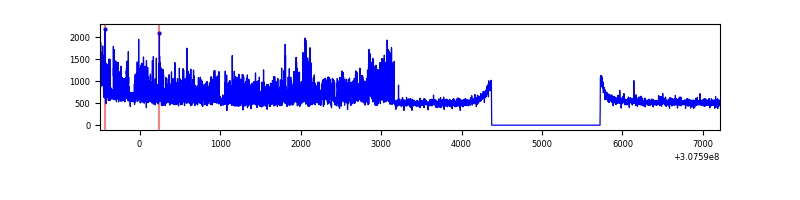 |
| B | 7704 | 6355 | 21 | 21 | 0.27% | 0.33% | 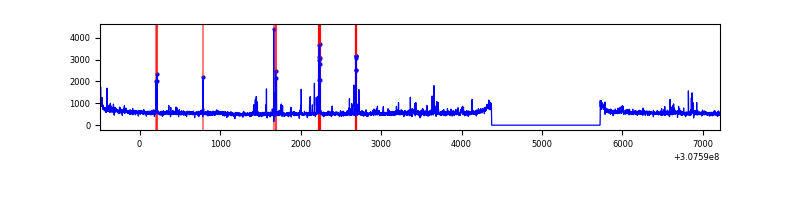 |
| C | 7704 | 6355 | 0 | 0 | 0.00% | 0.00% | 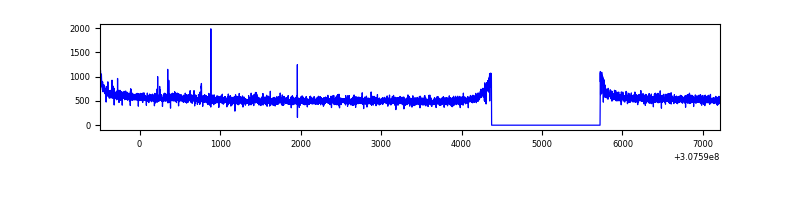 |
| D | 7704 | 6355 | 257 | 257 | 3.34% | 4.04% | 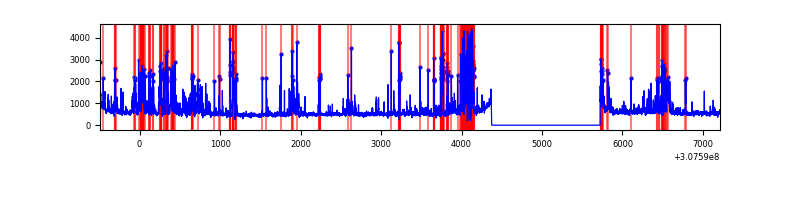 |
Top three noisy pixels from each quadrant. If the there are fewer than three noisy pixels in the level2.evt file, extra rows are filled as -1
| Pixel properties | Quadrant properties | ||||||
|---|---|---|---|---|---|---|---|
| Quadrant | DetID | PixID | Counts | Sigma | Mean | Median | Sigma |
| A | 15 | 236 | 934688 | 5406.43 | 869 | 855 | 172.7 |
| A | 13 | 254 | 9856 | 52.11 | 869 | 855 | 172.7 |
| A | 0 | 226 | 7458 | 38.23 | 869 | 855 | 172.7 |
| B | 3 | 64 | 190097 | 1164.97 | 876 | 856 | 162.4 |
| B | 0 | 229 | 24276 | 144.17 | 876 | 856 | 162.4 |
| B | 0 | 230 | 23974 | 142.31 | 876 | 856 | 162.4 |
| C | 14 | 238 | 134482 | 683.57 | 840 | 848 | 195.5 |
| C | 9 | 54 | 14263 | 68.62 | 840 | 848 | 195.5 |
| C | 13 | 61 | 5917 | 25.93 | 840 | 848 | 195.5 |
| D | 7 | 238 | 889184 | 4443.55 | 829 | 805 | 199.9 |
| D | 1 | 52 | 536747 | 2680.71 | 829 | 805 | 199.9 |
| D | 2 | 136 | 55126 | 271.71 | 829 | 805 | 199.9 |
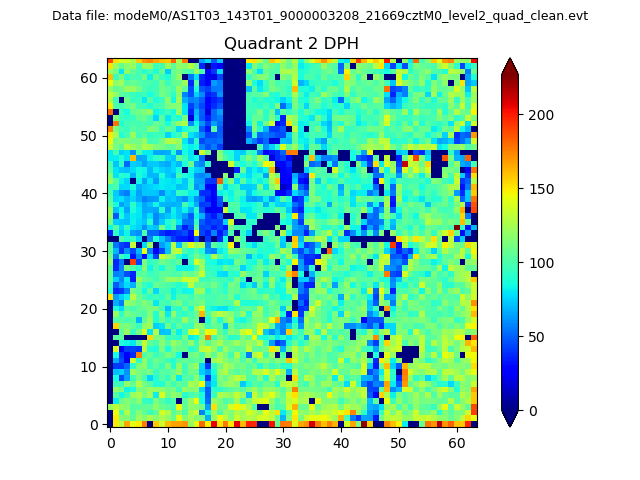
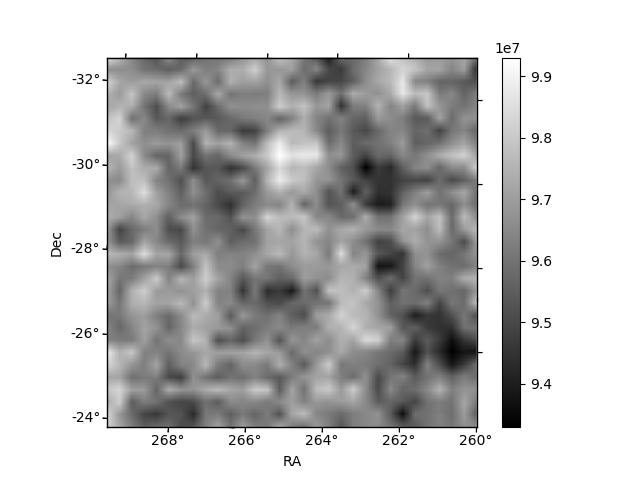
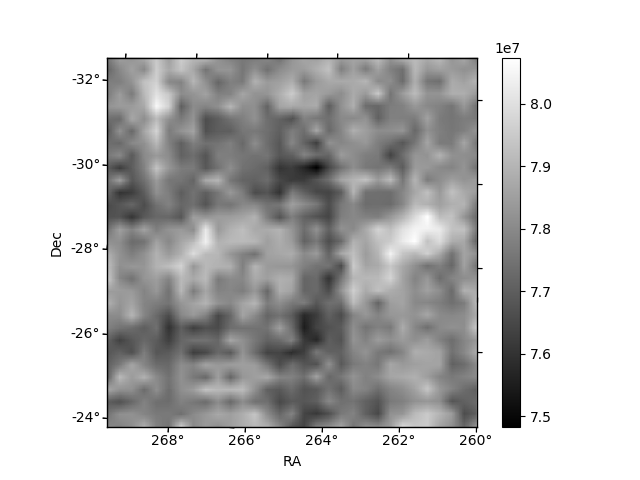
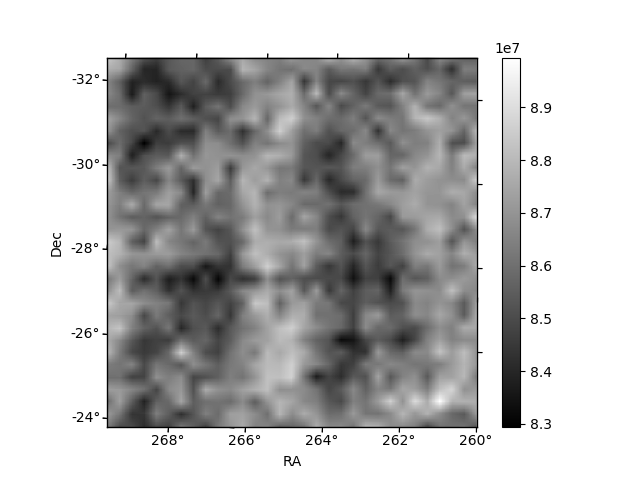
Histogram calculated using DETX and DETY for each event in the final _common_clean file
| Quadrant A | 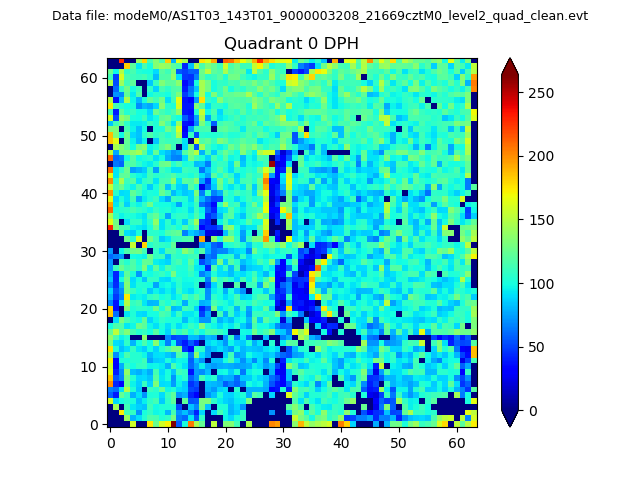 |
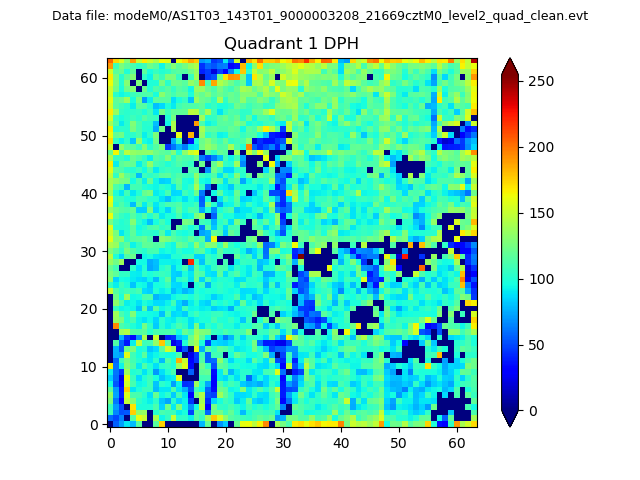 |
Quadrant B |
|---|---|---|---|
| Quadrant D | 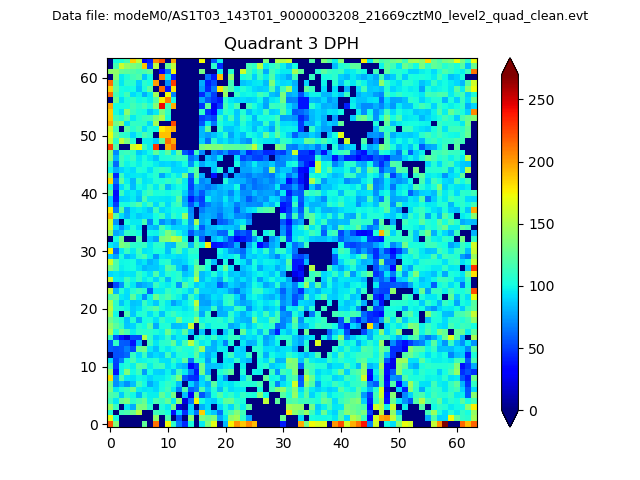 |
 |
Quadrant C |
| Plot type | Count rate plots | Images |
|---|---|---|
| Comparison with Poisson distribution Blue bars denote a histogram of data divided into 1 sec bins. Red curve is a Poisson curve with rate = median count rate of data. |
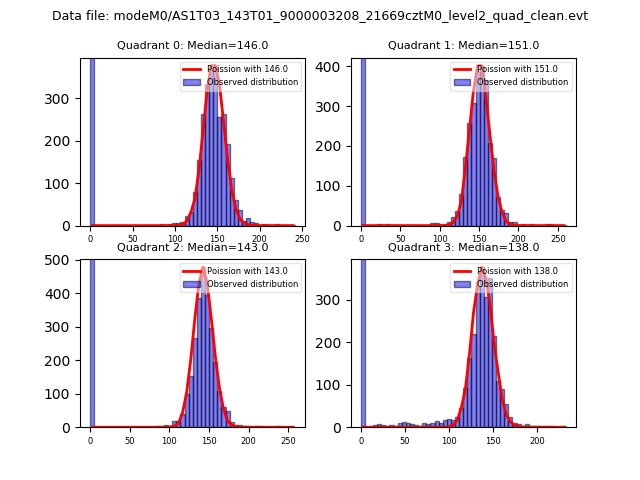 |
 |
| Quadrant-wise count rates Data is divided into 100 sec bins |
 |
|
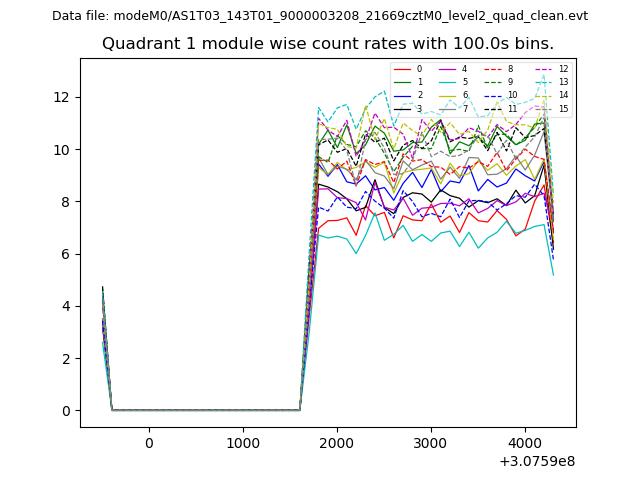
| Module-wise count rates for Quadrant A Data is divided into 100 sec bins |
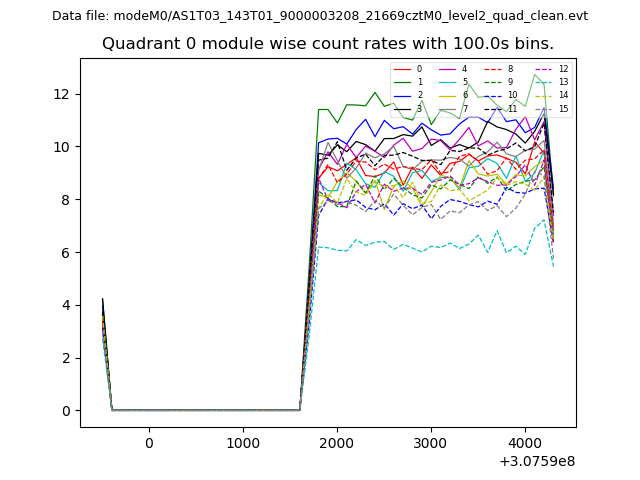 |
 |
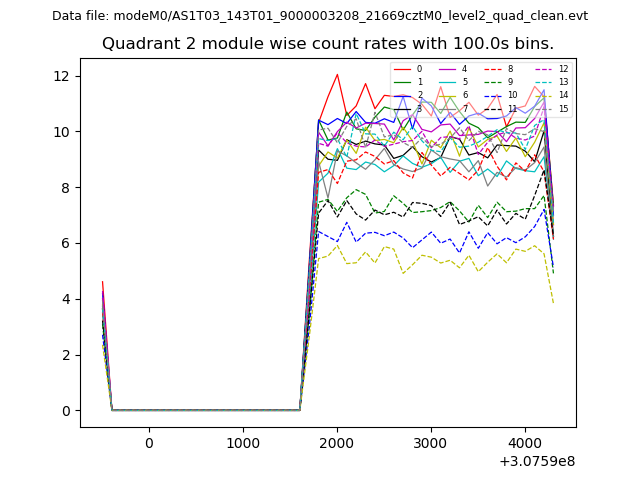
| Module-wise count rates for Quadrant B Data is divided into 100 sec bins |
 |
 |
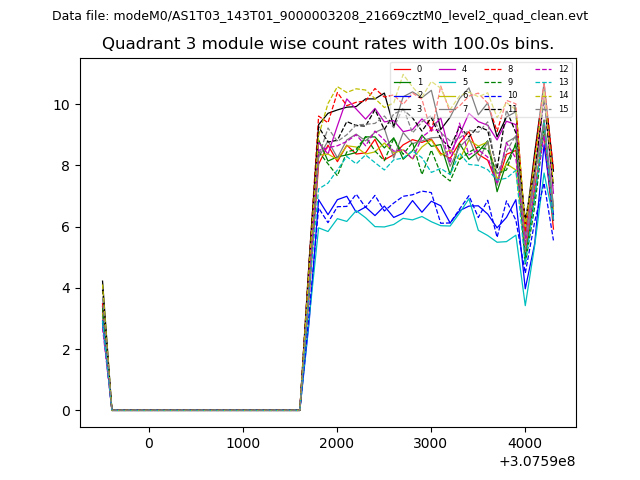
| Module-wise count rates for Quadrant C Data is divided into 100 sec bins |
 |
 |
| Module-wise count rates for Quadrant D Data is divided into 100 sec bins |
 |
 |
| Parameter | Plot |
|---|---|
| CZT HV Monitor | 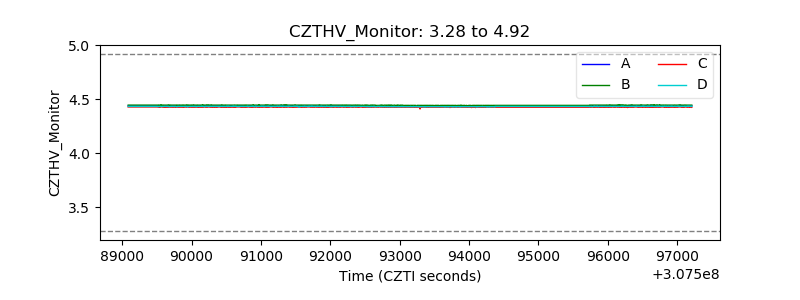 |
| D_VDD | 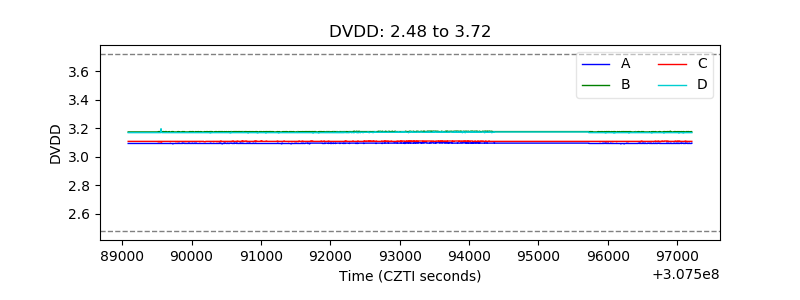 |
| Temperature 1 | 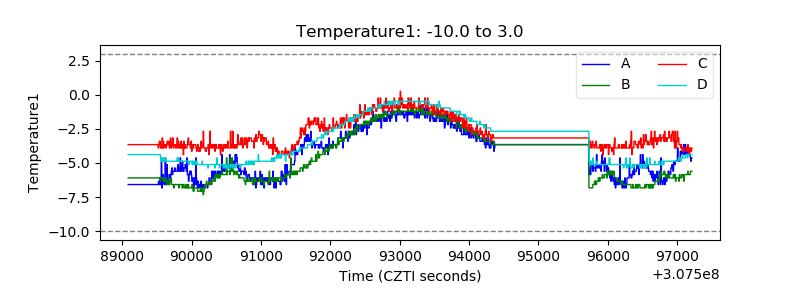 |
| Veto HV Monitor | 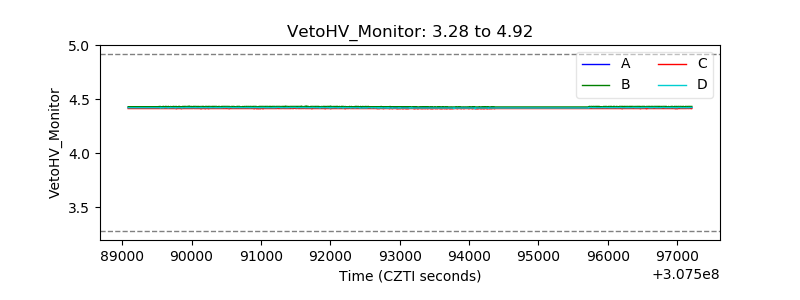 |
| Veto LLD | 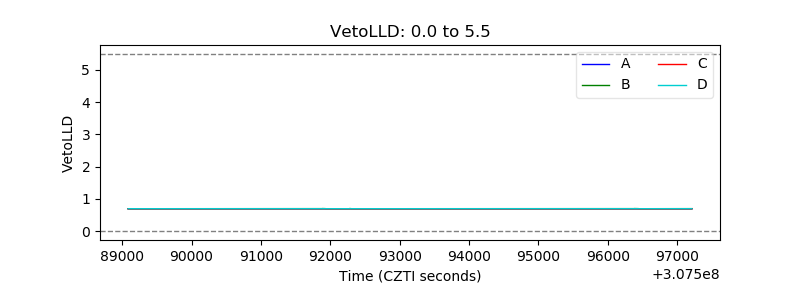 |
| Alpha Counter |  |
| _CPM_Rate |  |
| CZT Counter | 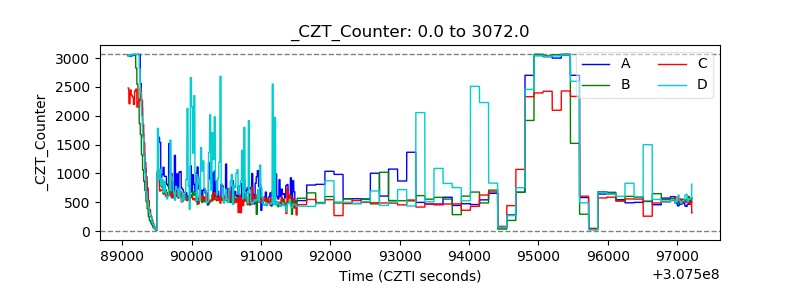 |
| +2.5 Volts monitor |  |
| +5 Volts monitor |  |
| _ROLL_ROT | 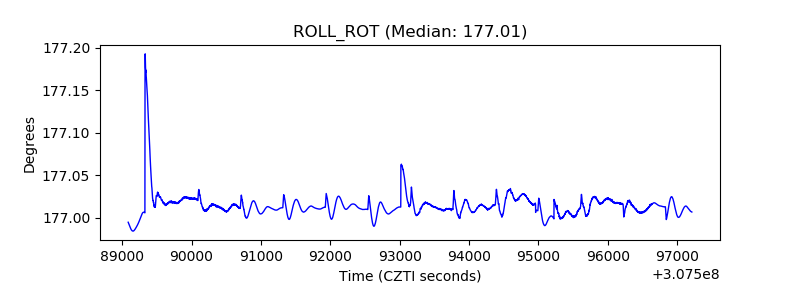 |
| _Roll_DEC | 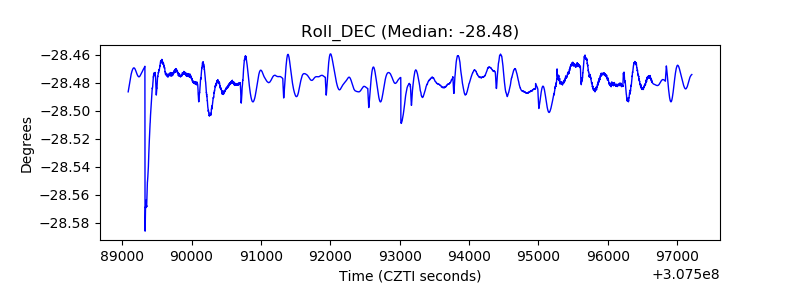 |
| _Roll_RA | 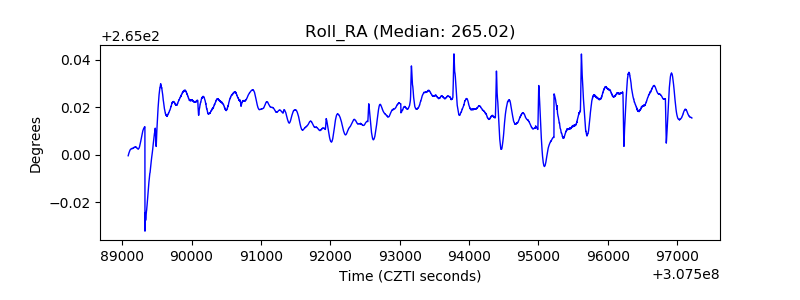 |
| Veto Counter | 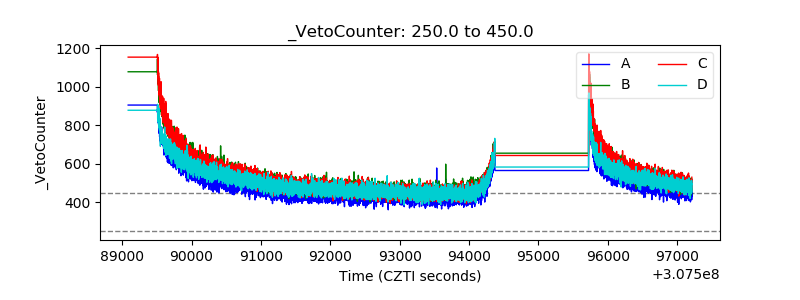 |