| Param | Original file | Final file |
|---|---|---|
| Filename | modeM0/AS1T03_143T01_9000003208_21670cztM0_level2.evt | modeM0/AS1T03_143T01_9000003208_21670cztM0_level2_quad_clean.evt |
| Size (bytes) | 501,220,800 | 73,872,000 |
| Size | 478.0 MB | 70.4 MB |
| Events in quadrant A | 3,243,537 | 459,578 |
| Events in quadrant B | 3,541,575 | 465,894 |
| Events in quadrant C | 3,312,768 | 448,163 |
| Events in quadrant D | 4,656,695 | 425,890 |
| Mode SS | |||
|---|---|---|---|
| Quadrant | BADHDUFLAG | Total packets | Discarded packets |
| A | 0 | 126 | 0 |
| B | 0 | 126 | 0 |
| C | 0 | 126 | 0 |
| D | 0 | 126 | 0 |
| Mode M9 | |||
|---|---|---|---|
| Quadrant | BADHDUFLAG | Total packets | Discarded packets |
| A | 0 | 12 | 0 |
| B | 0 | 12 | 0 |
| C | 0 | 12 | 0 |
| D | 0 | 12 | 0 |
| Mode M0 | |||
|---|---|---|---|
| Quadrant | BADHDUFLAG | Total packets | Discarded packets |
| A | 0 | 13134 | 1 |
| B | 0 | 14050 | 1 |
| C | 0 | 13372 | 1 |
| D | 0 | 18113 | 1 |
| Quadrant | Total seconds | Saturated seconds | Saturation percentage |
|---|---|---|---|
| A | 6271 | 96 | 1.530856% |
| B | 6271 | 149 | 2.376017% |
| C | 6271 | 157 | 2.503588% |
| D | 6271 | 185 | 2.950088% |
Noise dominated data is calculated using 1-second bins in cleaned event files. If a bin has >2000 counts, and if more than 50% of those come from <1% of pixels, then it is considered to be noise-dominated and hence unusable.
| Quadrant | # 1 sec bins | Bins with >0 counts | Bins with >2000 counts | High rate bins dominated by noise | Noise dominated (total time) | Noise dominated (detector-on time) | Marked lightcurve |
|---|---|---|---|---|---|---|---|
| A | 7441 | 6272 | 0 | 0 | 0.00% | 0.00% | 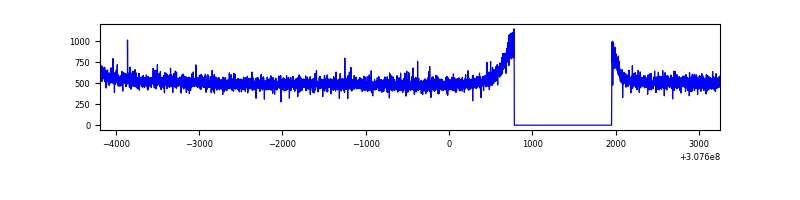 |
| B | 7441 | 6272 | 21 | 21 | 0.28% | 0.33% | 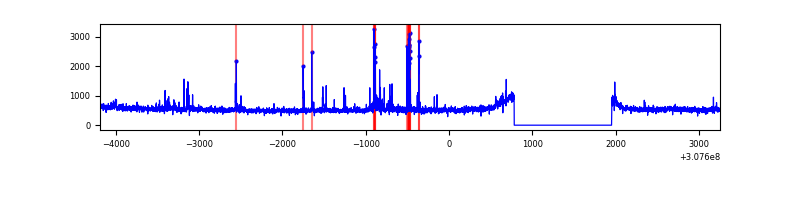 |
| C | 7441 | 6272 | 0 | 0 | 0.00% | 0.00% | 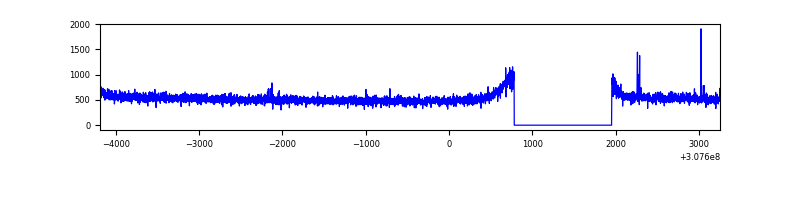 |
| D | 7441 | 6272 | 65 | 65 | 0.87% | 1.04% | 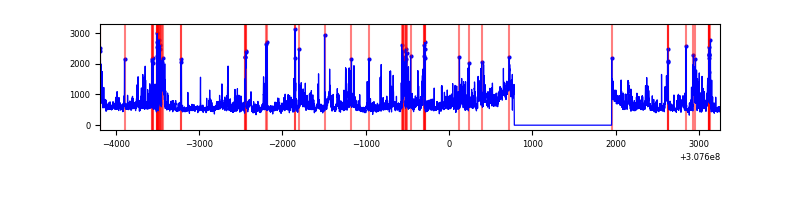 |
Top three noisy pixels from each quadrant. If the there are fewer than three noisy pixels in the level2.evt file, extra rows are filled as -1
| Pixel properties | Quadrant properties | ||||||
|---|---|---|---|---|---|---|---|
| Quadrant | DetID | PixID | Counts | Sigma | Mean | Median | Sigma |
| A | 13 | 254 | 9640 | 51.99 | 842 | 827 | 169.5 |
| A | 0 | 226 | 7142 | 37.25 | 842 | 827 | 169.5 |
| A | 3 | 137 | 6838 | 35.46 | 842 | 827 | 169.5 |
| B | 3 | 64 | 169724 | 1076.76 | 839 | 820 | 156.9 |
| B | 0 | 230 | 32228 | 200.23 | 839 | 820 | 156.9 |
| B | 12 | 111 | 18616 | 113.45 | 839 | 820 | 156.9 |
| C | 14 | 238 | 127411 | 673.69 | 809 | 815 | 187.9 |
| C | 8 | 208 | 15869 | 80.11 | 809 | 815 | 187.9 |
| C | 10 | 22 | 9074 | 43.95 | 809 | 815 | 187.9 |
| D | 7 | 238 | 1098145 | 5535.79 | 813 | 789 | 198.2 |
| D | 1 | 52 | 296900 | 1493.78 | 813 | 789 | 198.2 |
| D | 13 | 153 | 76305 | 380.95 | 813 | 789 | 198.2 |
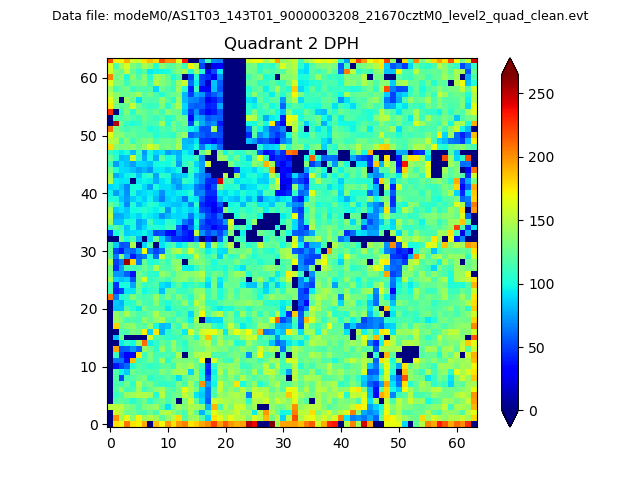
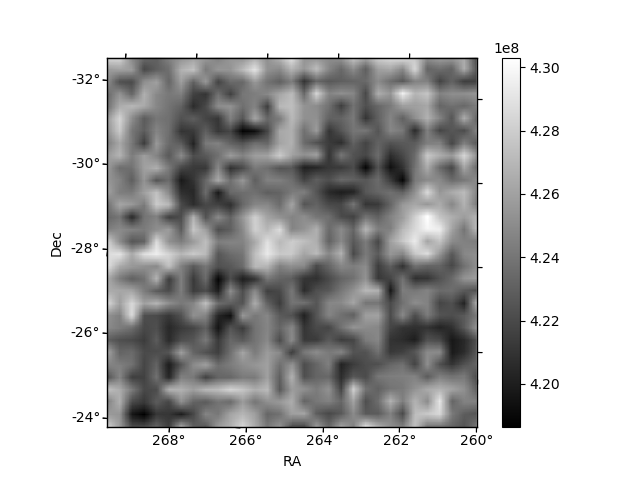
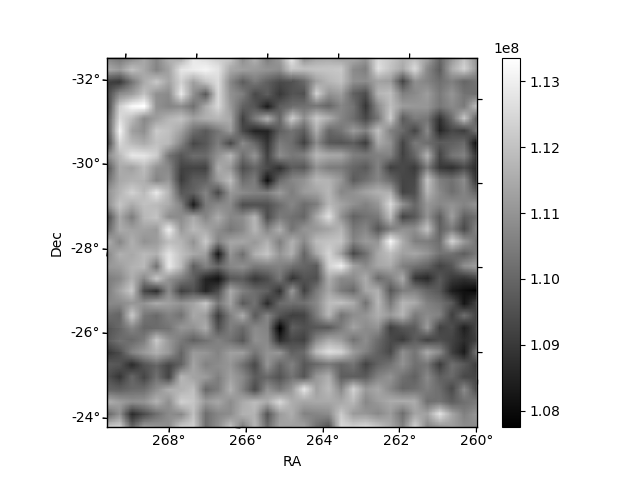
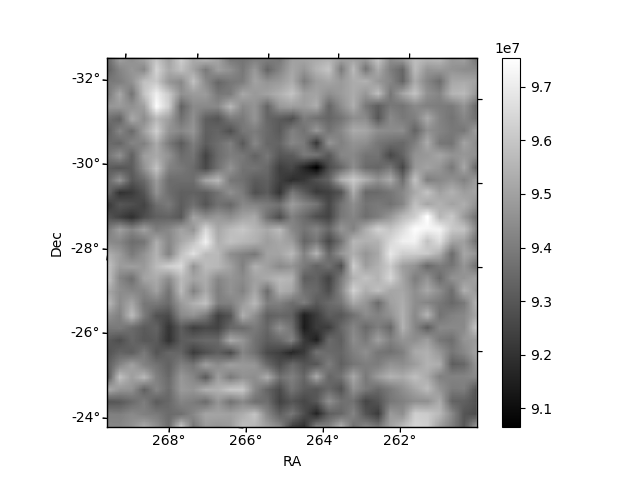
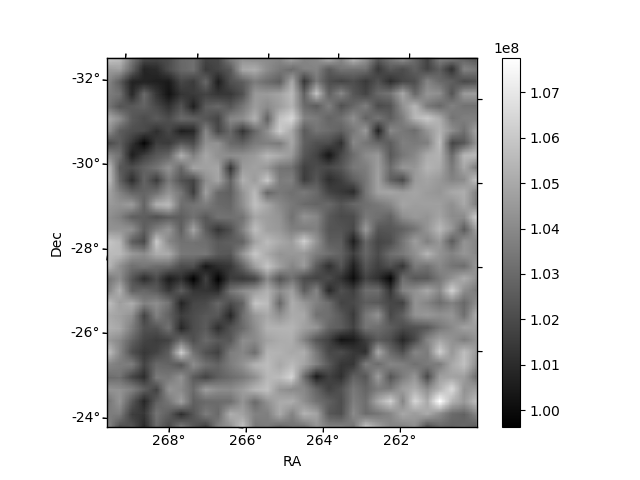
Histogram calculated using DETX and DETY for each event in the final _common_clean file
| Quadrant A | 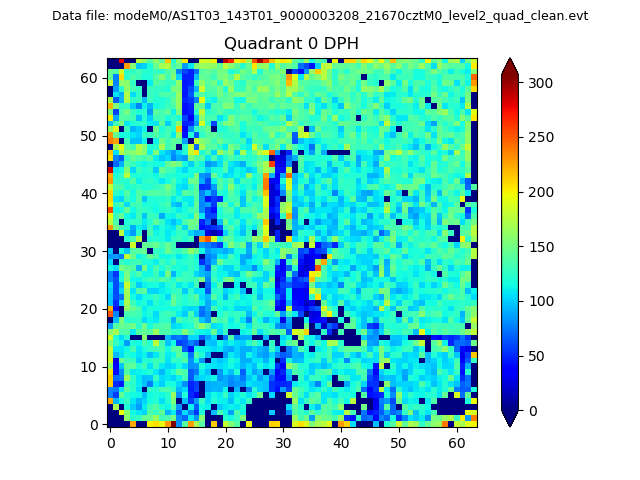 |
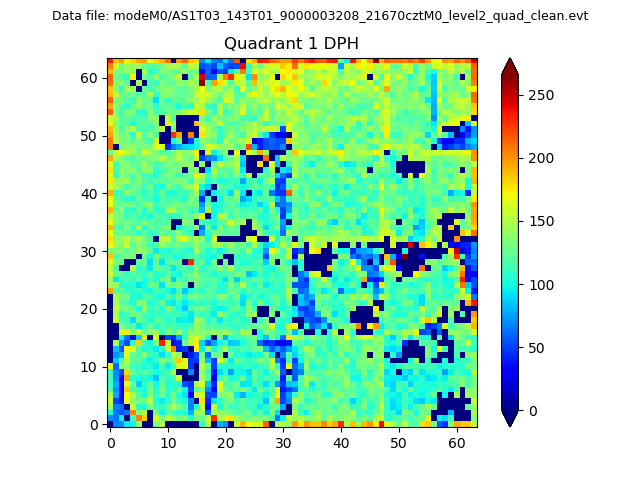 |
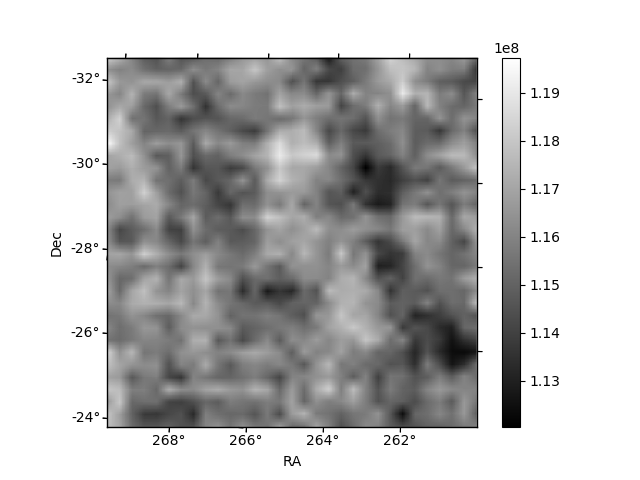
Quadrant B |
|---|---|---|---|
| Quadrant D | 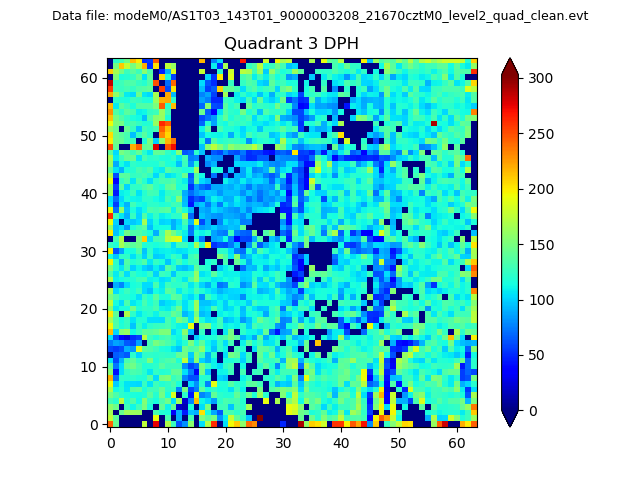 |
 |
Quadrant C |
| Plot type | Count rate plots | Images |
|---|---|---|
| Comparison with Poisson distribution Blue bars denote a histogram of data divided into 1 sec bins. Red curve is a Poisson curve with rate = median count rate of data. |
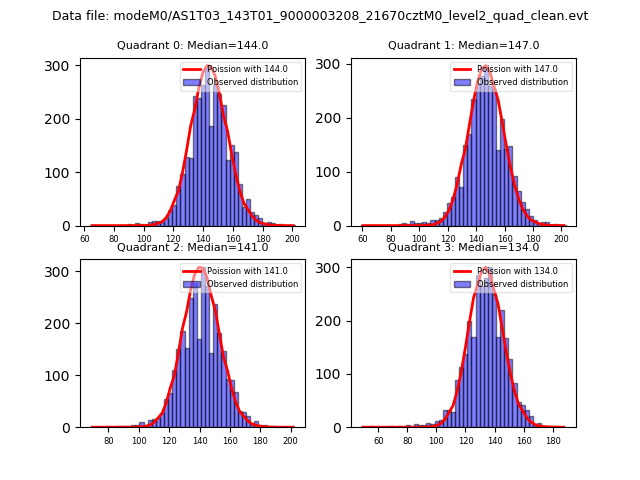 |
 |
| Quadrant-wise count rates Data is divided into 100 sec bins |
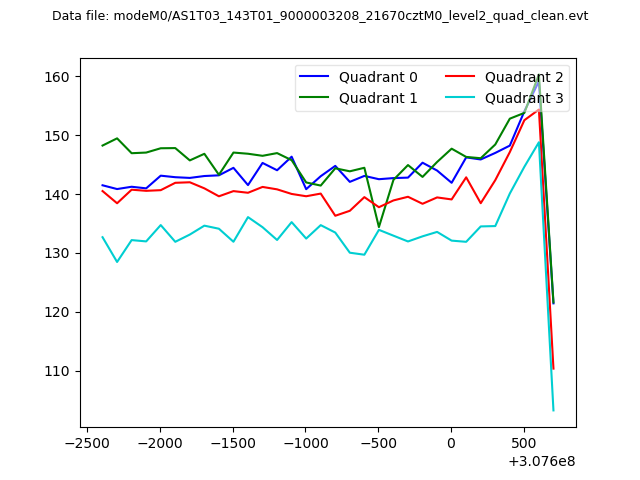 |
|
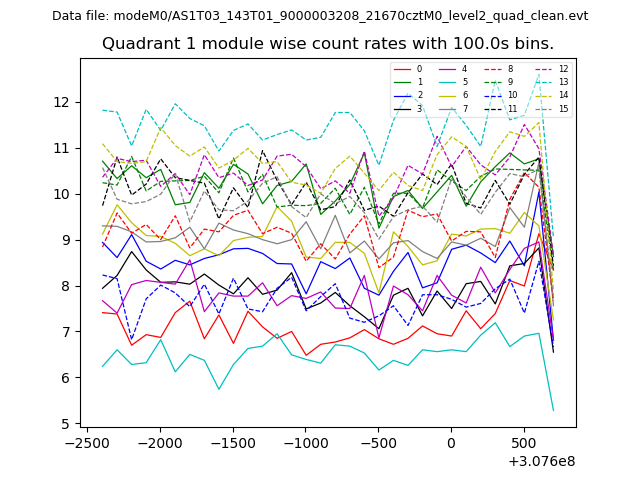
| Module-wise count rates for Quadrant A Data is divided into 100 sec bins |
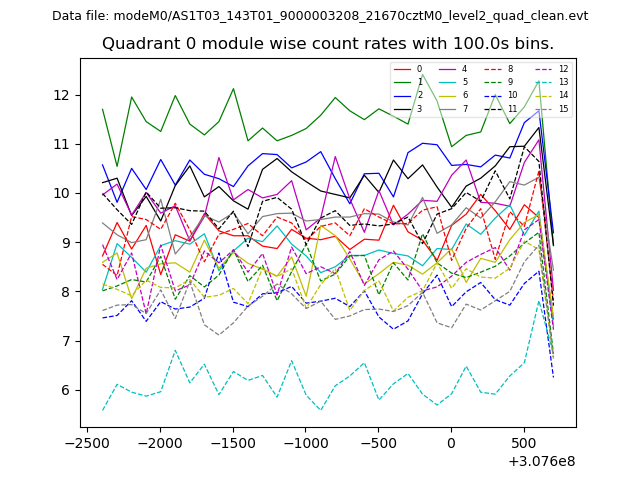 |
 |
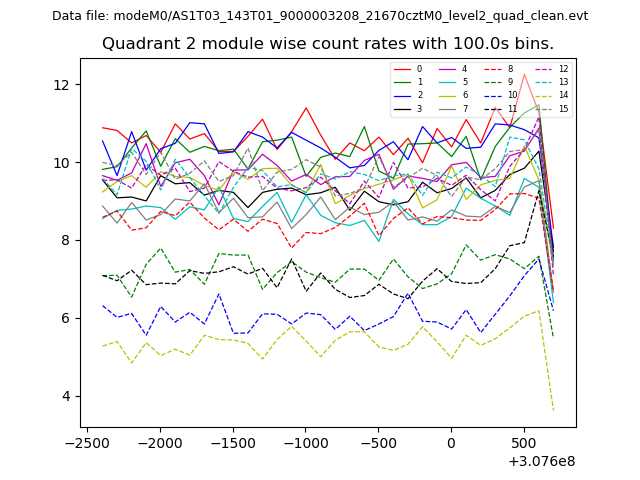
| Module-wise count rates for Quadrant B Data is divided into 100 sec bins |
 |
 |
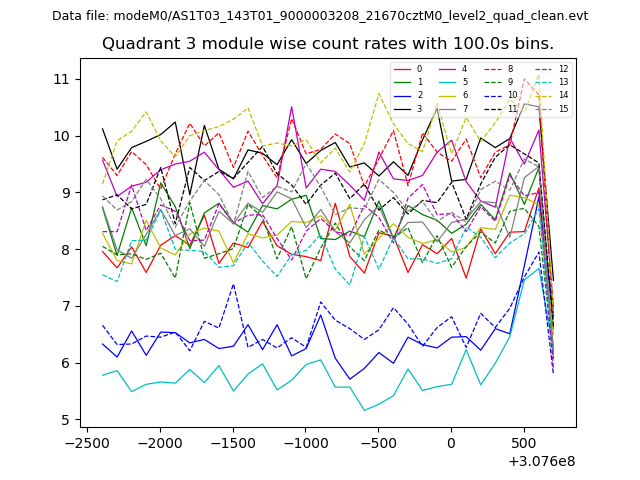
| Module-wise count rates for Quadrant C Data is divided into 100 sec bins |
 |
 |
| Module-wise count rates for Quadrant D Data is divided into 100 sec bins |
 |
 |
| Parameter | Plot |
|---|---|
| CZT HV Monitor |  |
| D_VDD | 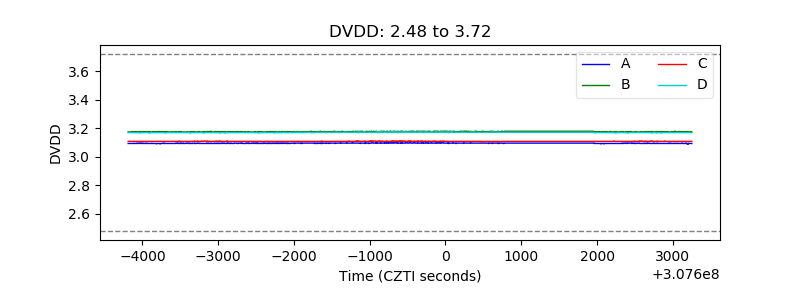 |
| Temperature 1 | 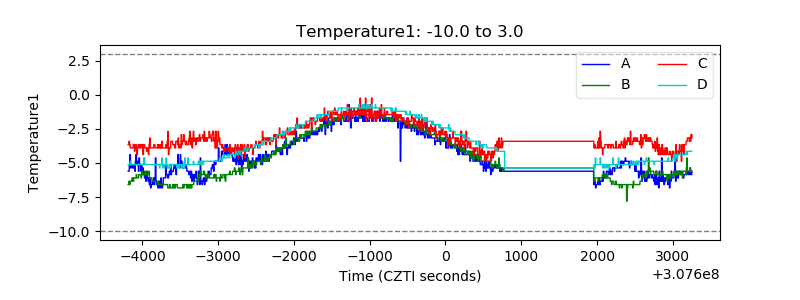 |
| Veto HV Monitor | 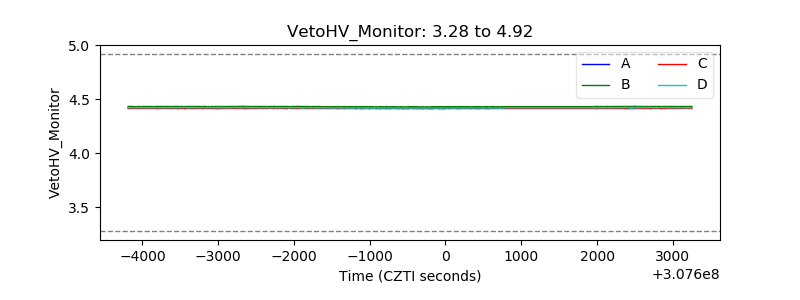 |
| Veto LLD | 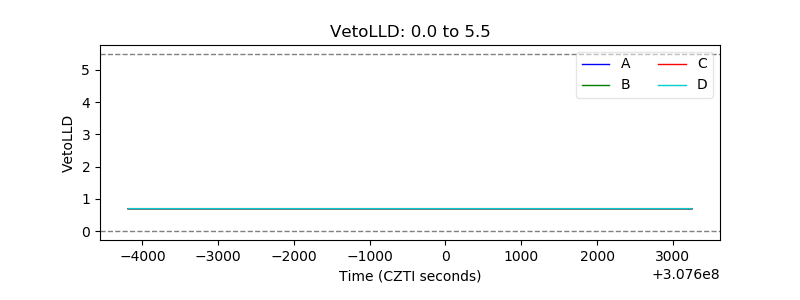 |
| Alpha Counter | 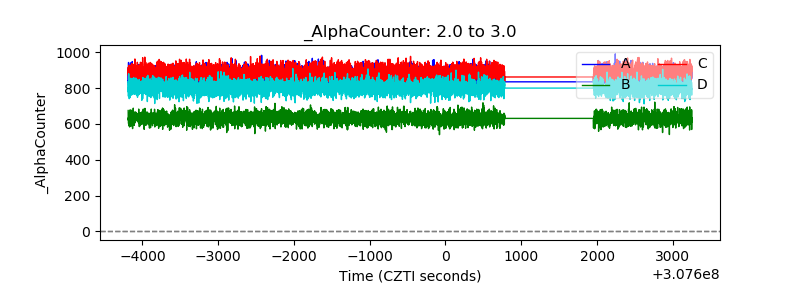 |
| _CPM_Rate | 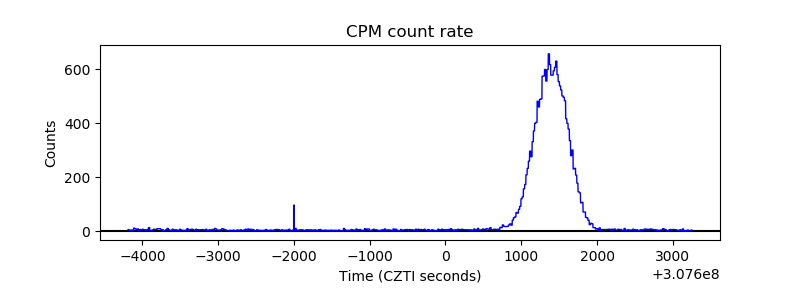 |
| CZT Counter | 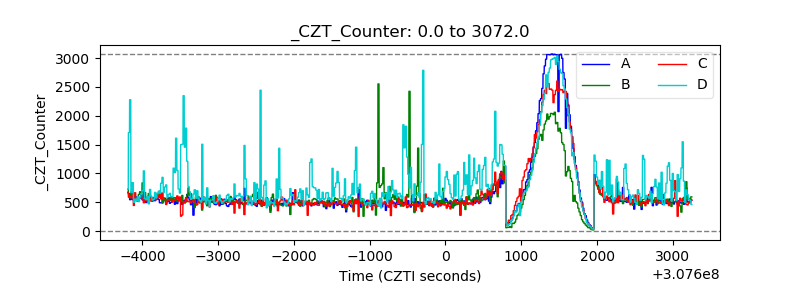 |
| +2.5 Volts monitor |  |
| +5 Volts monitor |  |
| _ROLL_ROT | 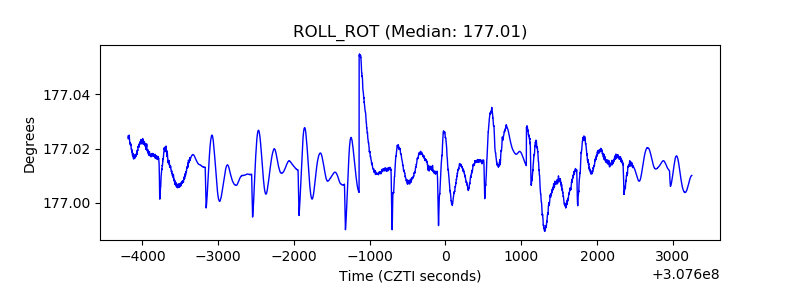 |
| _Roll_DEC | 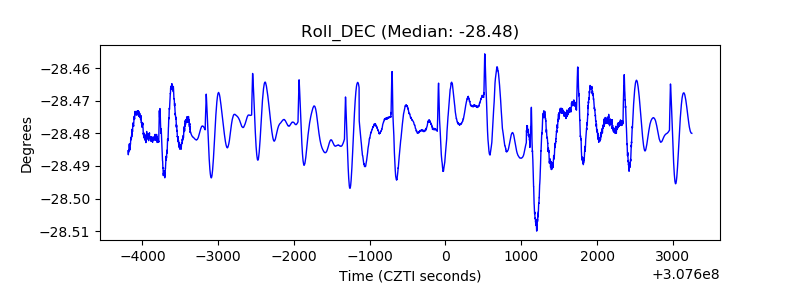 |
| _Roll_RA | 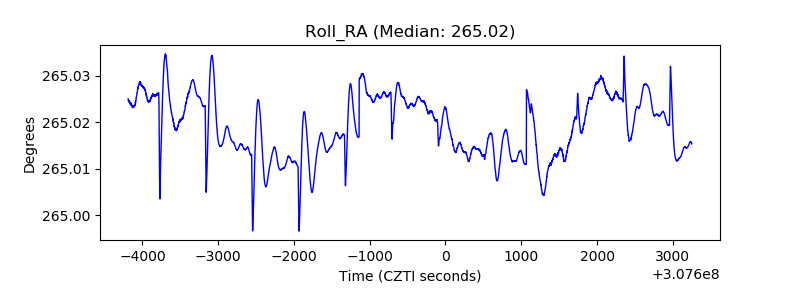 |
| Veto Counter | 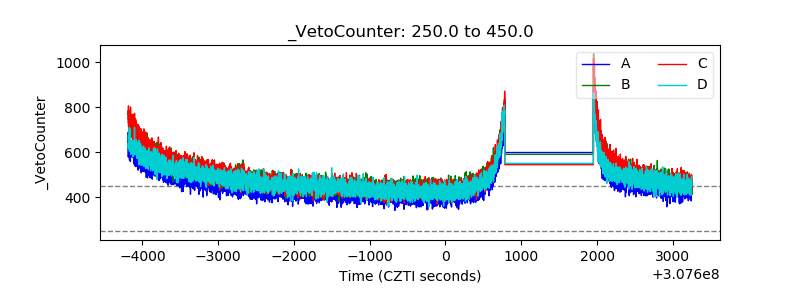 |