| Param | Original file | Final file |
|---|---|---|
| Filename | modeM0/AS1T03_143T01_9000003208_21672cztM0_level2.evt | modeM0/AS1T03_143T01_9000003208_21672cztM0_level2_quad_clean.evt |
| Size (bytes) | 592,228,800 | 90,627,840 |
| Size | 564.8 MB | 86.4 MB |
| Events in quadrant A | 3,460,465 | 578,494 |
| Events in quadrant B | 3,853,258 | 585,502 |
| Events in quadrant C | 3,638,448 | 561,824 |
| Events in quadrant D | 6,497,173 | 518,807 |
| Mode SS | |||
|---|---|---|---|
| Quadrant | BADHDUFLAG | Total packets | Discarded packets |
| A | 0 | 148 | 0 |
| B | 0 | 148 | 0 |
| C | 0 | 148 | 0 |
| D | 0 | 148 | 0 |
| Mode M9 | |||
|---|---|---|---|
| Quadrant | BADHDUFLAG | Total packets | Discarded packets |
| A | 0 | 4 | 0 |
| B | 0 | 4 | 0 |
| C | 0 | 4 | 0 |
| D | 0 | 4 | 0 |
| Mode M0 | |||
|---|---|---|---|
| Quadrant | BADHDUFLAG | Total packets | Discarded packets |
| A | 0 | 14705 | 1 |
| B | 0 | 15733 | 1 |
| C | 0 | 15209 | 1 |
| D | 0 | 23995 | 1 |
| Quadrant | Total seconds | Saturated seconds | Saturation percentage |
|---|---|---|---|
| A | 7175 | 138 | 1.923345% |
| B | 7175 | 193 | 2.689895% |
| C | 7175 | 186 | 2.592334% |
| D | 7176 | 631 | 8.793200% |
Noise dominated data is calculated using 1-second bins in cleaned event files. If a bin has >2000 counts, and if more than 50% of those come from <1% of pixels, then it is considered to be noise-dominated and hence unusable.
| Quadrant | # 1 sec bins | Bins with >0 counts | Bins with >2000 counts | High rate bins dominated by noise | Noise dominated (total time) | Noise dominated (detector-on time) | Marked lightcurve |
|---|---|---|---|---|---|---|---|
| A | 7575 | 7177 | 0 | 0 | 0.00% | 0.00% | 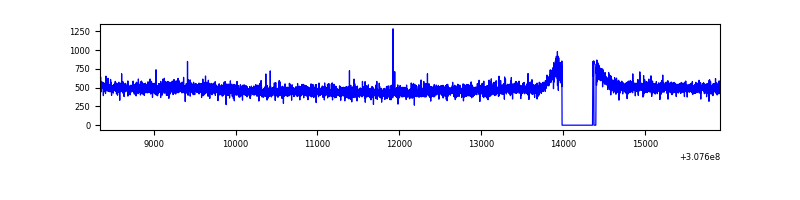 |
| B | 7575 | 7177 | 25 | 25 | 0.33% | 0.35% | 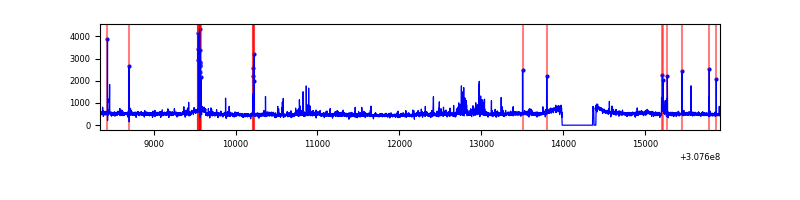 |
| C | 7575 | 7177 | 8 | 8 | 0.11% | 0.11% | 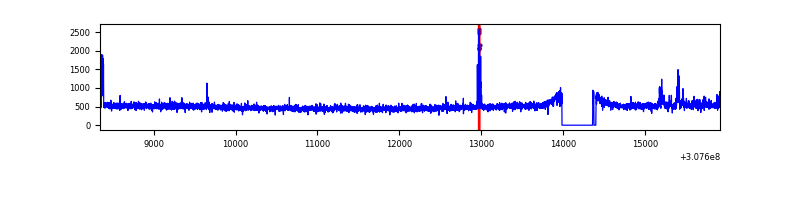 |
| D | 7576 | 7178 | 512 | 512 | 6.76% | 7.13% | 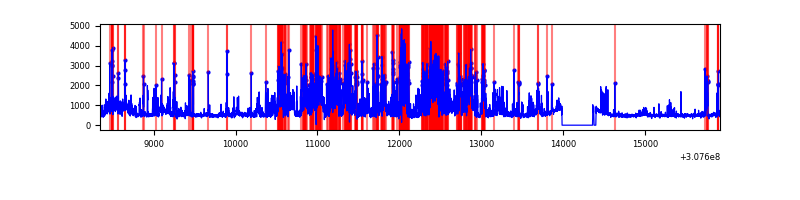 |
Top three noisy pixels from each quadrant. If the there are fewer than three noisy pixels in the level2.evt file, extra rows are filled as -1
| Pixel properties | Quadrant properties | ||||||
|---|---|---|---|---|---|---|---|
| Quadrant | DetID | PixID | Counts | Sigma | Mean | Median | Sigma |
| A | 13 | 254 | 9792 | 49.34 | 898 | 879 | 180.6 |
| A | 0 | 226 | 7641 | 37.43 | 898 | 879 | 180.6 |
| A | 3 | 137 | 7428 | 36.26 | 898 | 879 | 180.6 |
| B | 3 | 64 | 158948 | 928.63 | 893 | 871 | 170.2 |
| B | 0 | 230 | 80469 | 467.6 | 893 | 871 | 170.2 |
| B | 14 | 1 | 28760 | 163.84 | 893 | 871 | 170.2 |
| C | 14 | 238 | 135026 | 667.63 | 859 | 865 | 200.9 |
| C | 8 | 208 | 89550 | 441.33 | 859 | 865 | 200.9 |
| C | 10 | 22 | 43810 | 213.71 | 859 | 865 | 200.9 |
| D | 7 | 238 | 2066906 | 9932.2 | 851 | 826 | 208.0 |
| D | 1 | 52 | 1036461 | 4978.58 | 851 | 826 | 208.0 |
| D | 2 | 136 | 39158 | 184.27 | 851 | 826 | 208.0 |
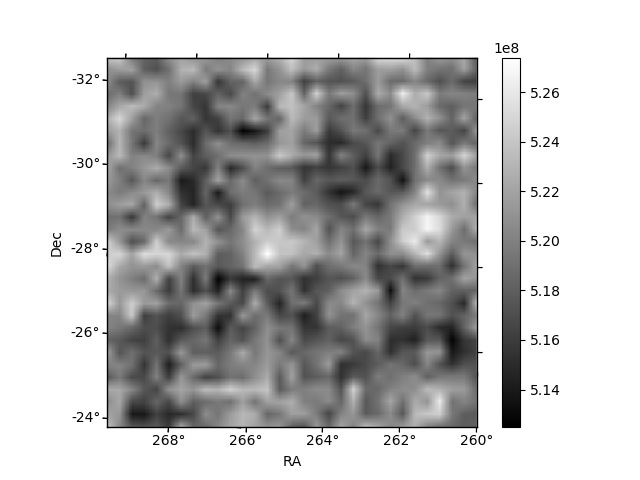
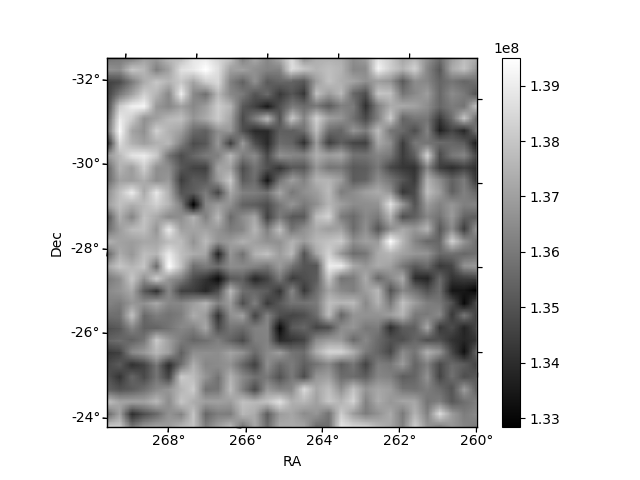
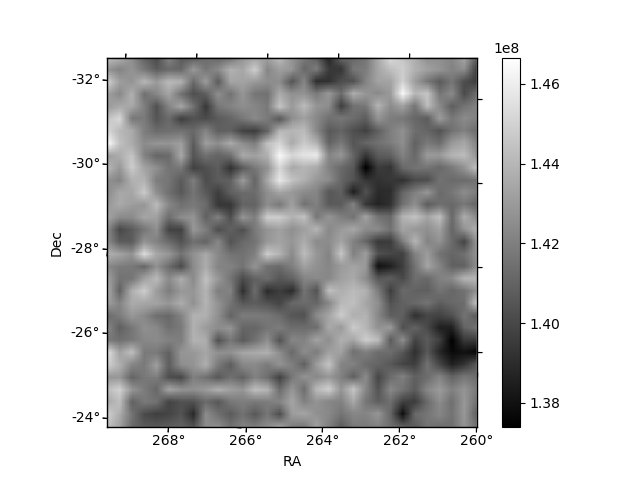
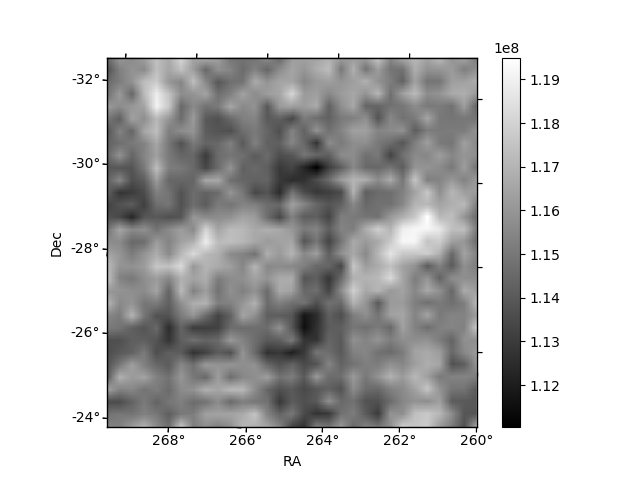
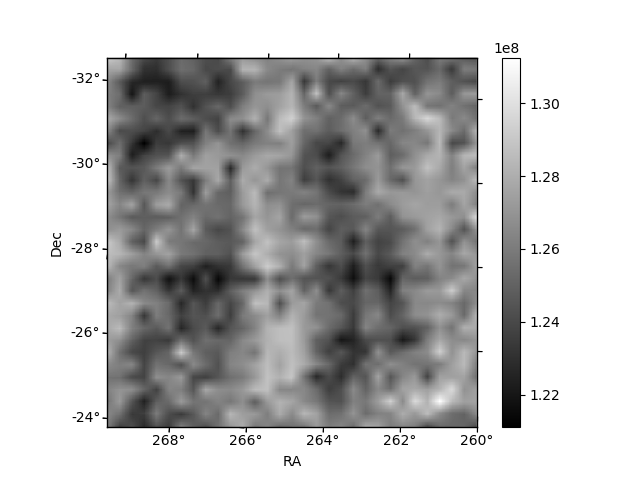
Histogram calculated using DETX and DETY for each event in the final _common_clean file
| Quadrant A | 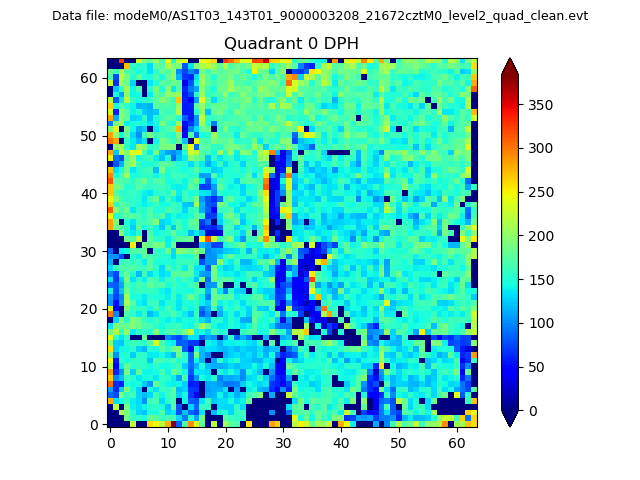 |
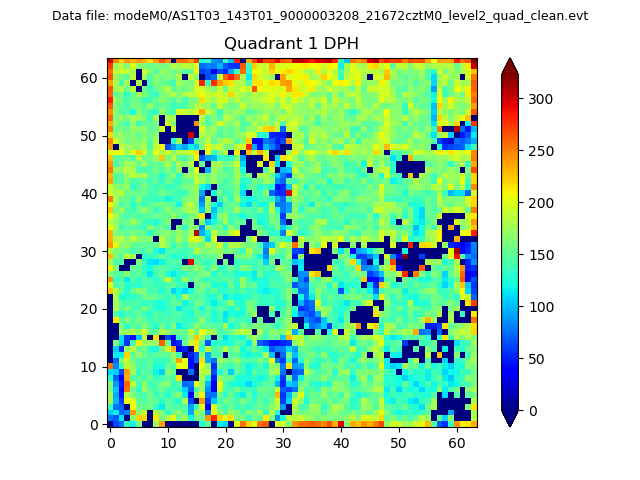 |
Quadrant B |
|---|---|---|---|
| Quadrant D |  |
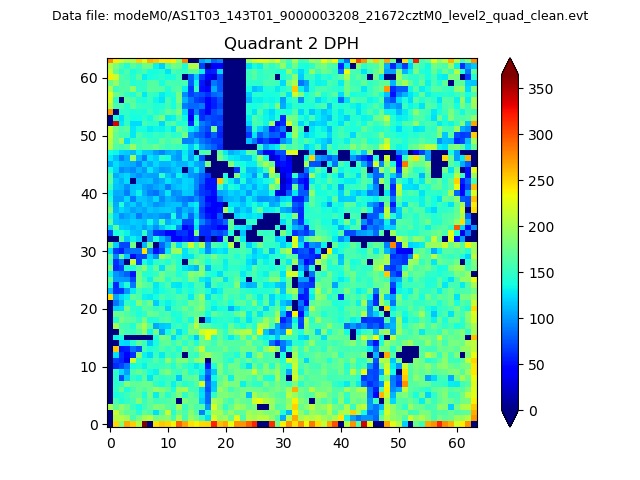 |
Quadrant C |
| Plot type | Count rate plots | Images |
|---|---|---|
| Comparison with Poisson distribution Blue bars denote a histogram of data divided into 1 sec bins. Red curve is a Poisson curve with rate = median count rate of data. |
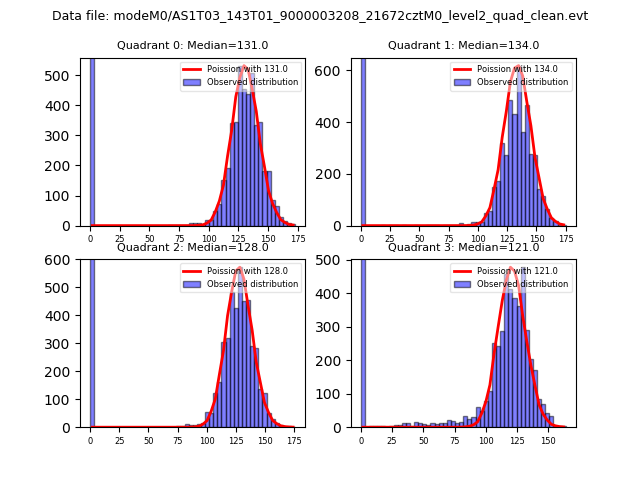 |
 |
| Quadrant-wise count rates Data is divided into 100 sec bins |
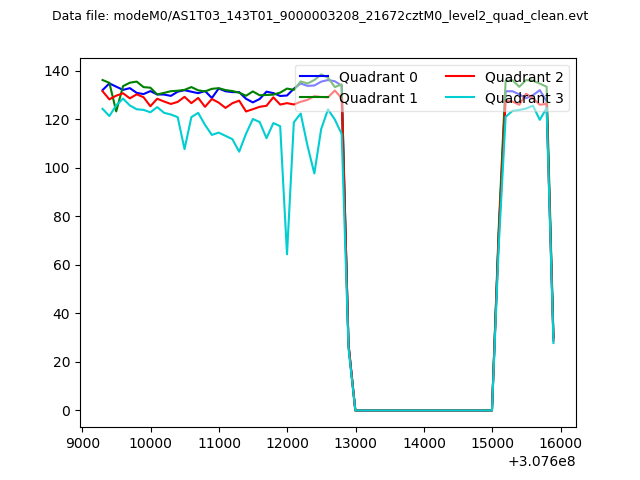 |
|
| Module-wise count rates for Quadrant A Data is divided into 100 sec bins |
 |
 |
| Module-wise count rates for Quadrant B Data is divided into 100 sec bins |
 |
 |
| Module-wise count rates for Quadrant C Data is divided into 100 sec bins |
 |
 |
| Module-wise count rates for Quadrant D Data is divided into 100 sec bins |
 |
 |
| Parameter | Plot |
|---|---|
| CZT HV Monitor |  |
| D_VDD | 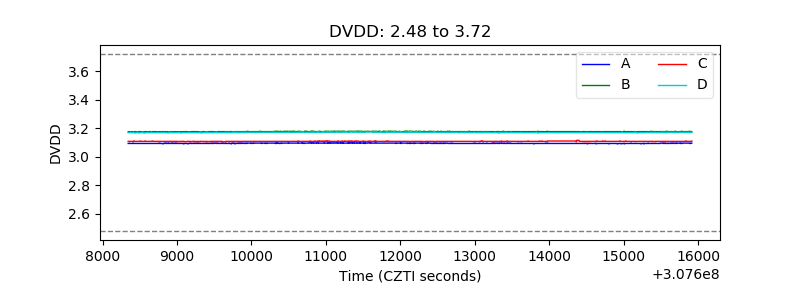 |
| Temperature 1 | 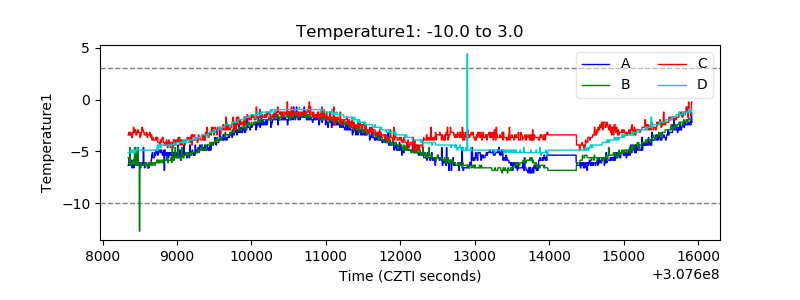 |
| Veto HV Monitor | 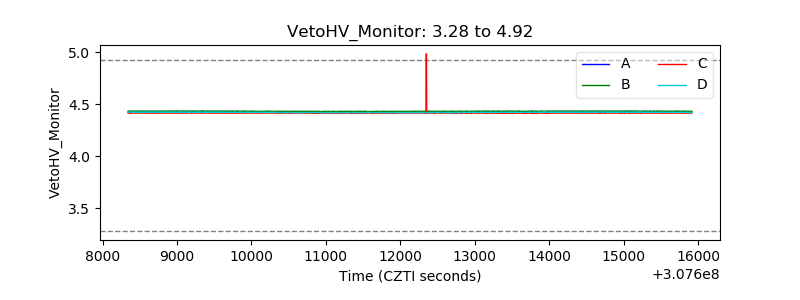 |
| Veto LLD | 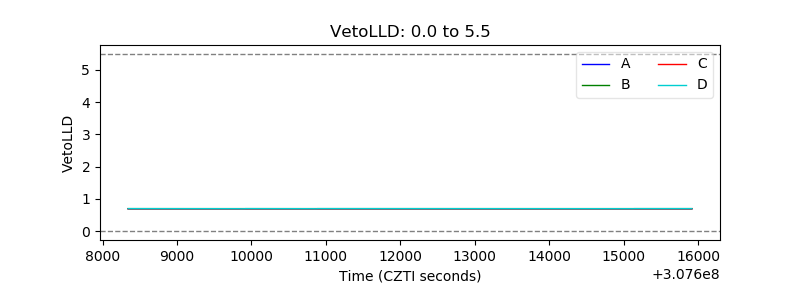 |
| Alpha Counter | 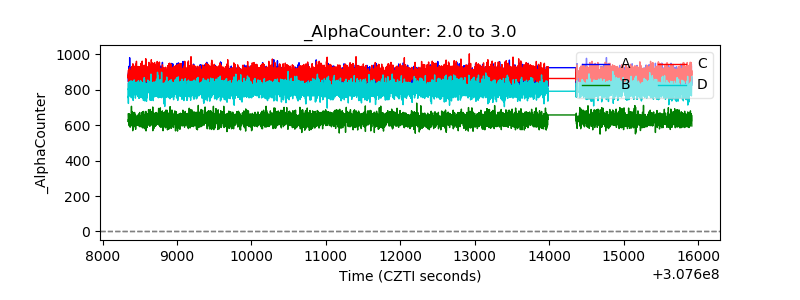 |
| _CPM_Rate | 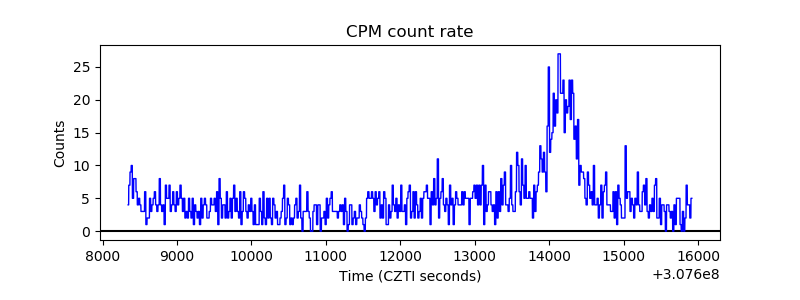 |
| CZT Counter | 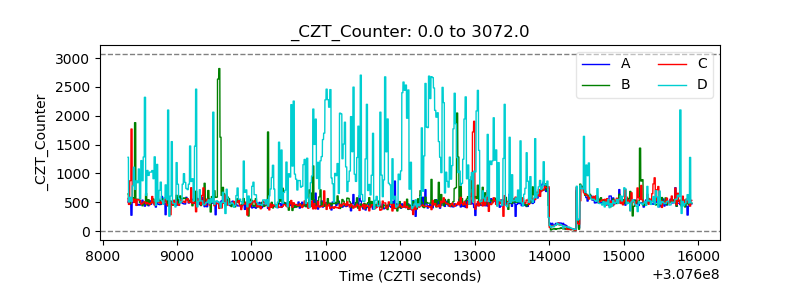 |
| +2.5 Volts monitor |  |
| +5 Volts monitor | 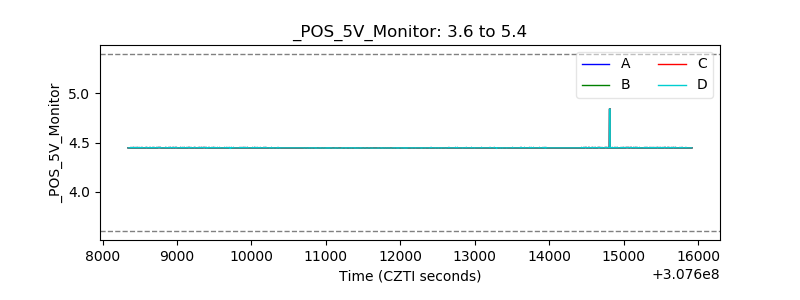 |
| _ROLL_ROT | 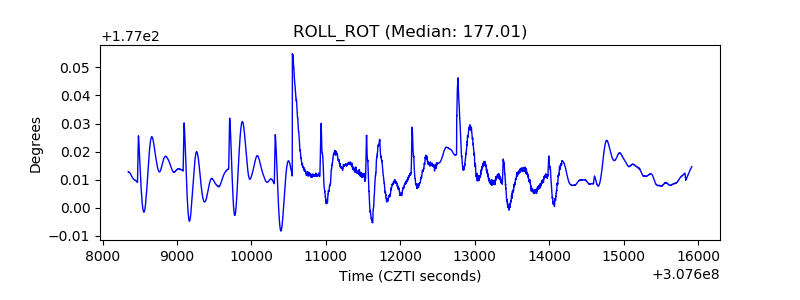 |
| _Roll_DEC | 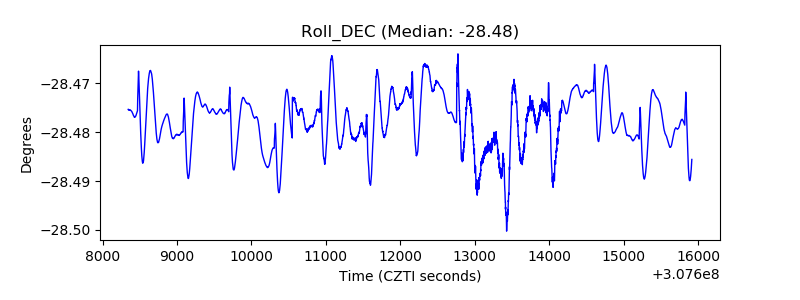 |
| _Roll_RA | 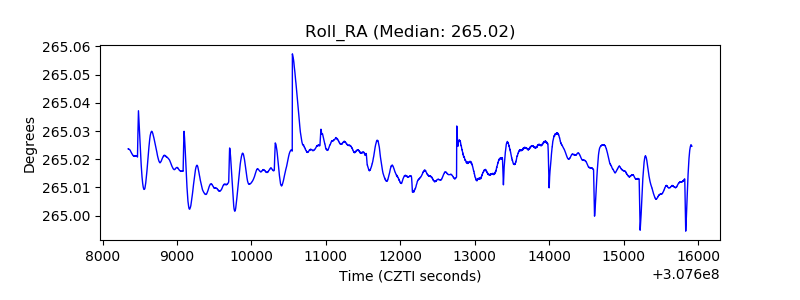 |
| Veto Counter |  |