| Param | Original file | Final file |
|---|---|---|
| Filename | modeM0/AS1T03_143T01_9000003208_21673cztM0_level2.evt | modeM0/AS1T03_143T01_9000003208_21673cztM0_level2_quad_clean.evt |
| Size (bytes) | 414,288,000 | 71,429,760 |
| Size | 395.1 MB | 68.1 MB |
| Events in quadrant A | 2,423,465 | 459,630 |
| Events in quadrant B | 3,023,801 | 464,864 |
| Events in quadrant C | 2,880,884 | 445,526 |
| Events in quadrant D | 3,862,175 | 425,580 |
| Mode SS | |||
|---|---|---|---|
| Quadrant | BADHDUFLAG | Total packets | Discarded packets |
| A | 0 | 106 | 0 |
| B | 0 | 106 | 0 |
| C | 0 | 106 | 0 |
| D | 0 | 106 | 0 |
| Mode M0 | |||
|---|---|---|---|
| Quadrant | BADHDUFLAG | Total packets | Discarded packets |
| A | 0 | 10648 | 11 |
| B | 0 | 12245 | 6 |
| C | 0 | 12016 | 3 |
| D | 0 | 15006 | 3 |
| Quadrant | Total seconds | Saturated seconds | Saturation percentage |
|---|---|---|---|
| A | 5239 | 39 | 0.744417% |
| B | 5241 | 170 | 3.243656% |
| C | 5242 | 62 | 1.182755% |
| D | 5242 | 94 | 1.793209% |
Noise dominated data is calculated using 1-second bins in cleaned event files. If a bin has >2000 counts, and if more than 50% of those come from <1% of pixels, then it is considered to be noise-dominated and hence unusable.
| Quadrant | # 1 sec bins | Bins with >0 counts | Bins with >2000 counts | High rate bins dominated by noise | Noise dominated (total time) | Noise dominated (detector-on time) | Marked lightcurve |
|---|---|---|---|---|---|---|---|
| A | 5239 | 5239 | 0 | 0 | 0.00% | 0.00% | 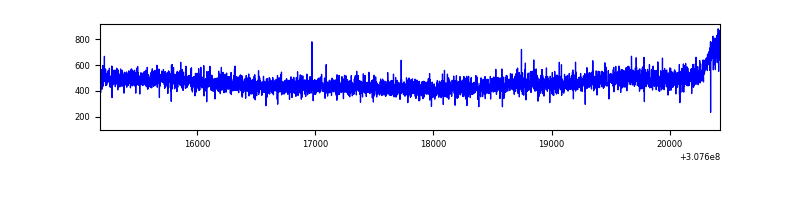 |
| B | 5241 | 5241 | 82 | 82 | 1.56% | 1.56% | 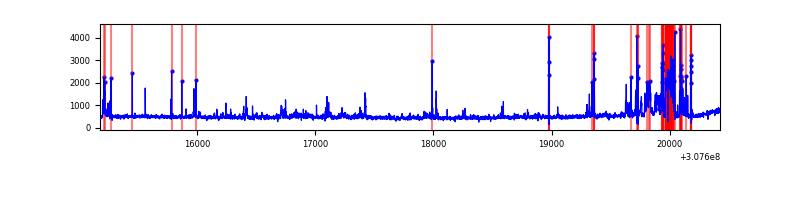 |
| C | 5242 | 5242 | 0 | 0 | 0.00% | 0.00% | 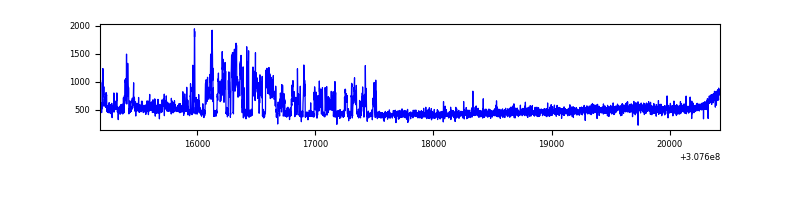 |
| D | 5242 | 5242 | 147 | 147 | 2.80% | 2.80% | 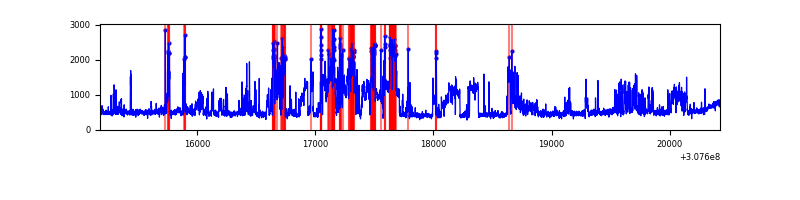 |
Top three noisy pixels from each quadrant. If the there are fewer than three noisy pixels in the level2.evt file, extra rows are filled as -1
| Pixel properties | Quadrant properties | ||||||
|---|---|---|---|---|---|---|---|
| Quadrant | DetID | PixID | Counts | Sigma | Mean | Median | Sigma |
| A | 13 | 254 | 7042 | 49.99 | 628 | 615 | 128.6 |
| A | 0 | 226 | 5448 | 37.59 | 628 | 615 | 128.6 |
| A | 3 | 137 | 5322 | 36.61 | 628 | 615 | 128.6 |
| B | 3 | 64 | 427182 | 3549.83 | 627 | 612 | 120.2 |
| B | 0 | 190 | 37134 | 303.93 | 627 | 612 | 120.2 |
| B | 0 | 189 | 25156 | 204.25 | 627 | 612 | 120.2 |
| C | 8 | 208 | 438267 | 3095.74 | 601 | 606 | 141.4 |
| C | 14 | 238 | 94053 | 660.99 | 601 | 606 | 141.4 |
| C | 13 | 61 | 4211 | 25.5 | 601 | 606 | 141.4 |
| D | 1 | 52 | 1149024 | 7693.38 | 609 | 593 | 149.3 |
| D | 7 | 223 | 261671 | 1748.97 | 609 | 593 | 149.3 |
| D | 2 | 136 | 35543 | 234.13 | 609 | 593 | 149.3 |
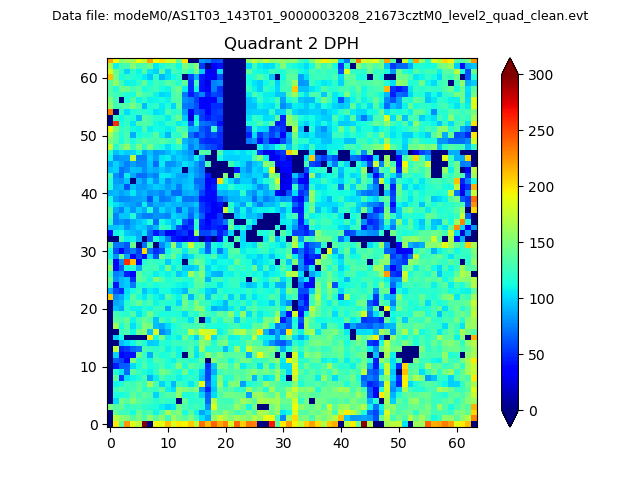
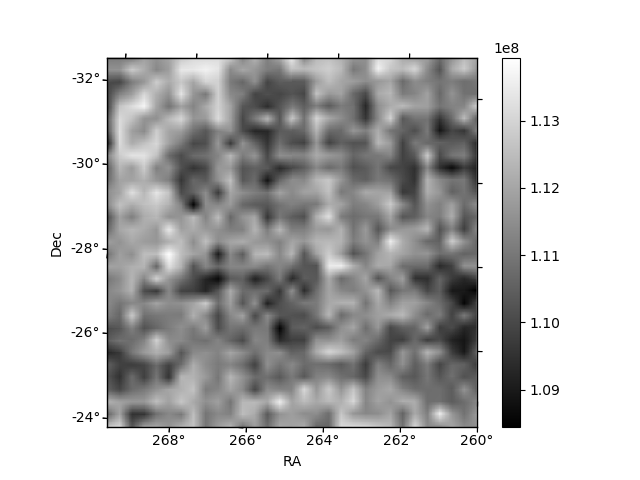
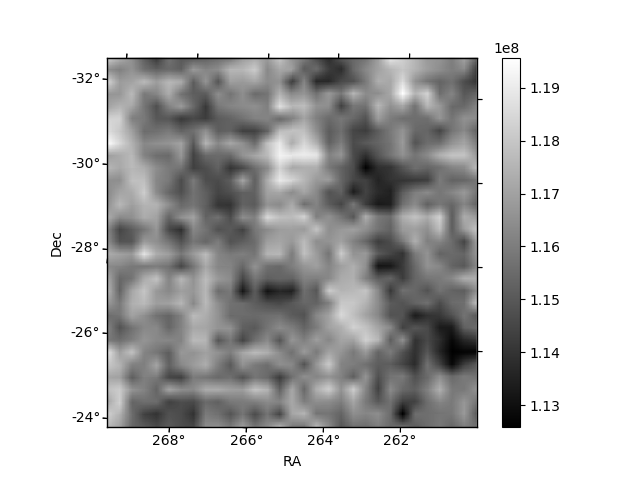
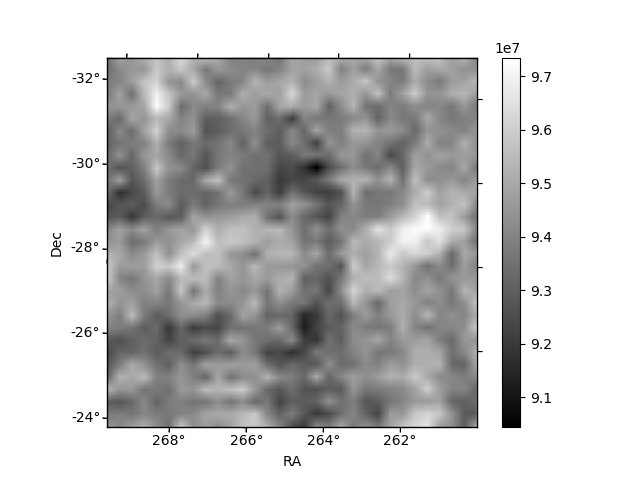
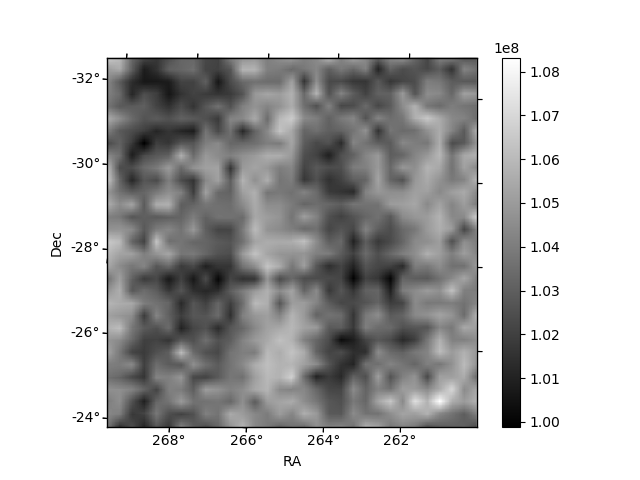
Histogram calculated using DETX and DETY for each event in the final _common_clean file
| Quadrant A |  |
 |
Quadrant B |
|---|---|---|---|
| Quadrant D | 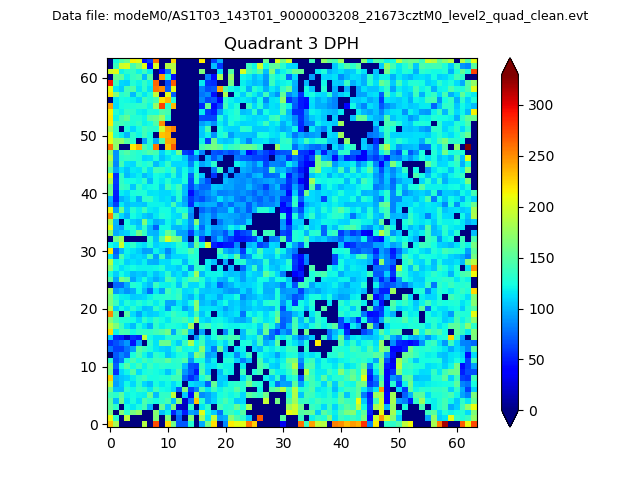 |
 |
Quadrant C |
| Plot type | Count rate plots | Images |
|---|---|---|
| Comparison with Poisson distribution Blue bars denote a histogram of data divided into 1 sec bins. Red curve is a Poisson curve with rate = median count rate of data. |
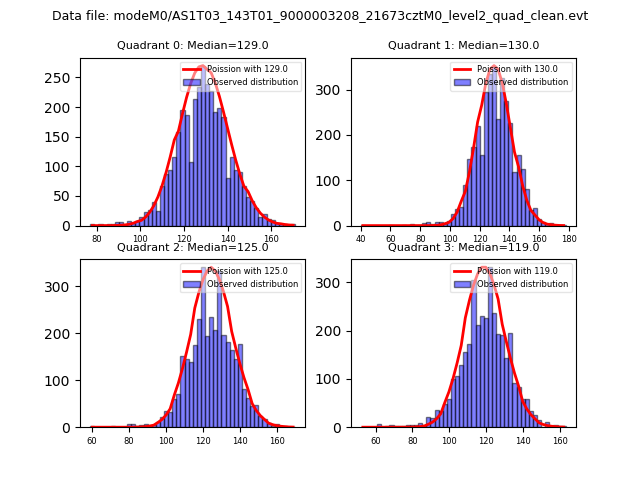 |
 |
| Quadrant-wise count rates Data is divided into 100 sec bins |
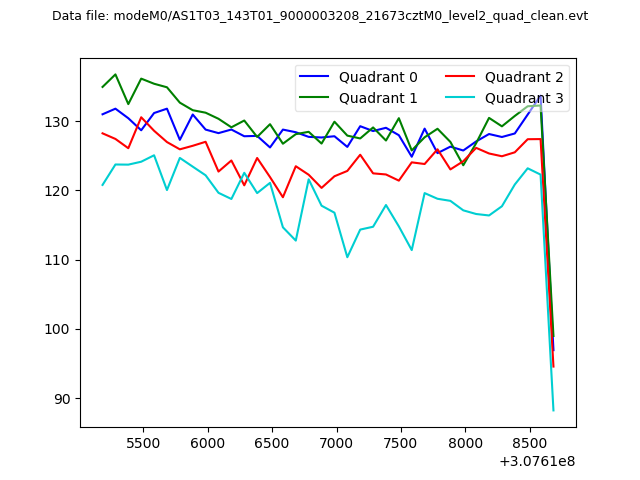 |
|
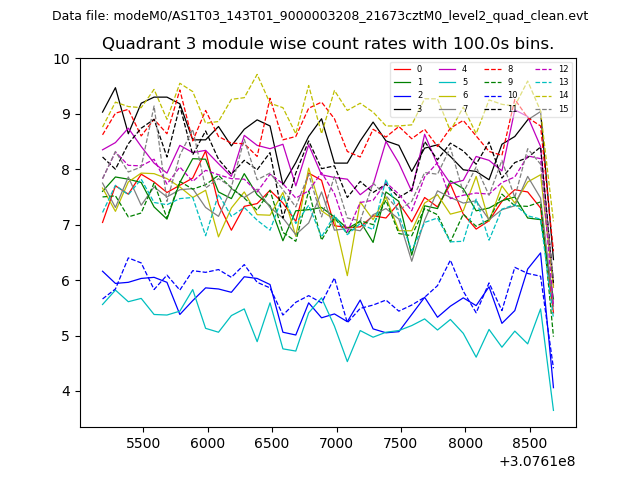
| Module-wise count rates for Quadrant A Data is divided into 100 sec bins |
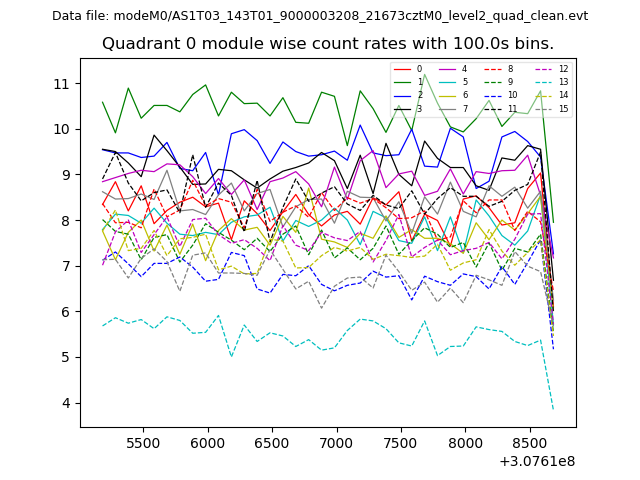 |
 |
| Module-wise count rates for Quadrant B Data is divided into 100 sec bins |
 |
 |
| Module-wise count rates for Quadrant C Data is divided into 100 sec bins |
 |
 |
| Module-wise count rates for Quadrant D Data is divided into 100 sec bins |
 |
 |
| Parameter | Plot |
|---|---|
| CZT HV Monitor |  |
| D_VDD | 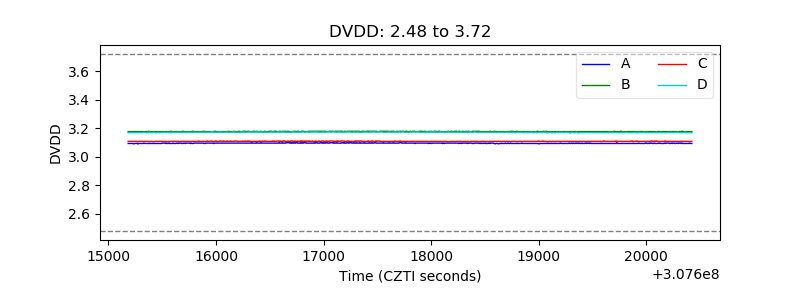 |
| Temperature 1 | 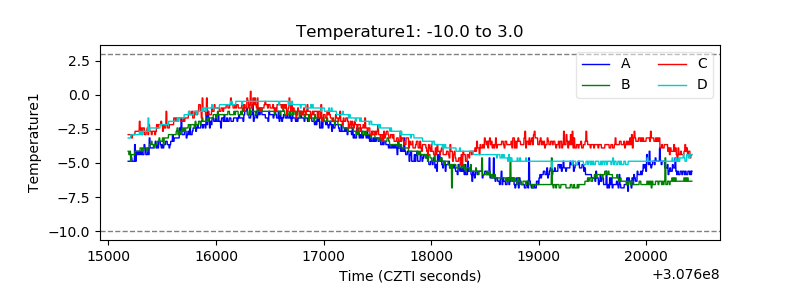 |
| Veto HV Monitor | 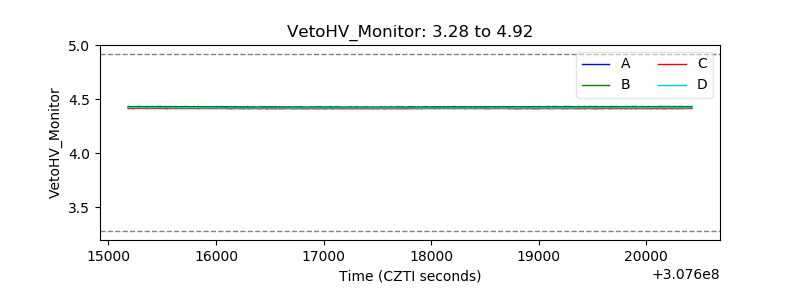 |
| Veto LLD | 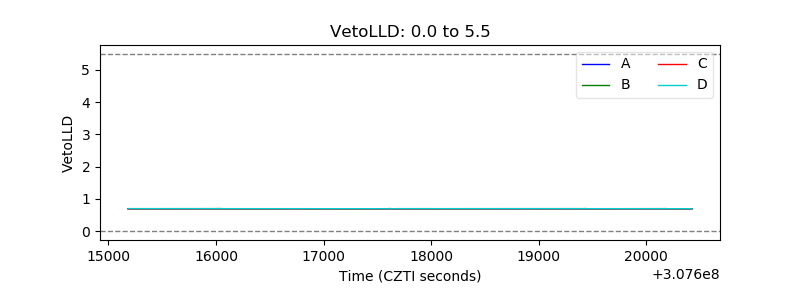 |
| Alpha Counter | 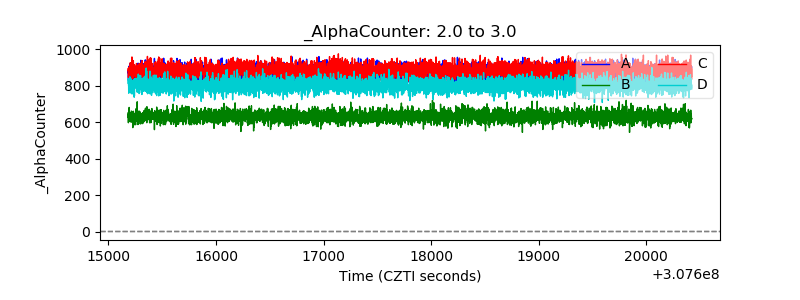 |
| _CPM_Rate | 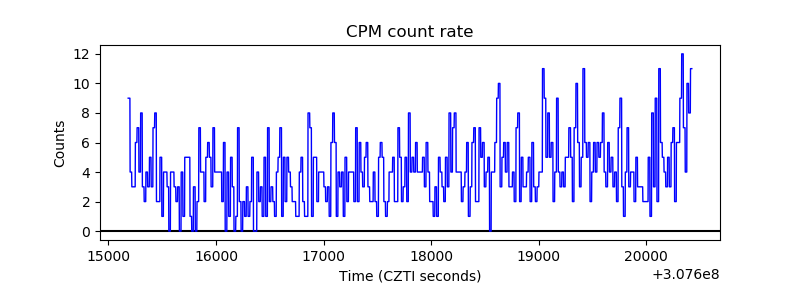 |
| CZT Counter | 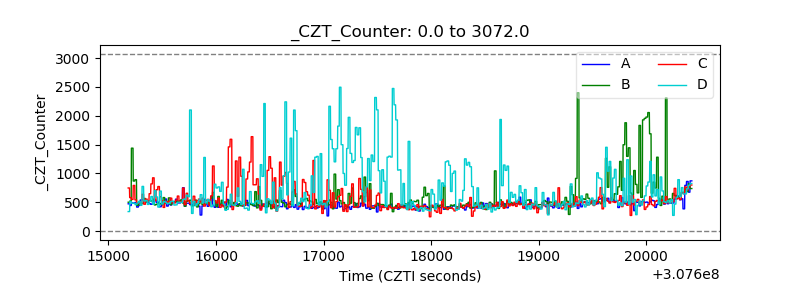 |
| +2.5 Volts monitor |  |
| +5 Volts monitor | 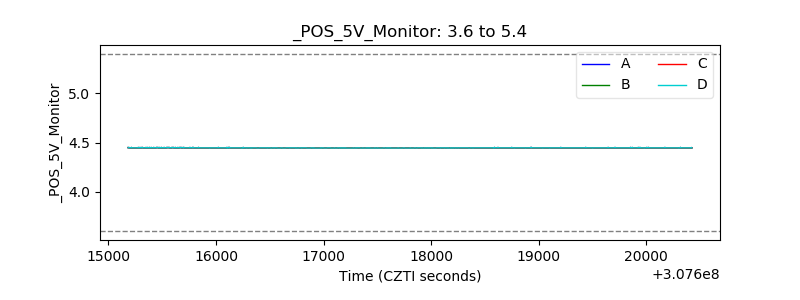 |
| _ROLL_ROT | 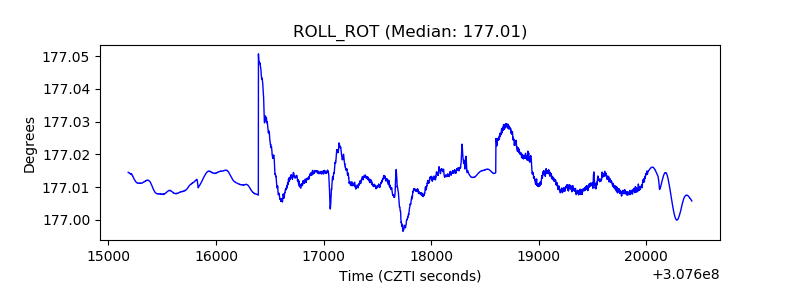 |
| _Roll_DEC | 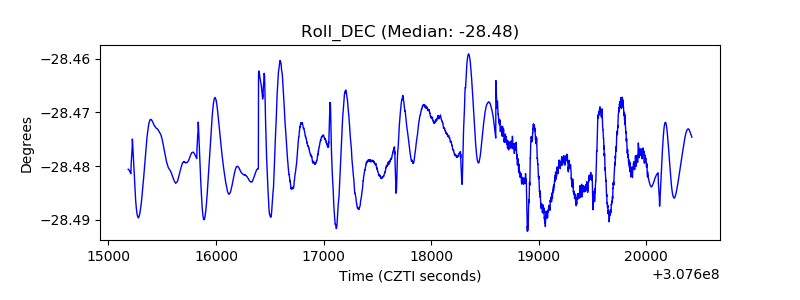 |
| _Roll_RA | 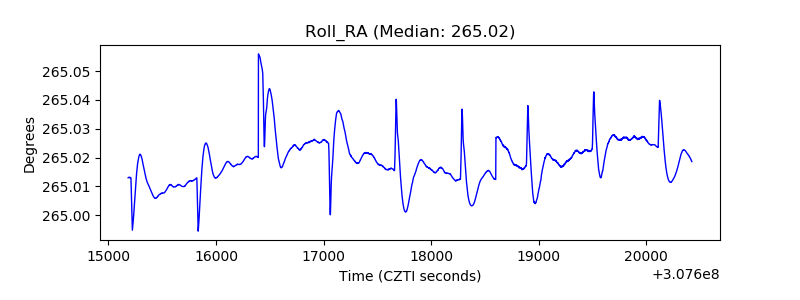 |
| Veto Counter | 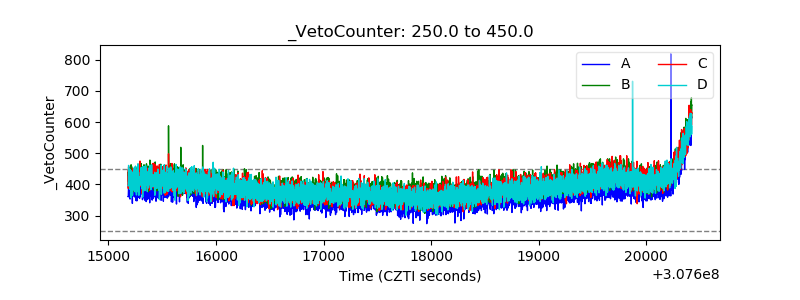 |