| Param | Original file | Final file |
|---|---|---|
| Filename | modeM0/AS1T03_143T01_9000003208_21676cztM0_level2.evt | modeM0/AS1T03_143T01_9000003208_21676cztM0_level2_quad_clean.evt |
| Size (bytes) | 981,671,040 | 165,280,320 |
| Size | 936.2 MB | 157.6 MB |
| Events in quadrant A | 5,993,430 | 1,068,209 |
| Events in quadrant B | 6,676,700 | 1,074,692 |
| Events in quadrant C | 6,491,030 | 1,031,312 |
| Events in quadrant D | 9,707,499 | 950,656 |
| Mode SS | |||
|---|---|---|---|
| Quadrant | BADHDUFLAG | Total packets | Discarded packets |
| A | 0 | 260 | 0 |
| B | 0 | 260 | 0 |
| C | 0 | 260 | 0 |
| D | 0 | 260 | 0 |
| Mode M9 | |||
|---|---|---|---|
| Quadrant | BADHDUFLAG | Total packets | Discarded packets |
| A | 0 | 12 | 0 |
| B | 0 | 12 | 0 |
| C | 0 | 12 | 0 |
| D | 0 | 12 | 0 |
| Mode M0 | |||
|---|---|---|---|
| Quadrant | BADHDUFLAG | Total packets | Discarded packets |
| A | 0 | 26067 | 2 |
| B | 0 | 27736 | 2 |
| C | 0 | 27591 | 2 |
| D | 0 | 37404 | 2 |
| Quadrant | Total seconds | Saturated seconds | Saturation percentage |
|---|---|---|---|
| A | 12737 | 71 | 0.557431% |
| B | 12738 | 124 | 0.973465% |
| C | 12738 | 133 | 1.044120% |
| D | 12738 | 911 | 7.151829% |
Noise dominated data is calculated using 1-second bins in cleaned event files. If a bin has >2000 counts, and if more than 50% of those come from <1% of pixels, then it is considered to be noise-dominated and hence unusable.
| Quadrant | # 1 sec bins | Bins with >0 counts | Bins with >2000 counts | High rate bins dominated by noise | Noise dominated (total time) | Noise dominated (detector-on time) | Marked lightcurve |
|---|---|---|---|---|---|---|---|
| A | 13912 | 12739 | 0 | 0 | 0.00% | 0.00% | 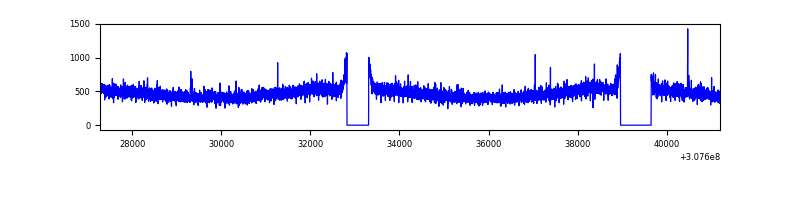 |
| B | 13913 | 12740 | 14 | 14 | 0.10% | 0.11% | 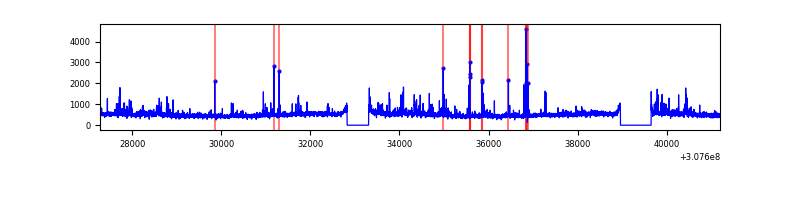 |
| C | 13913 | 12740 | 0 | 0 | 0.00% | 0.00% | 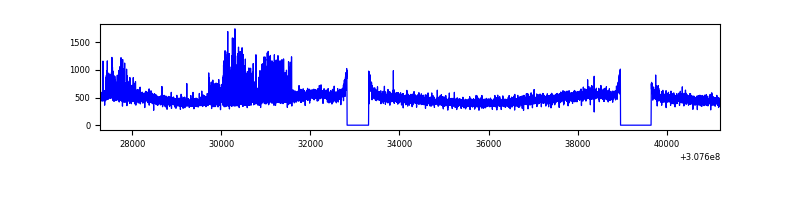 |
| D | 13913 | 12739 | 728 | 728 | 5.23% | 5.71% | 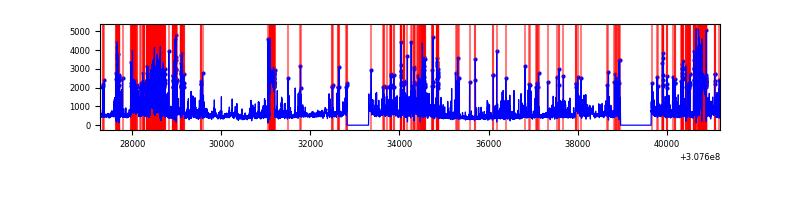 |
Top three noisy pixels from each quadrant. If the there are fewer than three noisy pixels in the level2.evt file, extra rows are filled as -1
| Pixel properties | Quadrant properties | ||||||
|---|---|---|---|---|---|---|---|
| Quadrant | DetID | PixID | Counts | Sigma | Mean | Median | Sigma |
| A | 13 | 254 | 19707 | 58.36 | 1549 | 1517 | 311.7 |
| A | 0 | 226 | 13506 | 38.46 | 1549 | 1517 | 311.7 |
| A | 15 | 236 | 13153 | 37.33 | 1549 | 1517 | 311.7 |
| B | 0 | 229 | 153082 | 506.02 | 1547 | 1510 | 299.5 |
| B | 3 | 64 | 139478 | 460.61 | 1547 | 1510 | 299.5 |
| B | 0 | 189 | 95649 | 314.28 | 1547 | 1510 | 299.5 |
| C | 8 | 208 | 508209 | 1471.66 | 1472 | 1482 | 344.3 |
| C | 14 | 238 | 230305 | 664.56 | 1472 | 1482 | 344.3 |
| C | 10 | 22 | 12117 | 30.89 | 1472 | 1482 | 344.3 |
| D | 1 | 52 | 1786625 | 5001.22 | 1447 | 1405 | 357.0 |
| D | 1 | 20 | 804154 | 2248.87 | 1447 | 1405 | 357.0 |
| D | 12 | 16 | 576742 | 1611.78 | 1447 | 1405 | 357.0 |
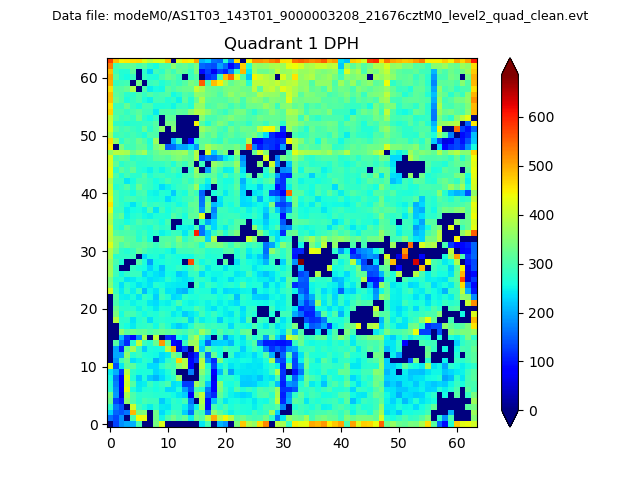
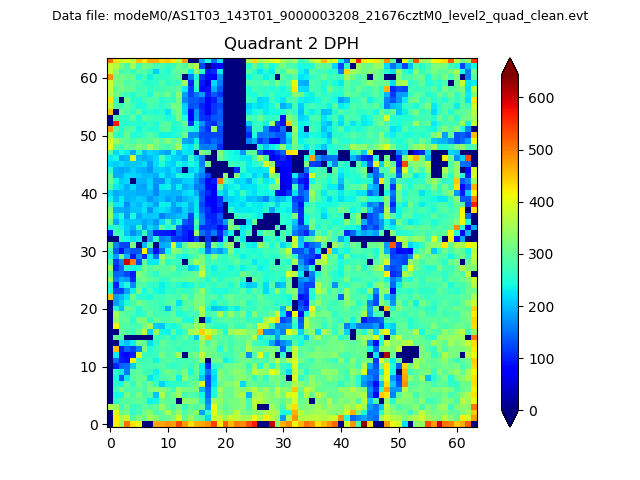
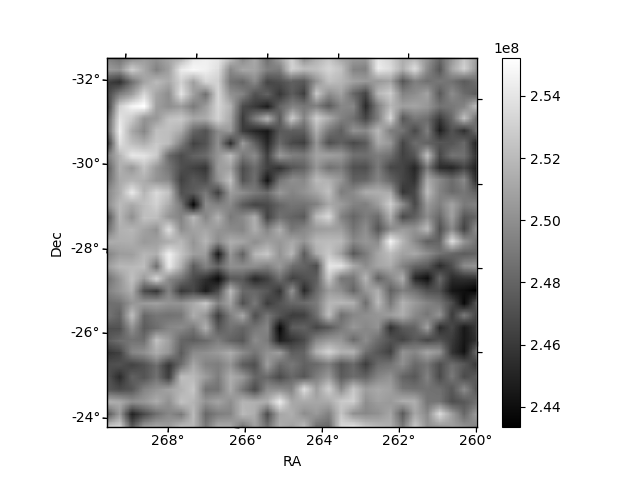
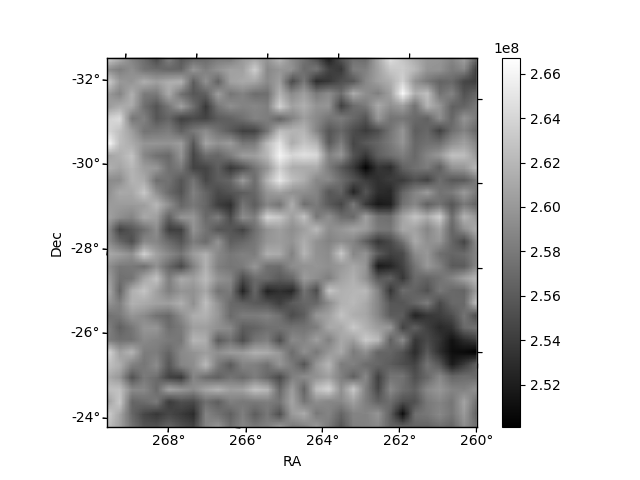
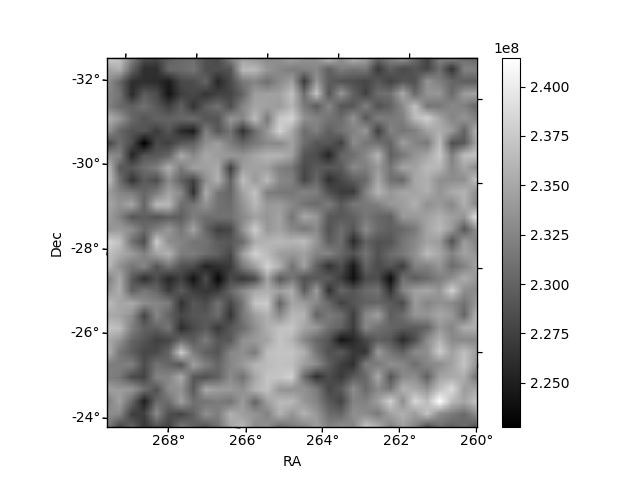
Histogram calculated using DETX and DETY for each event in the final _common_clean file
| Quadrant A |  |
 |
Quadrant B |
|---|---|---|---|
| Quadrant D |  |
 |
Quadrant C |
| Plot type | Count rate plots | Images |
|---|---|---|
| Comparison with Poisson distribution Blue bars denote a histogram of data divided into 1 sec bins. Red curve is a Poisson curve with rate = median count rate of data. |
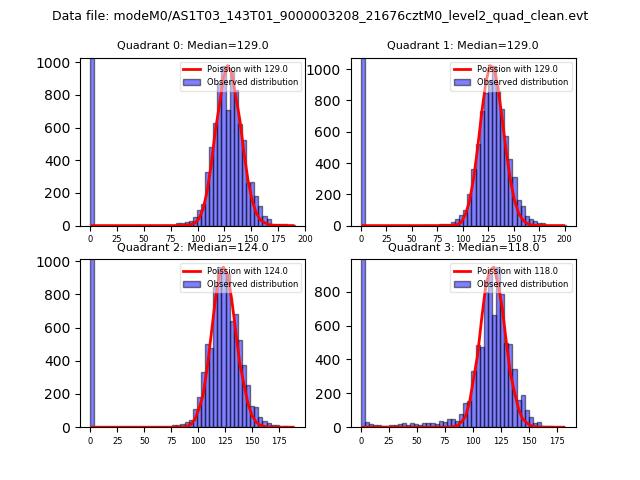 |
 |
| Quadrant-wise count rates Data is divided into 100 sec bins |
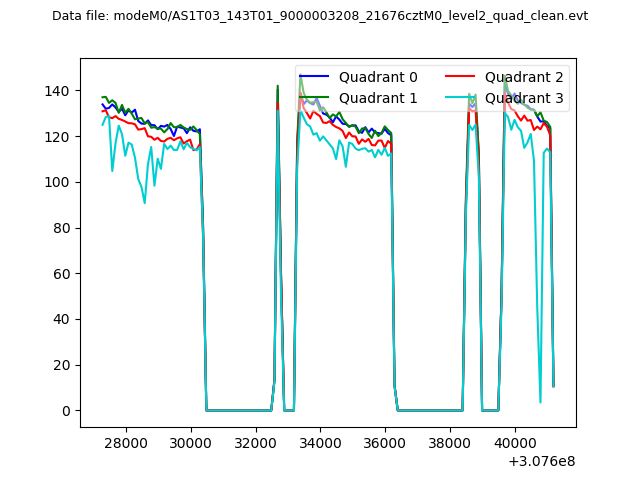 |
|
| Module-wise count rates for Quadrant A Data is divided into 100 sec bins |
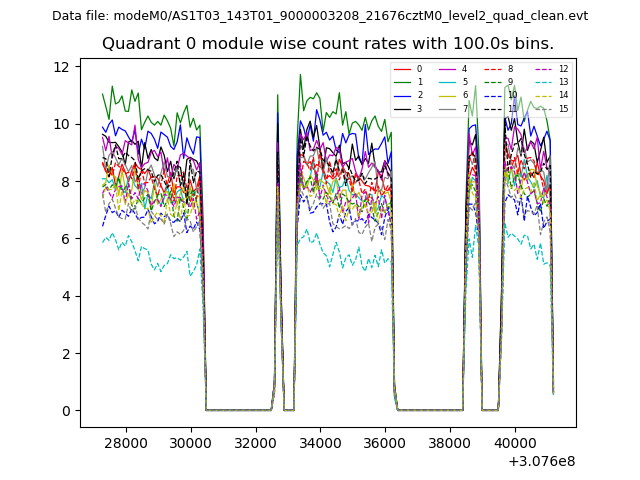 |
 |
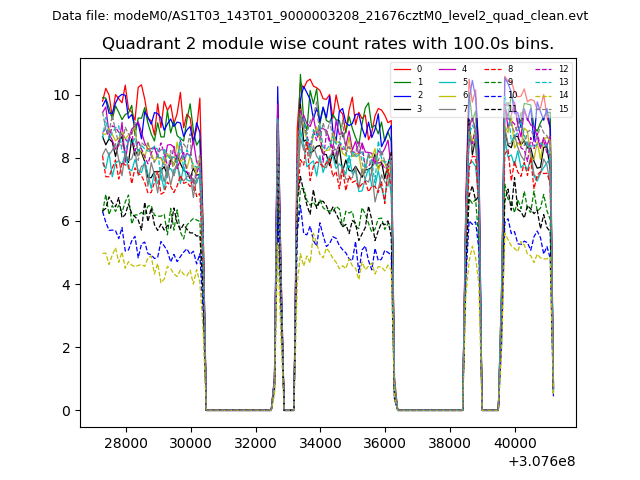
| Module-wise count rates for Quadrant B Data is divided into 100 sec bins |
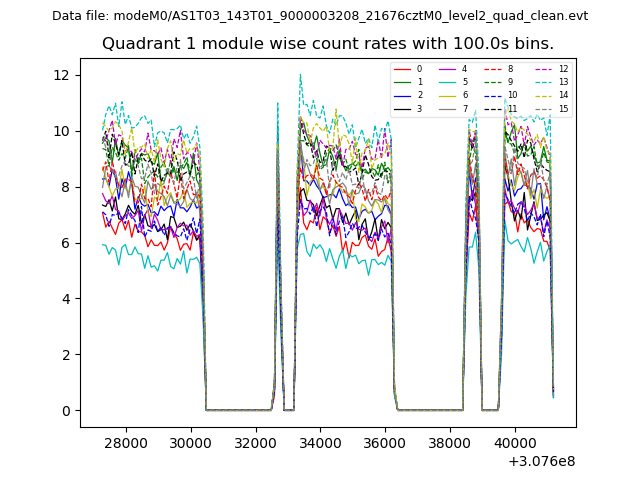 |
 |
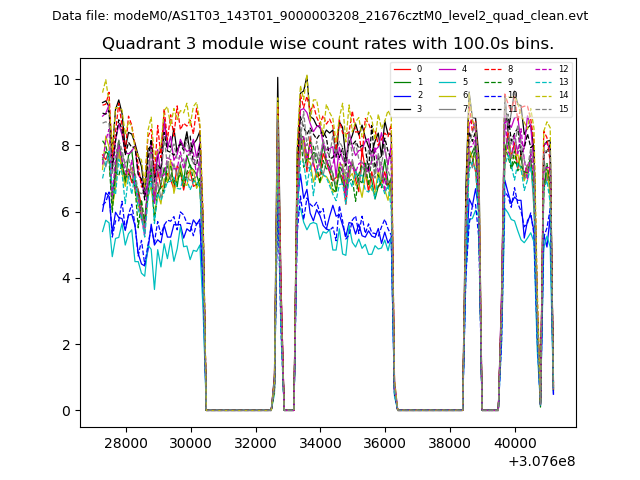
| Module-wise count rates for Quadrant C Data is divided into 100 sec bins |
 |
 |
| Module-wise count rates for Quadrant D Data is divided into 100 sec bins |
 |
 |
| Parameter | Plot |
|---|---|
| CZT HV Monitor |  |
| D_VDD | 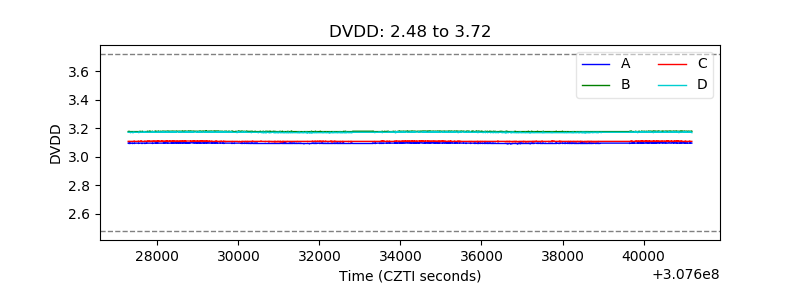 |
| Temperature 1 | 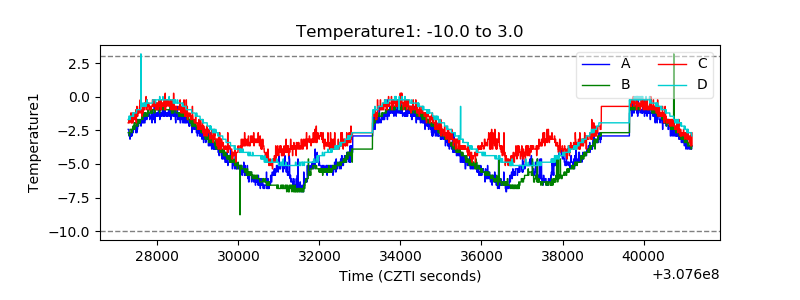 |
| Veto HV Monitor | 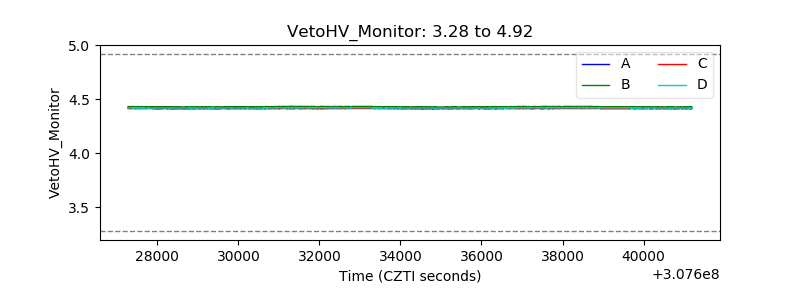 |
| Veto LLD | 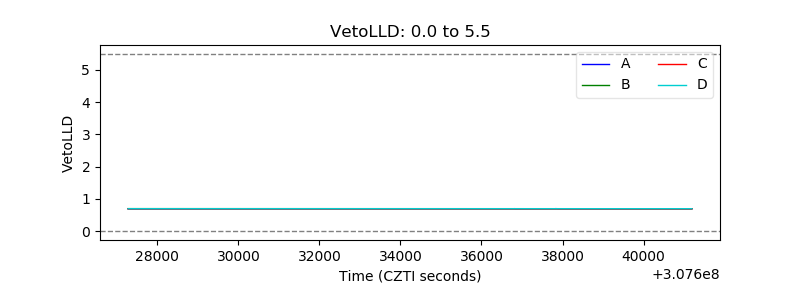 |
| Alpha Counter | 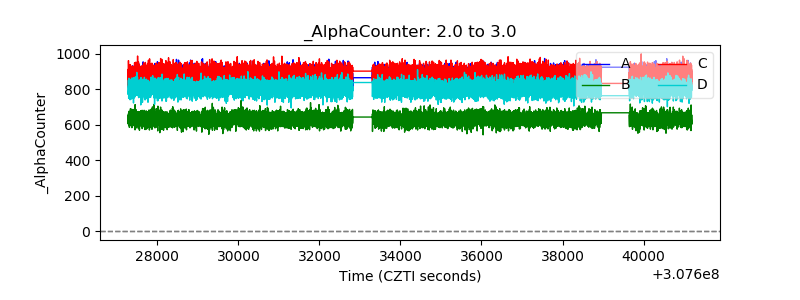 |
| _CPM_Rate | 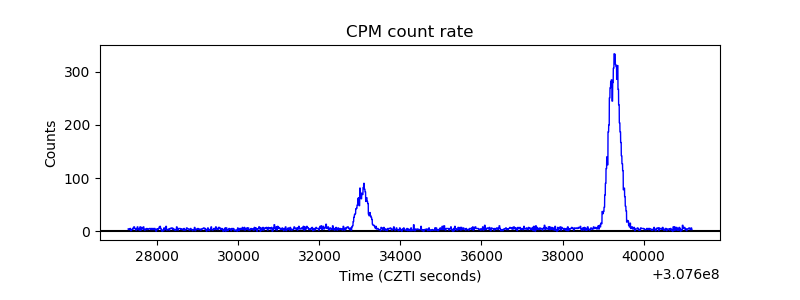 |
| CZT Counter | 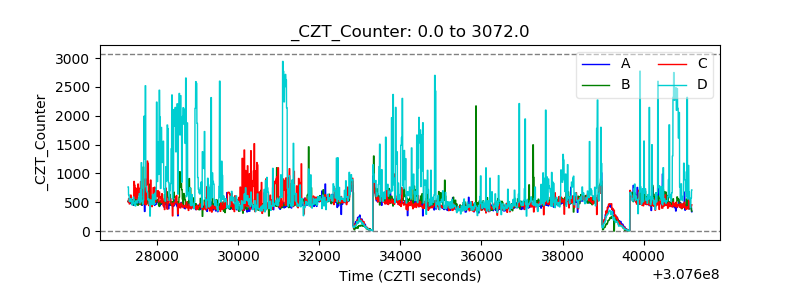 |
| +2.5 Volts monitor |  |
| +5 Volts monitor | 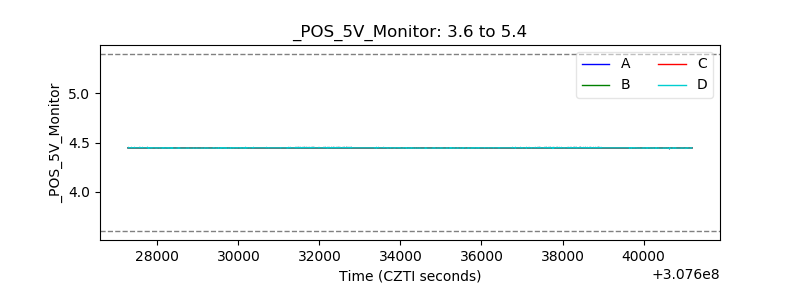 |
| _ROLL_ROT | 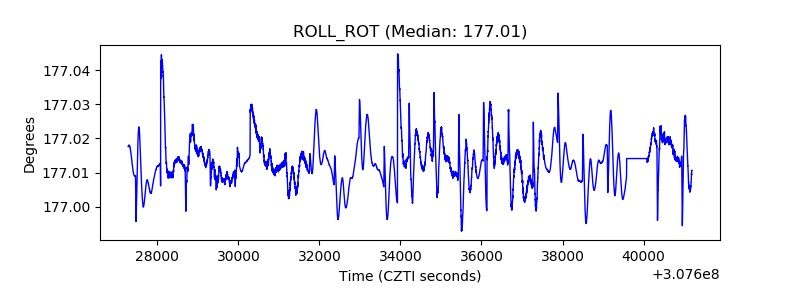 |
| _Roll_DEC | 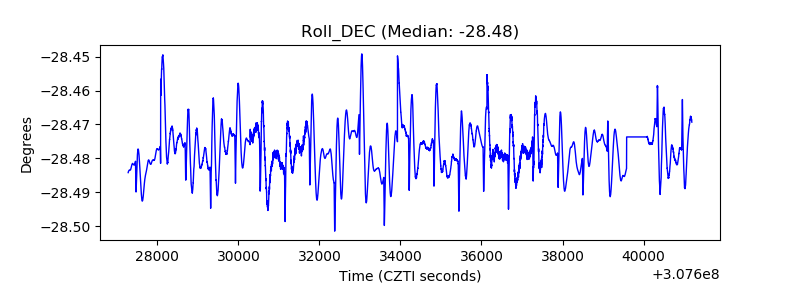 |
| _Roll_RA | 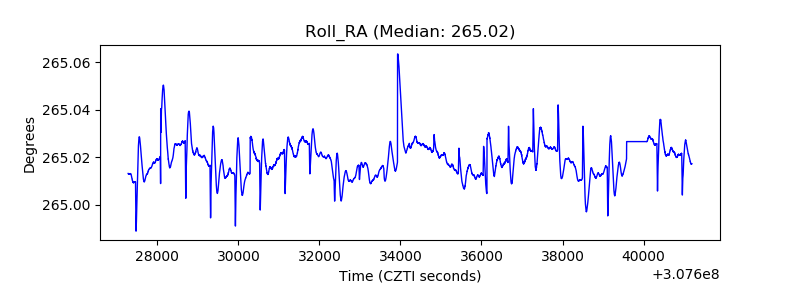 |
| Veto Counter | 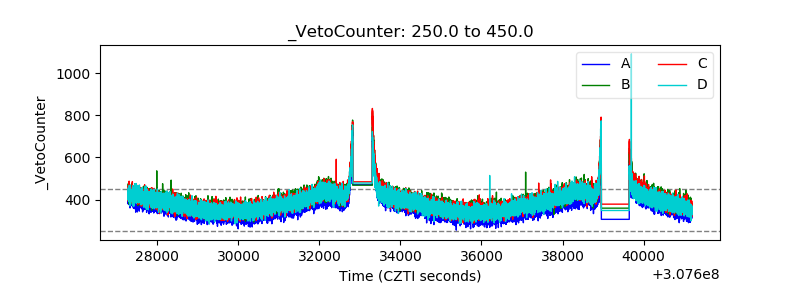 |