| Param | Original file | Final file |
|---|---|---|
| Filename | modeM0/AS1T03_143T01_9000003208_21678cztM0_level2.evt | modeM0/AS1T03_143T01_9000003208_21678cztM0_level2_quad_clean.evt |
| Size (bytes) | 457,369,920 | 85,556,160 |
| Size | 436.2 MB | 81.6 MB |
| Events in quadrant A | 2,933,247 | 550,382 |
| Events in quadrant B | 3,271,489 | 562,044 |
| Events in quadrant C | 2,955,604 | 536,033 |
| Events in quadrant D | 4,265,464 | 505,032 |
| Mode SS | |||
|---|---|---|---|
| Quadrant | BADHDUFLAG | Total packets | Discarded packets |
| A | 0 | 128 | 0 |
| B | 0 | 128 | 0 |
| C | 0 | 128 | 0 |
| D | 0 | 128 | 0 |
| Mode M9 | |||
|---|---|---|---|
| Quadrant | BADHDUFLAG | Total packets | Discarded packets |
| A | 0 | 10 | 0 |
| B | 0 | 10 | 0 |
| C | 0 | 10 | 0 |
| D | 0 | 10 | 0 |
| Mode M0 | |||
|---|---|---|---|
| Quadrant | BADHDUFLAG | Total packets | Discarded packets |
| A | 0 | 12769 | 1 |
| B | 0 | 13693 | 1 |
| C | 0 | 12756 | 1 |
| D | 0 | 16921 | 1 |
| Quadrant | Total seconds | Saturated seconds | Saturation percentage |
|---|---|---|---|
| A | 6261 | 9 | 0.143747% |
| B | 6262 | 57 | 0.910252% |
| C | 6262 | 33 | 0.526988% |
| D | 6262 | 254 | 4.056212% |
Noise dominated data is calculated using 1-second bins in cleaned event files. If a bin has >2000 counts, and if more than 50% of those come from <1% of pixels, then it is considered to be noise-dominated and hence unusable.
| Quadrant | # 1 sec bins | Bins with >0 counts | Bins with >2000 counts | High rate bins dominated by noise | Noise dominated (total time) | Noise dominated (detector-on time) | Marked lightcurve |
|---|---|---|---|---|---|---|---|
| A | 7266 | 6262 | 0 | 0 | 0.00% | 0.00% | 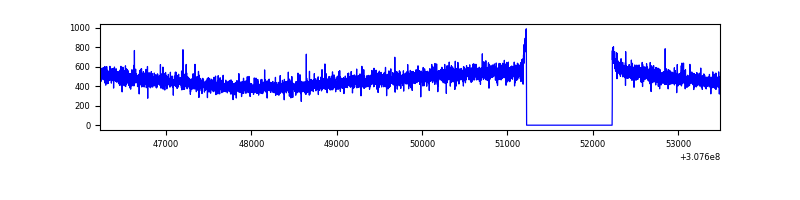 |
| B | 7267 | 6263 | 20 | 20 | 0.28% | 0.32% | 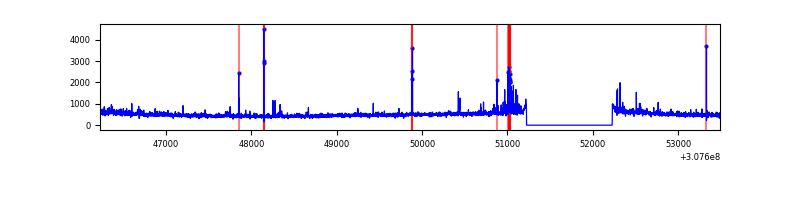 |
| C | 7267 | 6263 | 0 | 0 | 0.00% | 0.00% | 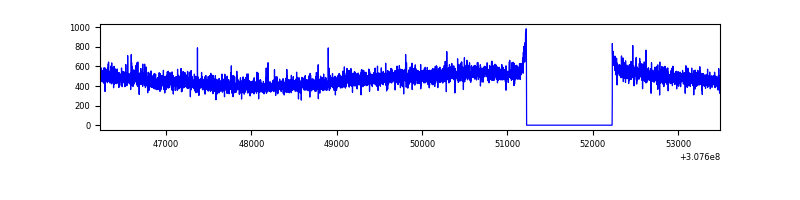 |
| D | 7267 | 6263 | 217 | 217 | 2.99% | 3.46% | 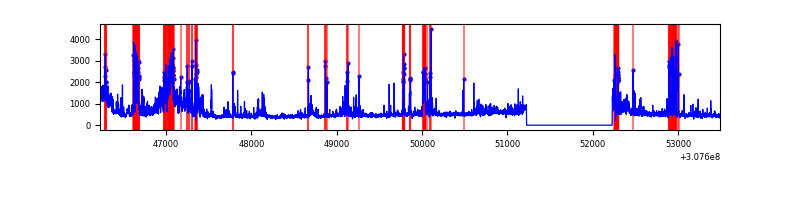 |
Top three noisy pixels from each quadrant. If the there are fewer than three noisy pixels in the level2.evt file, extra rows are filled as -1
| Pixel properties | Quadrant properties | ||||||
|---|---|---|---|---|---|---|---|
| Quadrant | DetID | PixID | Counts | Sigma | Mean | Median | Sigma |
| A | 13 | 254 | 9215 | 54.9 | 760 | 746 | 154.3 |
| A | 0 | 226 | 6679 | 38.46 | 760 | 746 | 154.3 |
| A | 3 | 137 | 6203 | 35.37 | 760 | 746 | 154.3 |
| B | 0 | 189 | 92826 | 623.84 | 767 | 751 | 147.6 |
| B | 0 | 229 | 65848 | 441.06 | 767 | 751 | 147.6 |
| B | 3 | 64 | 45265 | 301.6 | 767 | 751 | 147.6 |
| C | 14 | 238 | 113144 | 652.5 | 727 | 731 | 172.3 |
| C | 10 | 22 | 6329 | 32.49 | 727 | 731 | 172.3 |
| C | 13 | 61 | 5232 | 26.13 | 727 | 731 | 172.3 |
| D | 1 | 20 | 371540 | 2099.73 | 723 | 701 | 176.6 |
| D | 7 | 38 | 339104 | 1916.08 | 723 | 701 | 176.6 |
| D | 1 | 52 | 335806 | 1897.4 | 723 | 701 | 176.6 |
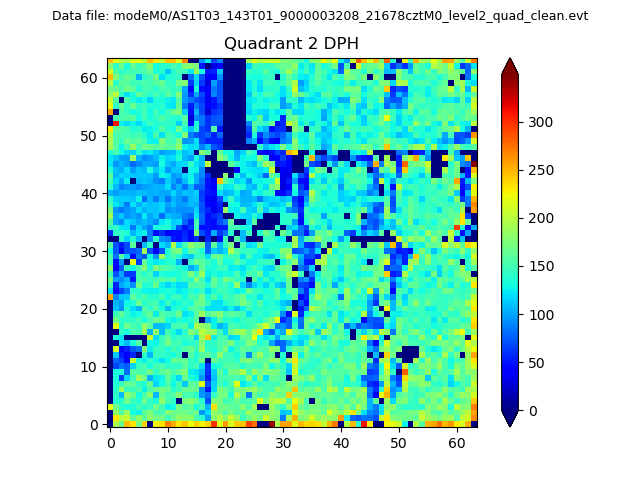
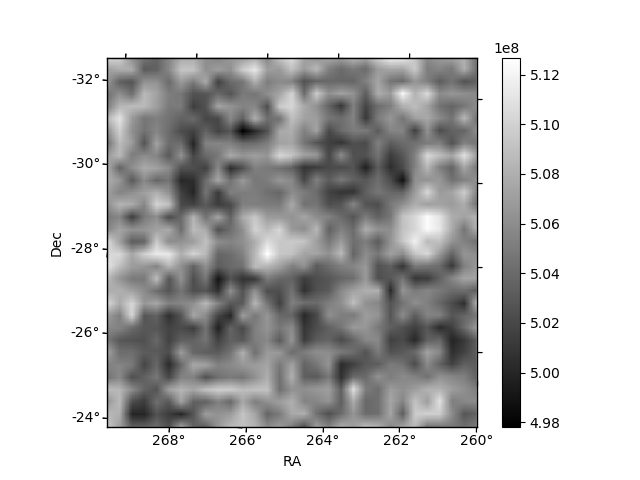
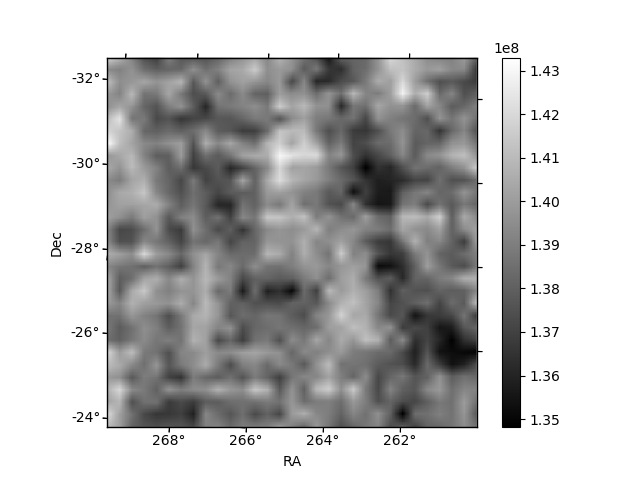
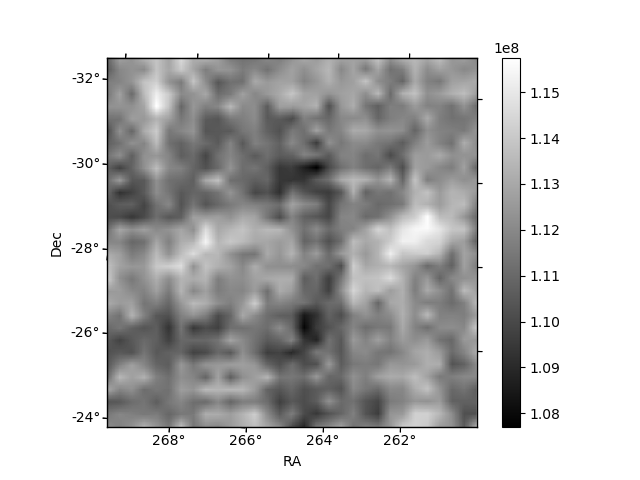
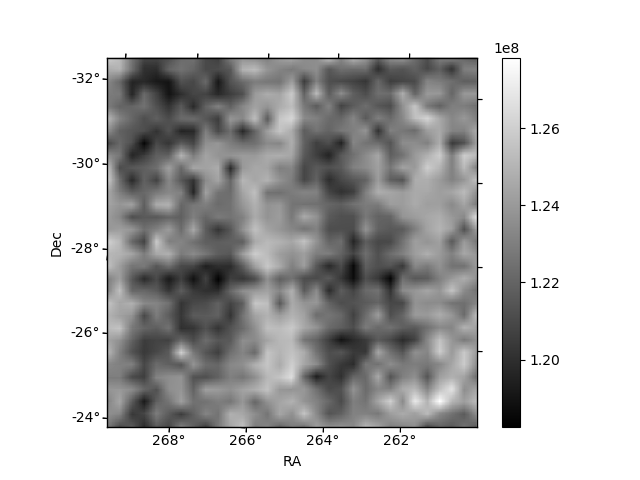
Histogram calculated using DETX and DETY for each event in the final _common_clean file
| Quadrant A | 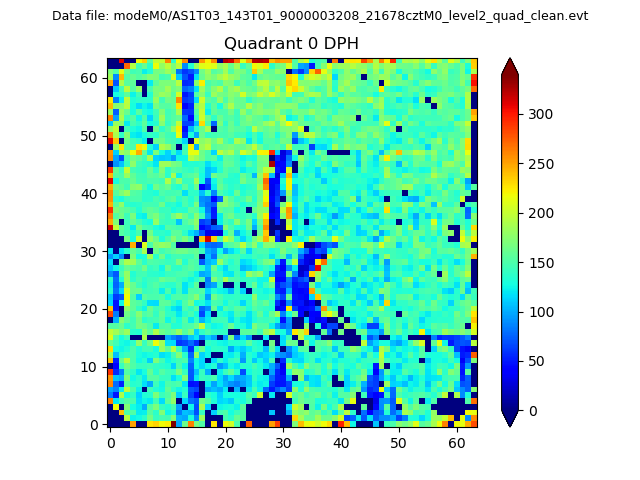 |
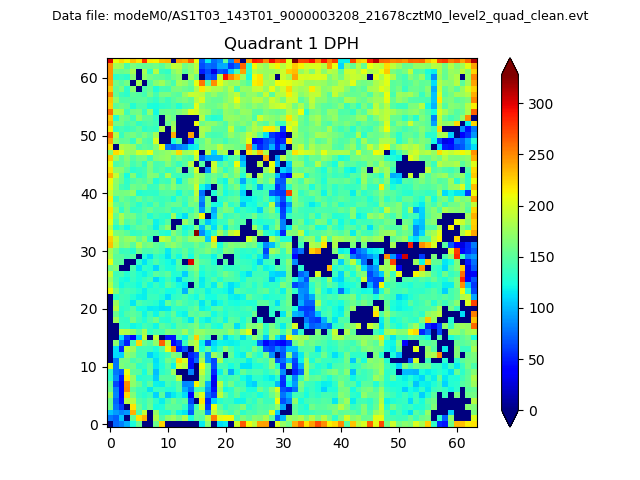 |
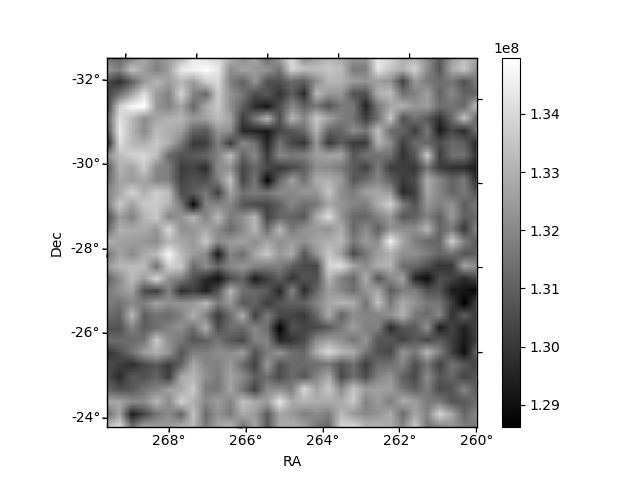
Quadrant B |
|---|---|---|---|
| Quadrant D | 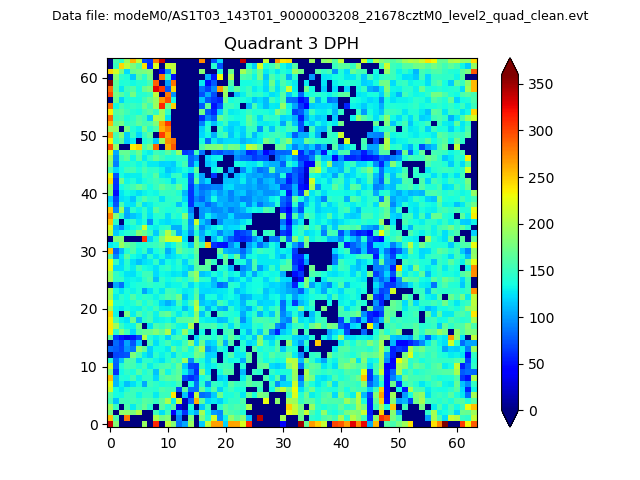 |
 |
Quadrant C |
| Plot type | Count rate plots | Images |
|---|---|---|
| Comparison with Poisson distribution Blue bars denote a histogram of data divided into 1 sec bins. Red curve is a Poisson curve with rate = median count rate of data. |
 |
 |
| Quadrant-wise count rates Data is divided into 100 sec bins |
 |
|
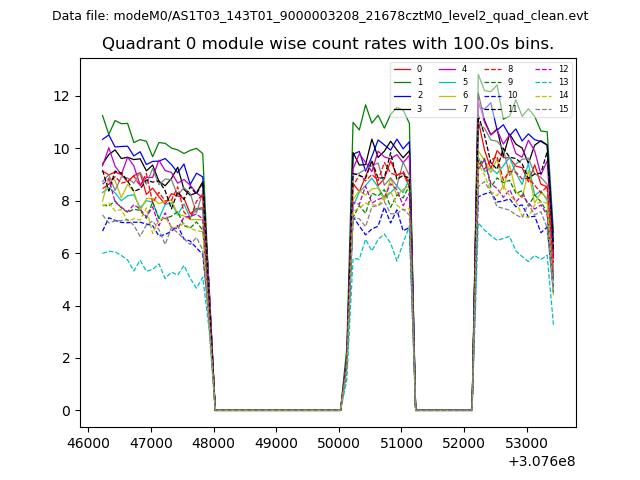
| Module-wise count rates for Quadrant A Data is divided into 100 sec bins |
 |
 |
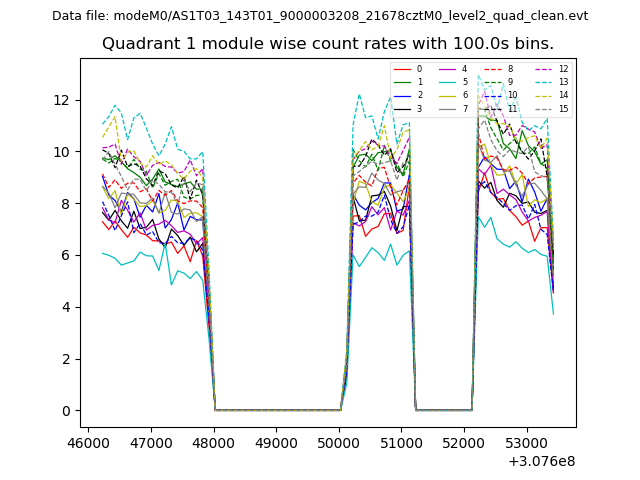
| Module-wise count rates for Quadrant B Data is divided into 100 sec bins |
 |
 |
| Module-wise count rates for Quadrant C Data is divided into 100 sec bins |
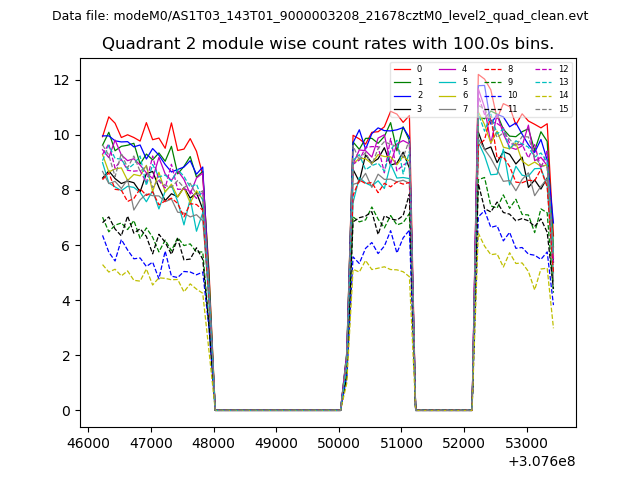 |
 |
| Module-wise count rates for Quadrant D Data is divided into 100 sec bins |
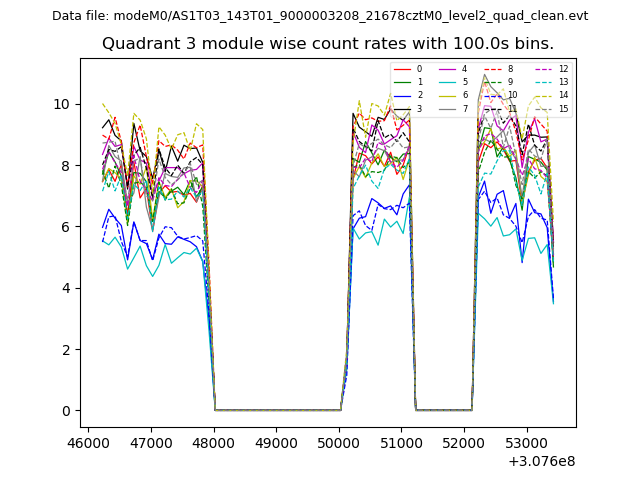 |
 |
| Parameter | Plot |
|---|---|
| CZT HV Monitor | 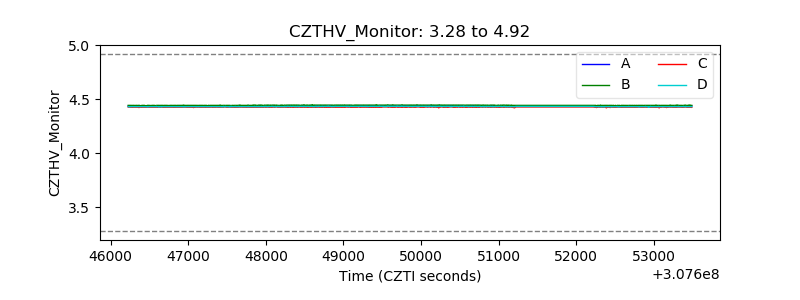 |
| D_VDD | 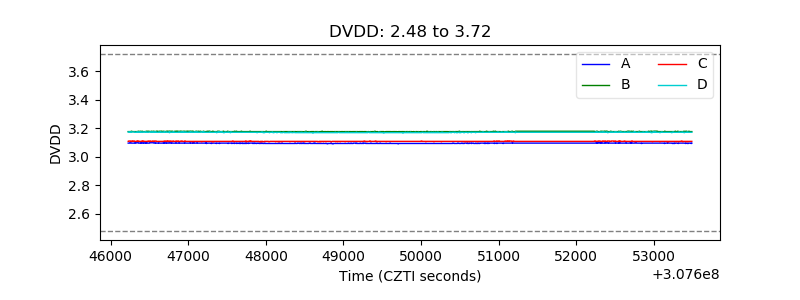 |
| Temperature 1 |  |
| Veto HV Monitor | 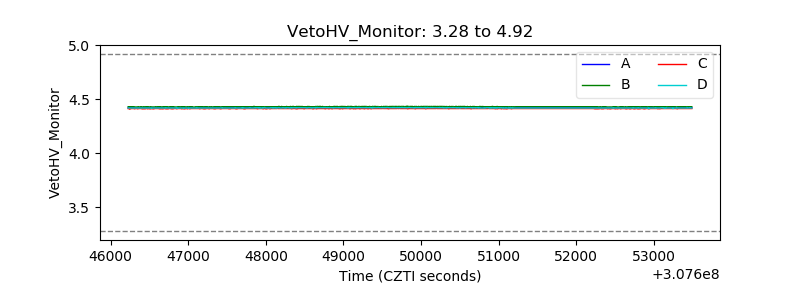 |
| Veto LLD | 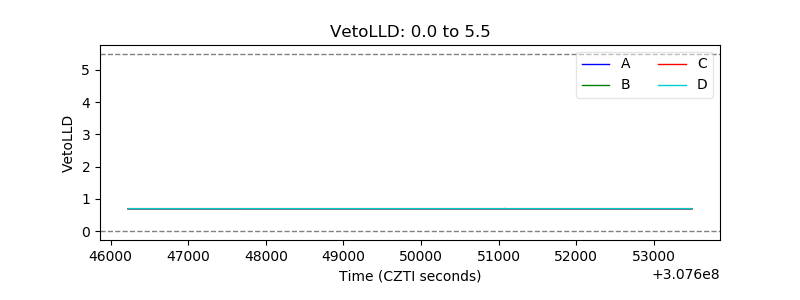 |
| Alpha Counter |  |
| _CPM_Rate | 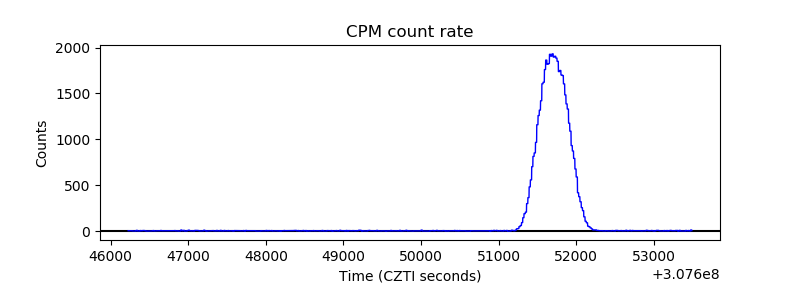 |
| CZT Counter |  |
| +2.5 Volts monitor |  |
| +5 Volts monitor |  |
| _ROLL_ROT | 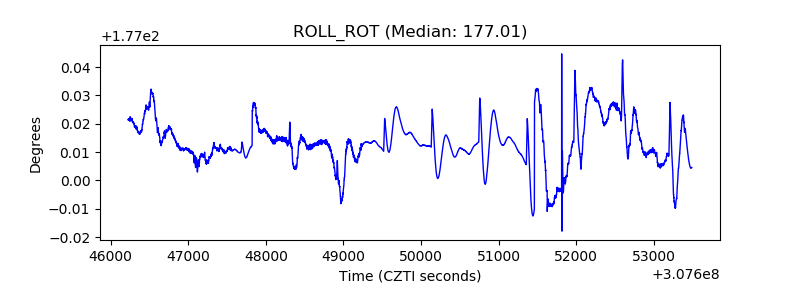 |
| _Roll_DEC | 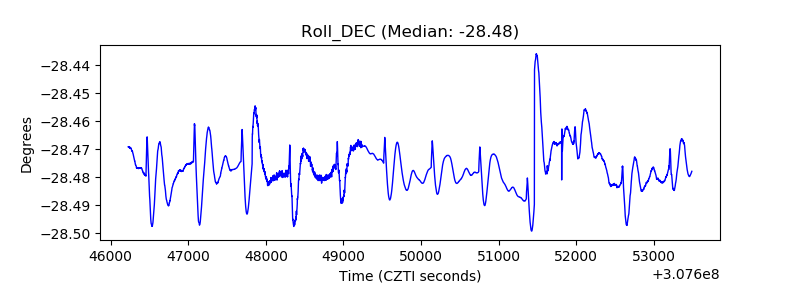 |
| _Roll_RA |  |
| Veto Counter | 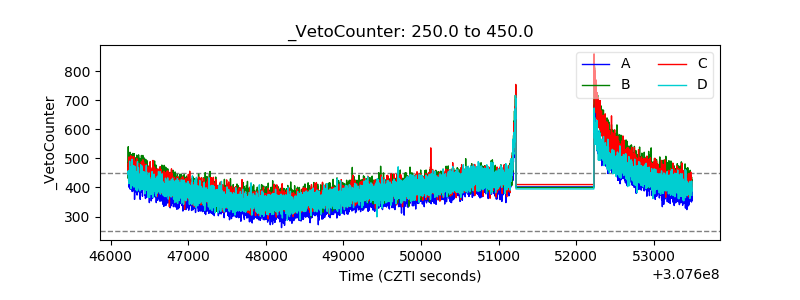 |