| Param | Original file | Final file |
|---|---|---|
| Filename | modeM0/AS1T03_143T01_9000003208_21685cztM0_level2.evt | modeM0/AS1T03_143T01_9000003208_21685cztM0_level2_quad_clean.evt |
| Size (bytes) | 250,971,840 | 23,765,760 |
| Size | 239.3 MB | 22.7 MB |
| Events in quadrant A | 1,406,687 | 140,928 |
| Events in quadrant B | 1,455,491 | 145,877 |
| Events in quadrant C | 1,429,679 | 139,208 |
| Events in quadrant D | 3,119,156 | 94,936 |
| Mode SS | |||
|---|---|---|---|
| Quadrant | BADHDUFLAG | Total packets | Discarded packets |
| A | 0 | 56 | 0 |
| B | 0 | 56 | 0 |
| C | 0 | 56 | 0 |
| D | 0 | 56 | 0 |
| Mode M9 | |||
|---|---|---|---|
| Quadrant | BADHDUFLAG | Total packets | Discarded packets |
| A | 0 | 3 | 0 |
| B | 0 | 4 | 0 |
| C | 0 | 4 | 0 |
| D | 0 | 4 | 0 |
| Mode M0 | |||
|---|---|---|---|
| Quadrant | BADHDUFLAG | Total packets | Discarded packets |
| A | 0 | 5706 | 1 |
| B | 0 | 5850 | 1 |
| C | 0 | 5758 | 1 |
| D | 0 | 11132 | 1 |
| Quadrant | Total seconds | Saturated seconds | Saturation percentage |
|---|---|---|---|
| A | 2763 | 4 | 0.144770% |
| B | 2763 | 16 | 0.579081% |
| C | 2763 | 22 | 0.796236% |
| D | 2763 | 521 | 18.856316% |
Noise dominated data is calculated using 1-second bins in cleaned event files. If a bin has >2000 counts, and if more than 50% of those come from <1% of pixels, then it is considered to be noise-dominated and hence unusable.
| Quadrant | # 1 sec bins | Bins with >0 counts | Bins with >2000 counts | High rate bins dominated by noise | Noise dominated (total time) | Noise dominated (detector-on time) | Marked lightcurve |
|---|---|---|---|---|---|---|---|
| A | 2763 | 2763 | 0 | 0 | 0.00% | 0.00% | 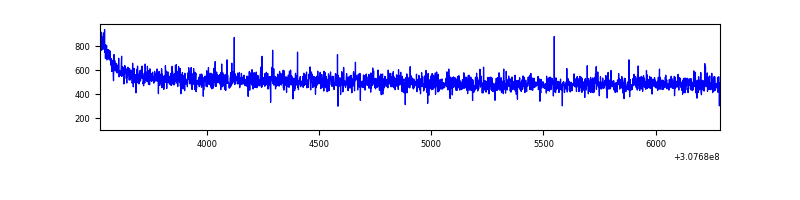 |
| B | 2763 | 2763 | 1 | 1 | 0.04% | 0.04% | 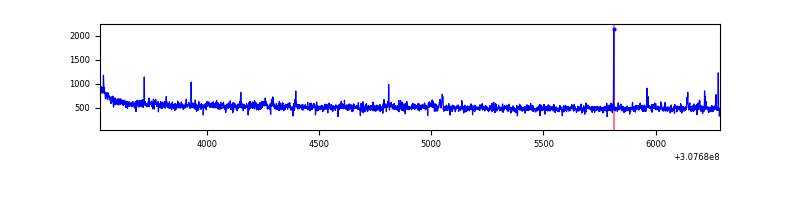 |
| C | 2763 | 2763 | 0 | 0 | 0.00% | 0.00% | 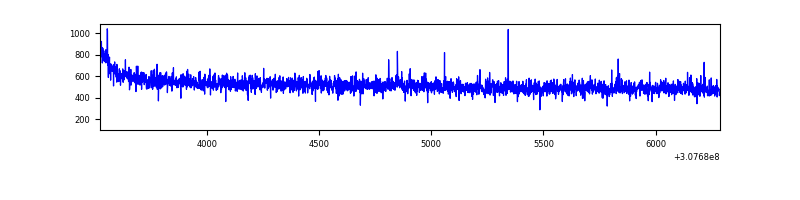 |
| D | 2763 | 2763 | 470 | 470 | 17.01% | 17.01% | 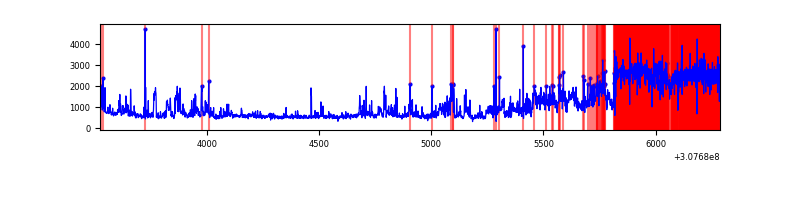 |
Top three noisy pixels from each quadrant. If the there are fewer than three noisy pixels in the level2.evt file, extra rows are filled as -1
| Pixel properties | Quadrant properties | ||||||
|---|---|---|---|---|---|---|---|
| Quadrant | DetID | PixID | Counts | Sigma | Mean | Median | Sigma |
| A | 15 | 236 | 13363 | 176.98 | 361 | 354 | 73.5 |
| A | 13 | 254 | 5168 | 65.49 | 361 | 354 | 73.5 |
| A | 0 | 226 | 3119 | 37.62 | 361 | 354 | 73.5 |
| B | 0 | 229 | 17884 | 253.18 | 362 | 354 | 69.2 |
| B | 12 | 111 | 7977 | 110.1 | 362 | 354 | 69.2 |
| B | 3 | 64 | 7916 | 109.22 | 362 | 354 | 69.2 |
| C | 14 | 238 | 56845 | 682.27 | 351 | 354 | 82.8 |
| C | 13 | 61 | 2487 | 25.76 | 351 | 354 | 82.8 |
| C | 10 | 22 | 1777 | 17.19 | 351 | 354 | 82.8 |
| D | 1 | 20 | 1156661 | 14768.62 | 320 | 310 | 78.3 |
| D | 7 | 238 | 474129 | 6051.5 | 320 | 310 | 78.3 |
| D | 2 | 136 | 84751 | 1078.46 | 320 | 310 | 78.3 |
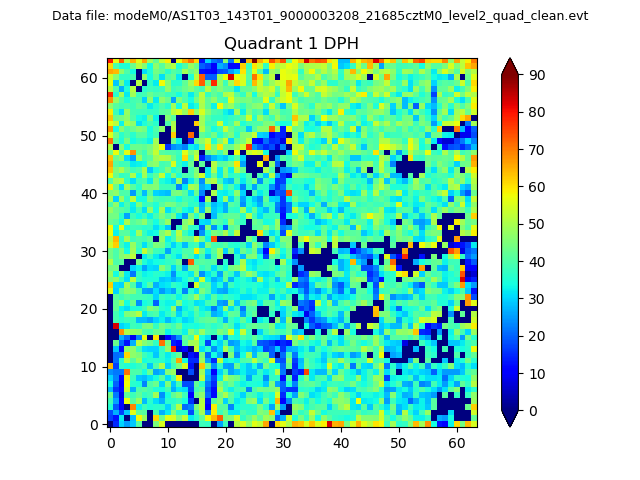
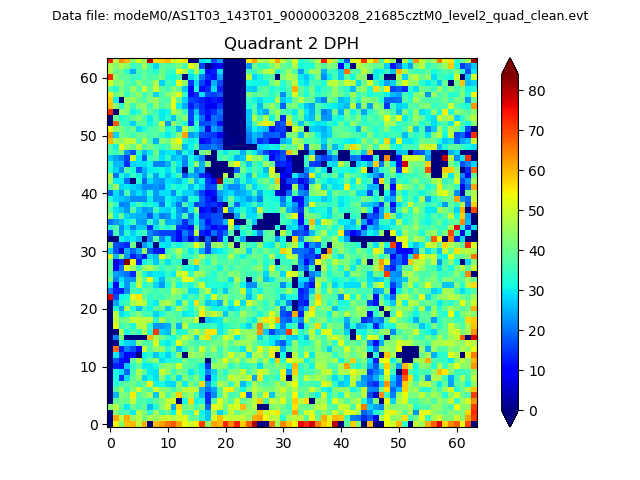
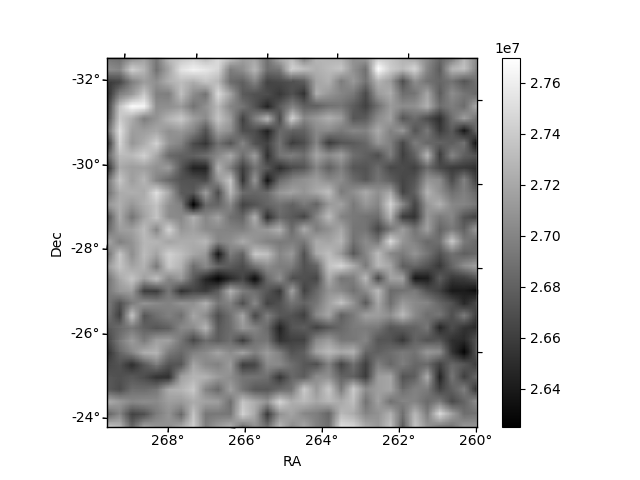
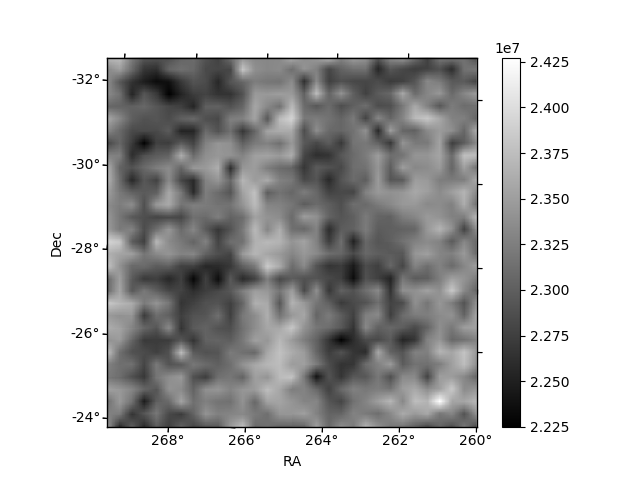
Histogram calculated using DETX and DETY for each event in the final _common_clean file
| Quadrant A |  |
 |
Quadrant B |
|---|---|---|---|
| Quadrant D |  |
 |
Quadrant C |
| Plot type | Count rate plots | Images |
|---|---|---|
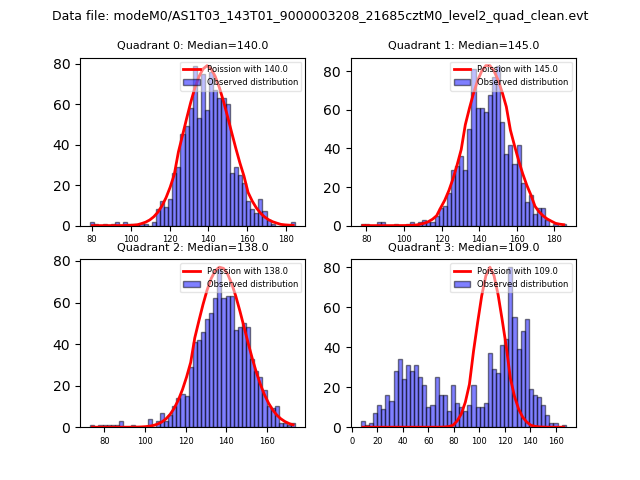
| Comparison with Poisson distribution Blue bars denote a histogram of data divided into 1 sec bins. Red curve is a Poisson curve with rate = median count rate of data. |
 |
 |
| Quadrant-wise count rates Data is divided into 100 sec bins |
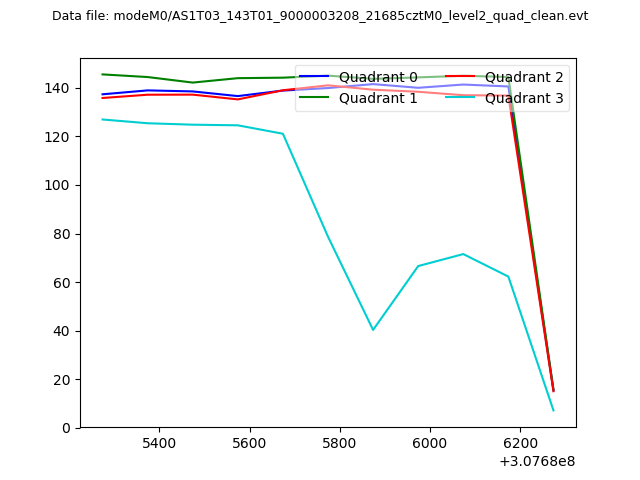 |
|
| Module-wise count rates for Quadrant A Data is divided into 100 sec bins |
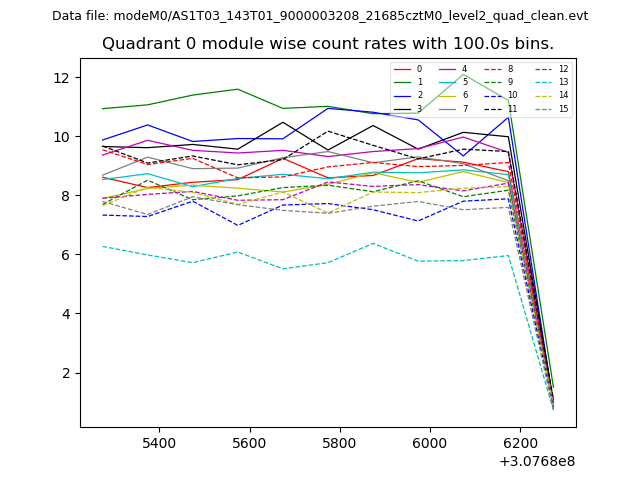 |
 |
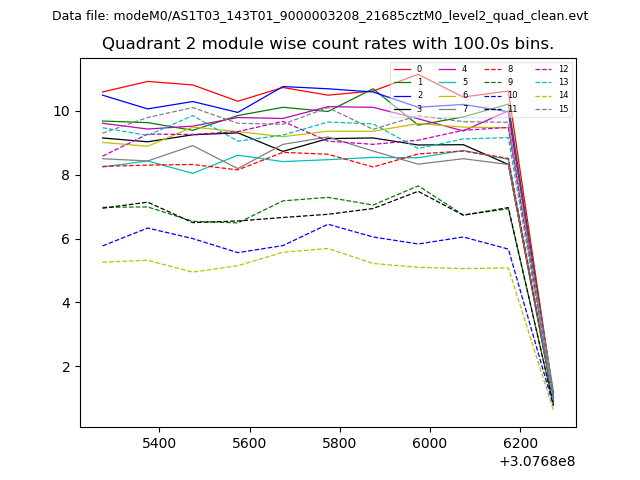
| Module-wise count rates for Quadrant B Data is divided into 100 sec bins |
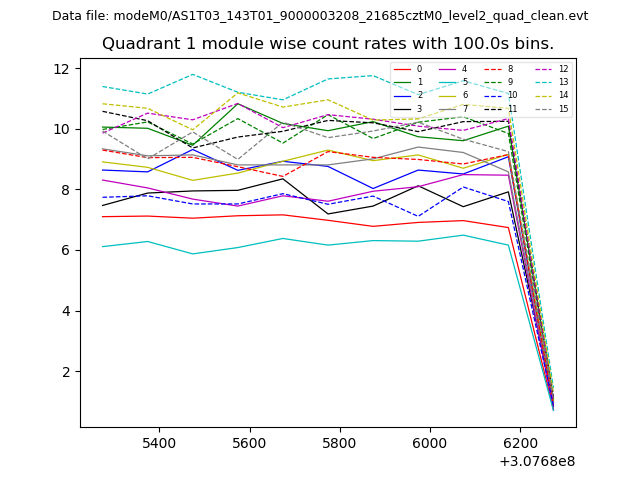 |
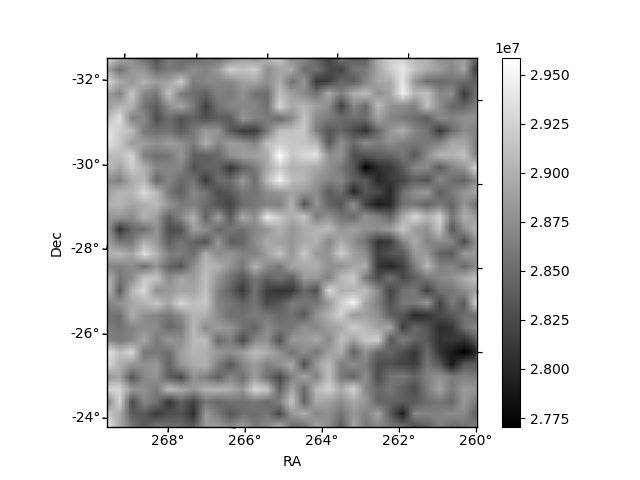 |
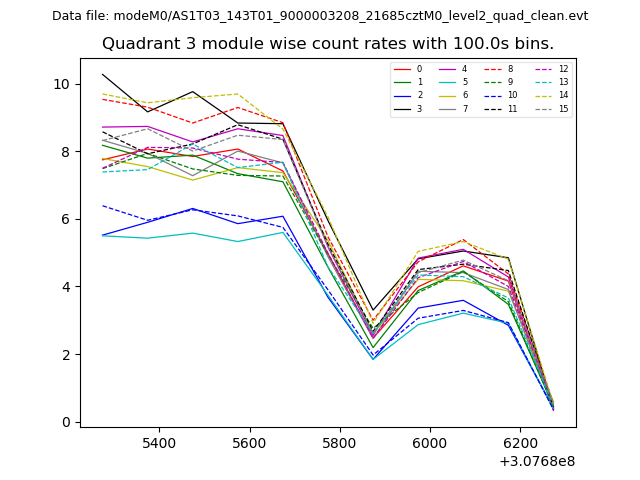
| Module-wise count rates for Quadrant C Data is divided into 100 sec bins |
 |
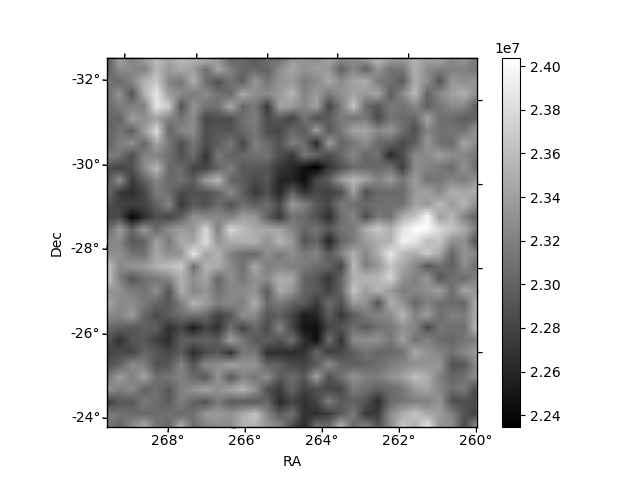 |
| Module-wise count rates for Quadrant D Data is divided into 100 sec bins |
 |
 |
| Parameter | Plot |
|---|---|
| CZT HV Monitor |  |
| D_VDD | 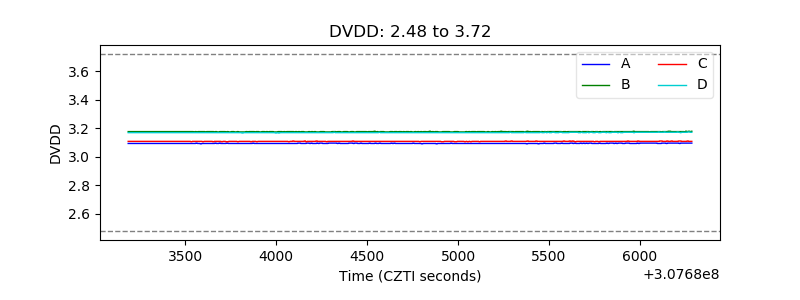 |
| Temperature 1 | 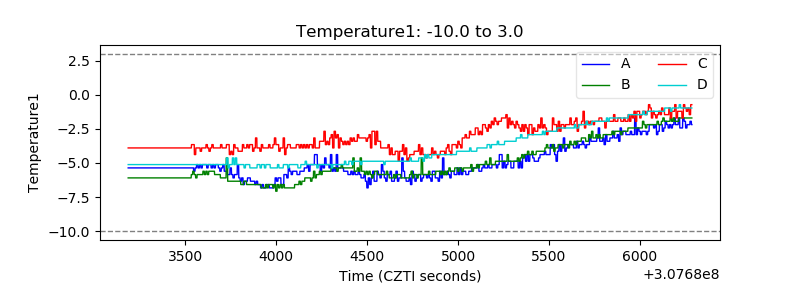 |
| Veto HV Monitor | 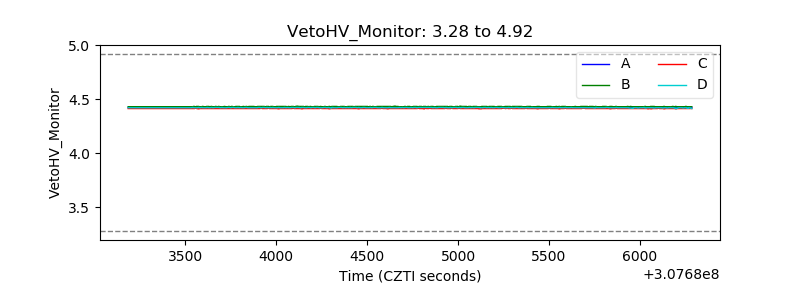 |
| Veto LLD | 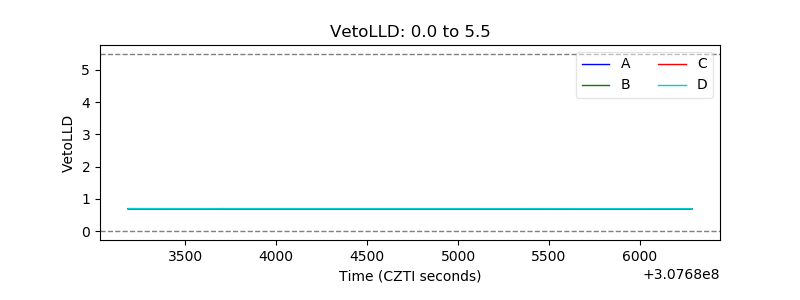 |
| Alpha Counter | 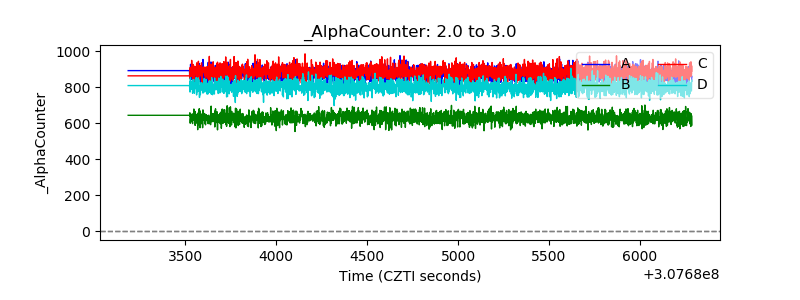 |
| _CPM_Rate | 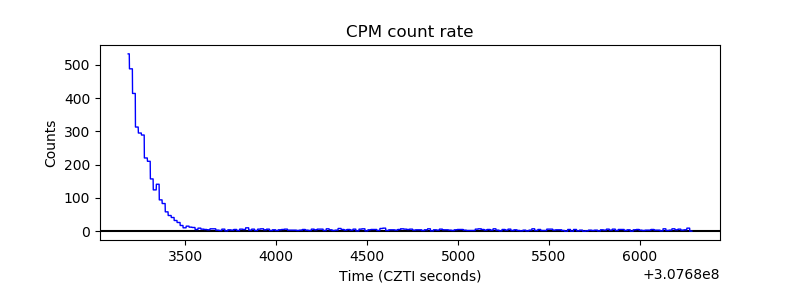 |
| CZT Counter | 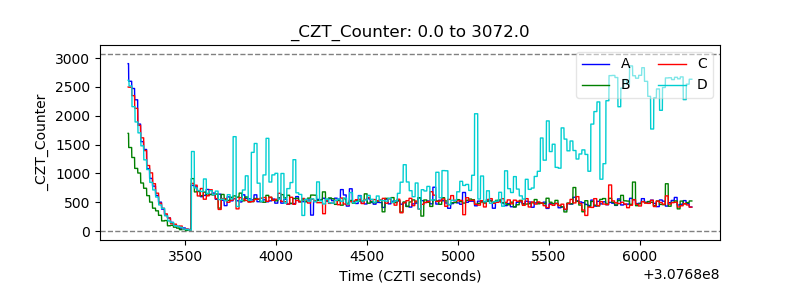 |
| +2.5 Volts monitor |  |
| +5 Volts monitor |  |
| _ROLL_ROT | 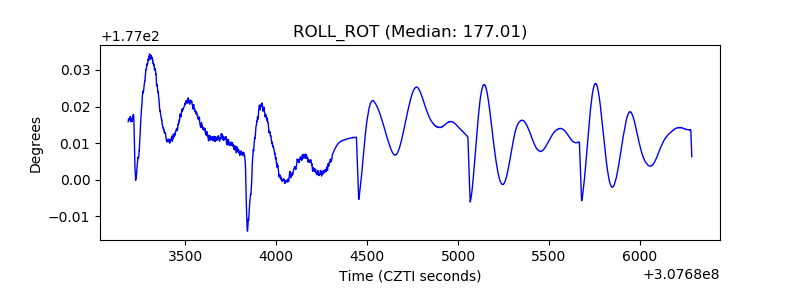 |
| _Roll_DEC | 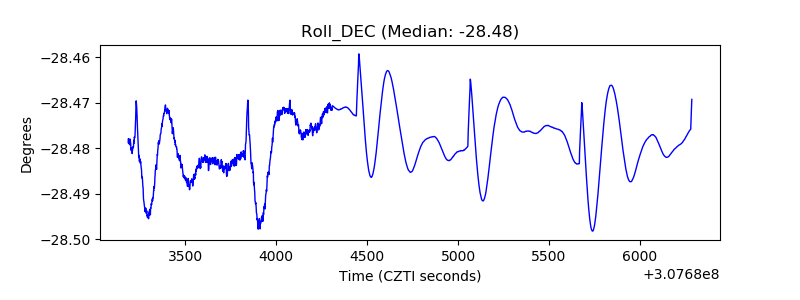 |
| _Roll_RA | 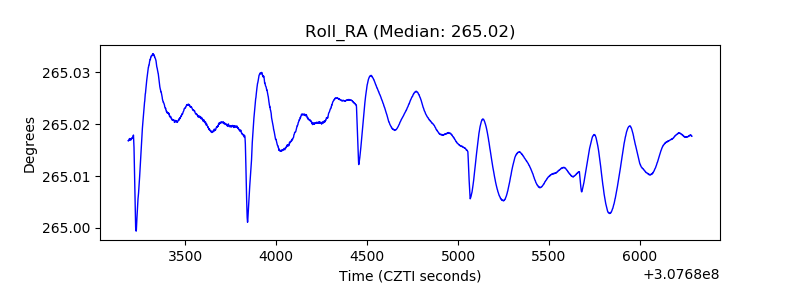 |
| Veto Counter | 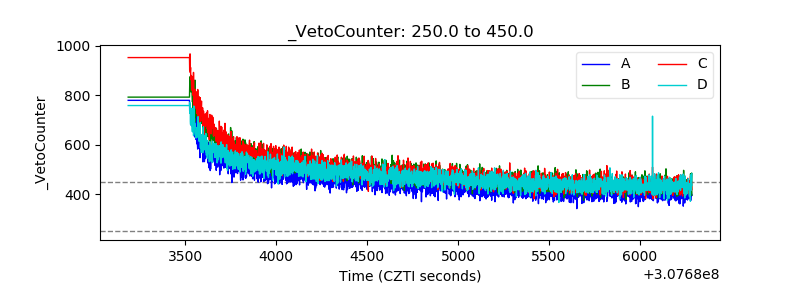 |