| Param | Original file | Final file |
|---|---|---|
| Filename | modeM0/AS1A07_006T04_9000003210cztM0_level2.fits | modeM0/AS1A07_006T04_9000003210cztM0_level2_quad_clean.evt |
| Size (bytes) | 427,262,400 | 506,750,400 |
| Size | 407.5 MB | 483.3 MB |
| Events in quadrant A | 2,609,750 | 3,178,265 |
| Events in quadrant B | 2,478,896 | 3,238,864 |
| Events in quadrant C | 2,552,054 | 3,057,762 |
| Events in quadrant D | 2,159,550 | 2,735,903 |
| Mode SS | |||
|---|---|---|---|
| Quadrant | BADHDUFLAG | Total packets | Discarded packets |
| A | 0 | 928 | 0 |
| B | 0 | 928 | 0 |
| C | 0 | 928 | 0 |
| D | 0 | 928 | 0 |
| Mode M0 | |||
|---|---|---|---|
| Quadrant | BADHDUFLAG | Total packets | Discarded packets |
| A | 0 | 96149 | 0 |
| B | 0 | 99361 | 0 |
| C | 0 | 102776 | 0 |
| D | 0 | 130143 | 0 |
| Mode M9 | |||
|---|---|---|---|
| Quadrant | BADHDUFLAG | Total packets | Discarded packets |
| A | 0 | 52 | 0 |
| B | 0 | 52 | 0 |
| C | 0 | 52 | 0 |
| D | 0 | 52 | 0 |
| Quadrant | Total seconds | Saturated seconds | Saturation percentage |
|---|---|---|---|
| A | 45715 | 766 | 1.675599% |
| B | 45715 | 1529 | 3.344635% |
| C | 45715 | 1378 | 3.014328% |
| D | 45715 | 3053 | 6.678333% |
Noise dominated data is calculated using 1-second bins in cleaned event files. If a bin has >2000 counts, and if more than 50% of those come from <1% of pixels, then it is considered to be noise-dominated and hence unusable.
| Quadrant | # 1 sec bins | Bins with >0 counts | Bins with >2000 counts | High rate bins dominated by noise | Noise dominated (total time) | Noise dominated (detector-on time) | Marked lightcurve |
|---|---|---|---|---|---|---|---|
| A | 54442 | 45719 | 0 | 0 | 0.00% | 0.00% |  |
| B | 54442 | 45397 | 0 | 0 | 0.00% | 0.00% | 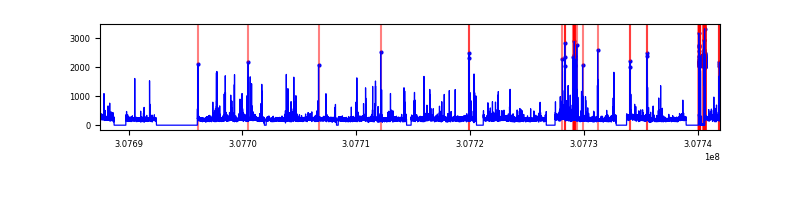 |
| C | 54442 | 45718 | 0 | 0 | 0.00% | 0.00% |  |
| D | 54442 | 45614 | 0 | 0 | 0.00% | 0.00% |  |
Top three noisy pixels from each quadrant. If the there are fewer than three noisy pixels in the level2.evt file, extra rows are filled as -1
| Pixel properties | Quadrant properties | ||||||
|---|---|---|---|---|---|---|---|
| Quadrant | DetID | PixID | Counts | Sigma | Mean | Median | Sigma |
| A | 0 | 29 | 2457 | 10.64 | 679 | 637 | 171.0 |
| A | 7 | 110 | 2110 | 8.61 | 679 | 637 | 171.0 |
| A | 9 | 19 | 1944 | 7.64 | 679 | 637 | 171.0 |
| B | 2 | 9 | 2079 | 11.19 | 655 | 626 | 129.8 |
| B | 2 | 8 | 1764 | 8.77 | 655 | 626 | 129.8 |
| B | 5 | 232 | 1612 | 7.59 | 655 | 626 | 129.8 |
| C | 12 | 241 | 1898 | 7.29 | 673 | 627 | 174.4 |
| C | 3 | 234 | 1734 | 6.35 | 673 | 627 | 174.4 |
| C | 12 | 250 | 1716 | 6.24 | 673 | 627 | 174.4 |
| D | 3 | 14 | 1598 | 6.23 | 616 | 558 | 166.9 |
| D | 6 | 231 | 1568 | 6.05 | 616 | 558 | 166.9 |
| D | 6 | 67 | 1568 | 6.05 | 616 | 558 | 166.9 |
Histogram calculated using DETX and DETY for each event in the final _common_clean file
| Quadrant A | 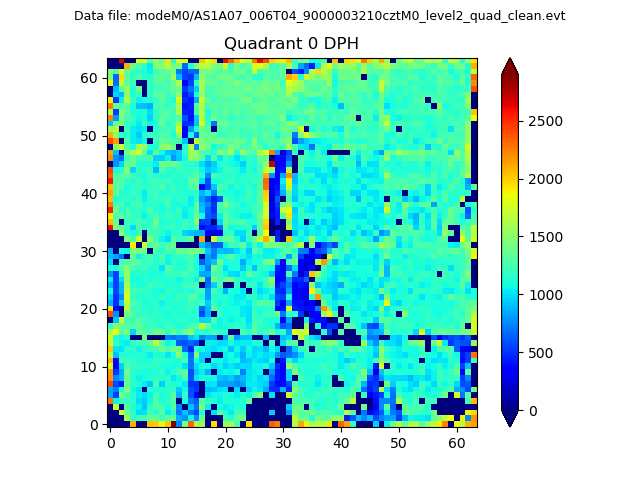 |
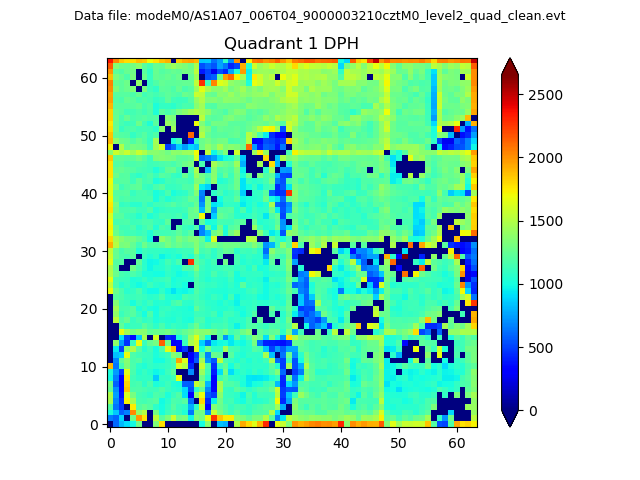 |
Quadrant B |
|---|---|---|---|
| Quadrant D | 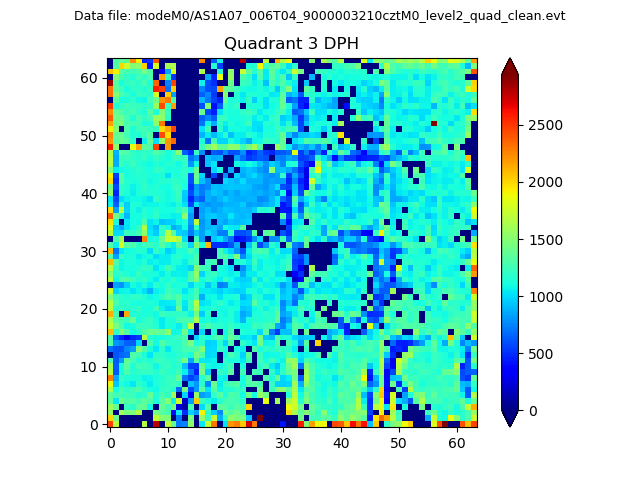 |
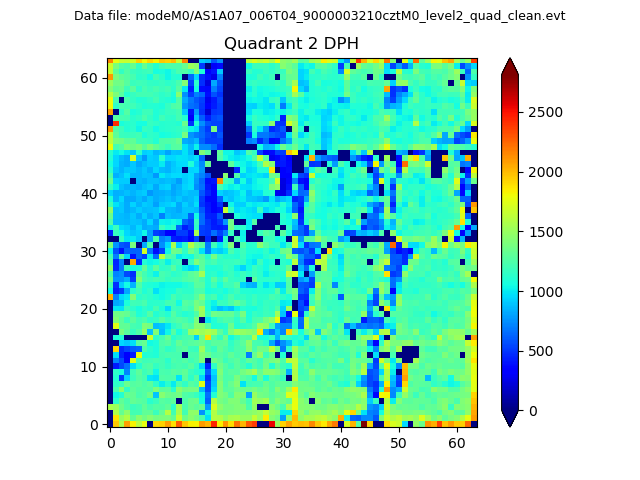 |
Quadrant C |
| Plot type | Count rate plots | Images |
|---|---|---|
| Comparison with Poisson distribution Blue bars denote a histogram of data divided into 1 sec bins. Red curve is a Poisson curve with rate = median count rate of data. |
 |
 |
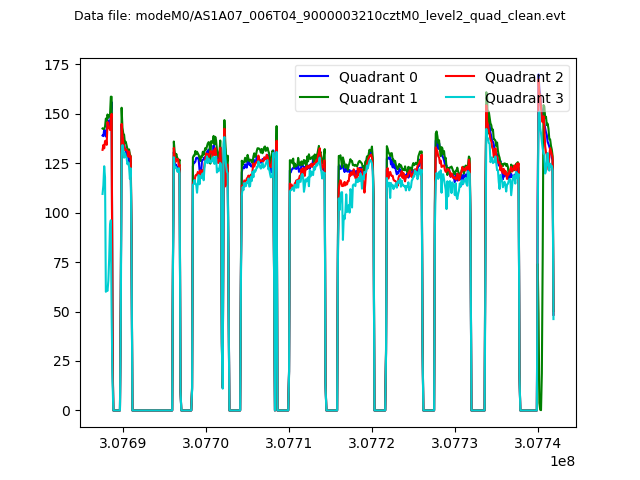
| Quadrant-wise count rates Data is divided into 100 sec bins |
 |
|
| Module-wise count rates for Quadrant A Data is divided into 100 sec bins |
 |
 |
| Module-wise count rates for Quadrant B Data is divided into 100 sec bins |
 |
 |
| Module-wise count rates for Quadrant C Data is divided into 100 sec bins |
 |
 |
| Module-wise count rates for Quadrant D Data is divided into 100 sec bins |
 |
 |
| Parameter | Plot |
|---|---|
| CZT HV Monitor |  |
| D_VDD | 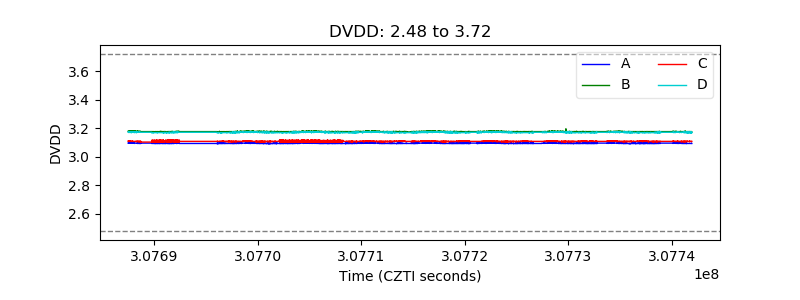 |
| Temperature 1 |  |
| Veto HV Monitor |  |
| Veto LLD | 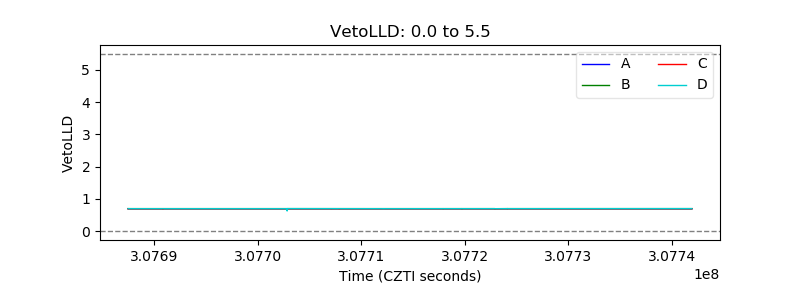 |
| Alpha Counter | 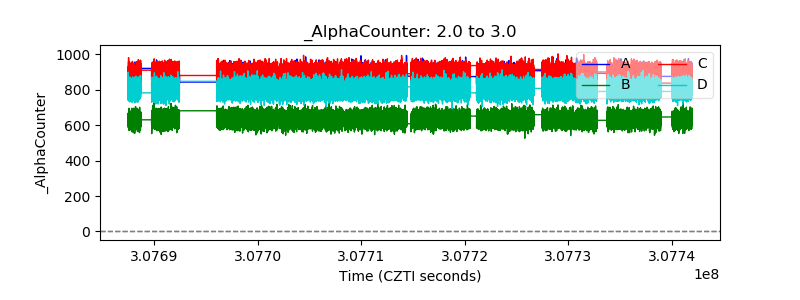 |
| _CPM_Rate |  |
| CZT Counter |  |
| +2.5 Volts monitor |  |
| +5 Volts monitor |  |
| _ROLL_ROT |  |
| _Roll_DEC | 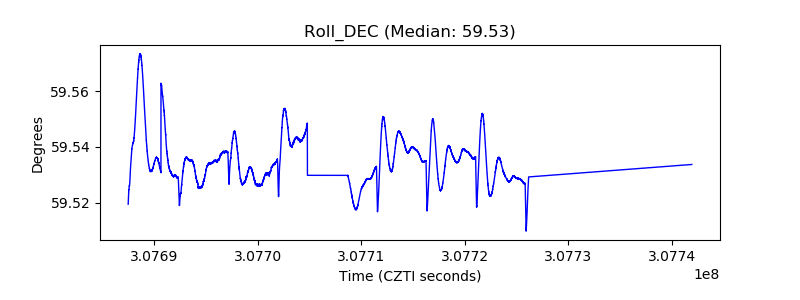 |
| _Roll_RA |  |
| Veto Counter |  |