| Param | Original file | Final file |
|---|---|---|
| Filename | modeM0/AS1A07_006T04_9000003210_21686cztM0_level2.evt | modeM0/AS1A07_006T04_9000003210_21686cztM0_level2_quad_clean.evt |
| Size (bytes) | 481,573,440 | 96,647,040 |
| Size | 459.3 MB | 92.2 MB |
| Events in quadrant A | 3,274,797 | 618,966 |
| Events in quadrant B | 3,378,576 | 637,588 |
| Events in quadrant C | 3,144,359 | 613,230 |
| Events in quadrant D | 4,330,633 | 588,985 |
| Mode SS | |||
|---|---|---|---|
| Quadrant | BADHDUFLAG | Total packets | Discarded packets |
| A | 0 | 138 | 0 |
| B | 0 | 138 | 0 |
| C | 0 | 138 | 0 |
| D | 0 | 138 | 0 |
| Mode M0 | |||
|---|---|---|---|
| Quadrant | BADHDUFLAG | Total packets | Discarded packets |
| A | 0 | 14002 | 1 |
| B | 0 | 14267 | 1 |
| C | 0 | 13675 | 1 |
| D | 0 | 17363 | 3 |
| Mode M9 | |||
|---|---|---|---|
| Quadrant | BADHDUFLAG | Total packets | Discarded packets |
| A | 0 | 6 | 0 |
| B | 0 | 6 | 0 |
| C | 0 | 6 | 0 |
| D | 0 | 6 | 0 |
| Quadrant | Total seconds | Saturated seconds | Saturation percentage |
|---|---|---|---|
| A | 6709 | 93 | 1.386198% |
| B | 6710 | 130 | 1.937407% |
| C | 6710 | 104 | 1.549925% |
| D | 6709 | 179 | 2.668058% |
Noise dominated data is calculated using 1-second bins in cleaned event files. If a bin has >2000 counts, and if more than 50% of those come from <1% of pixels, then it is considered to be noise-dominated and hence unusable.
| Quadrant | # 1 sec bins | Bins with >0 counts | Bins with >2000 counts | High rate bins dominated by noise | Noise dominated (total time) | Noise dominated (detector-on time) | Marked lightcurve |
|---|---|---|---|---|---|---|---|
| A | 7364 | 6710 | 1 | 1 | 0.01% | 0.01% | 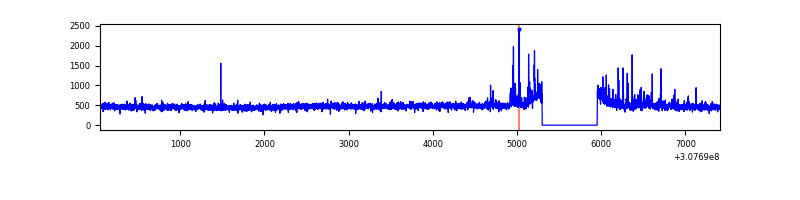 |
| B | 7365 | 6711 | 21 | 21 | 0.29% | 0.31% |  |
| C | 7365 | 6711 | 0 | 0 | 0.00% | 0.00% | 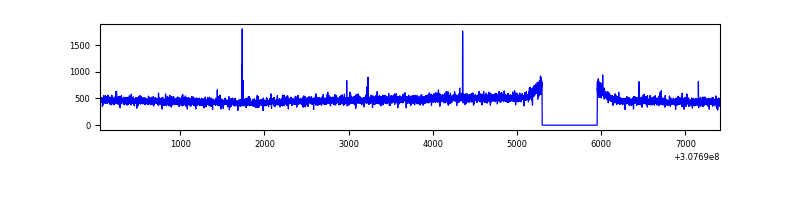 |
| D | 7364 | 6710 | 102 | 102 | 1.39% | 1.52% |  |
Top three noisy pixels from each quadrant. If the there are fewer than three noisy pixels in the level2.evt file, extra rows are filled as -1
| Pixel properties | Quadrant properties | ||||||
|---|---|---|---|---|---|---|---|
| Quadrant | DetID | PixID | Counts | Sigma | Mean | Median | Sigma |
| A | 4 | 2 | 126183 | 785.2 | 798 | 781 | 159.7 |
| A | 15 | 236 | 68584 | 424.55 | 798 | 781 | 159.7 |
| A | 13 | 254 | 11683 | 68.26 | 798 | 781 | 159.7 |
| B | 3 | 64 | 166225 | 1097.59 | 801 | 780 | 150.7 |
| B | 0 | 229 | 47630 | 310.81 | 801 | 780 | 150.7 |
| B | 12 | 111 | 18320 | 116.36 | 801 | 780 | 150.7 |
| C | 14 | 238 | 124156 | 692.93 | 769 | 775 | 178.1 |
| C | 10 | 22 | 8518 | 43.49 | 769 | 775 | 178.1 |
| C | 8 | 128 | 8399 | 42.82 | 769 | 775 | 178.1 |
| D | 1 | 52 | 319035 | 1708.99 | 769 | 743 | 186.2 |
| D | 12 | 235 | 270187 | 1446.72 | 769 | 743 | 186.2 |
| D | 1 | 20 | 255626 | 1368.53 | 769 | 743 | 186.2 |
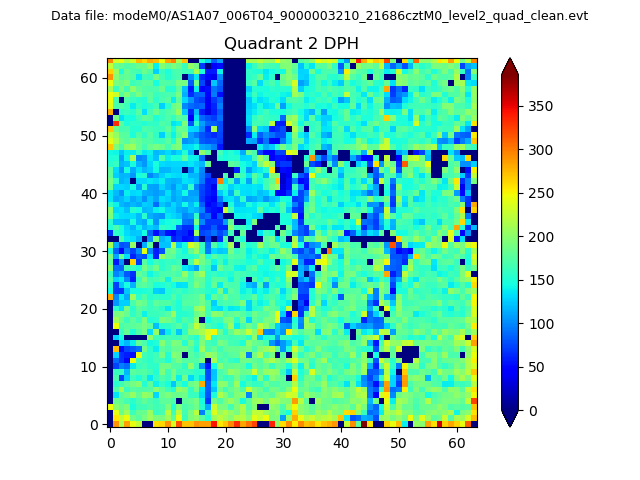
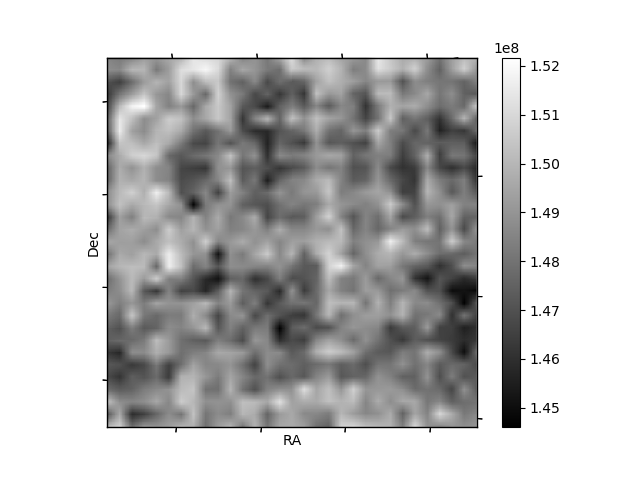
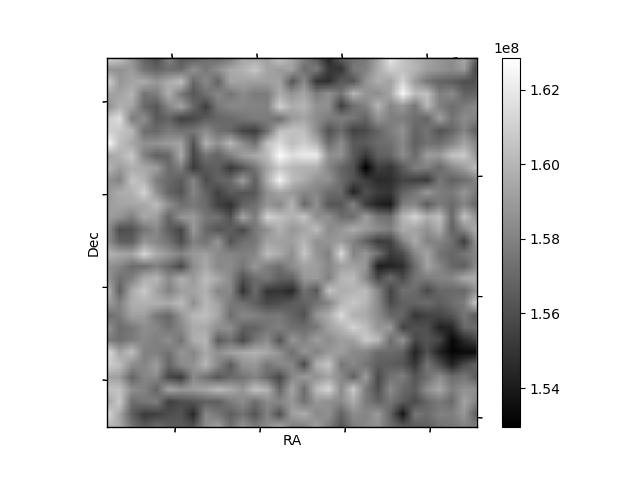
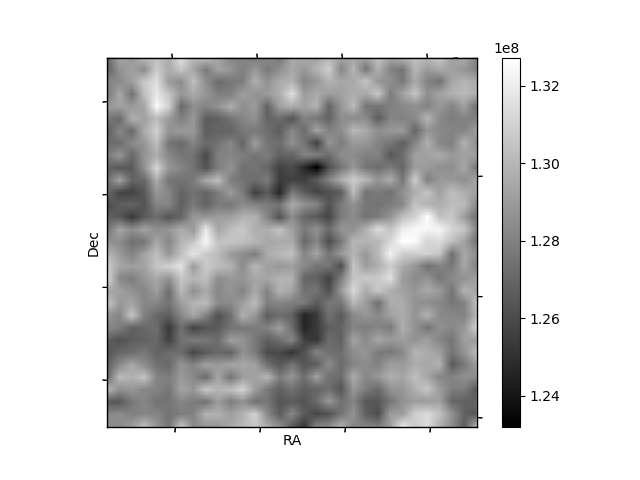
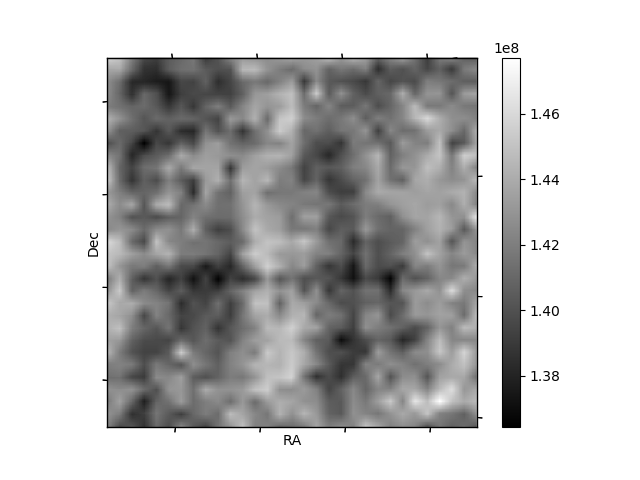
Histogram calculated using DETX and DETY for each event in the final _common_clean file
| Quadrant A | 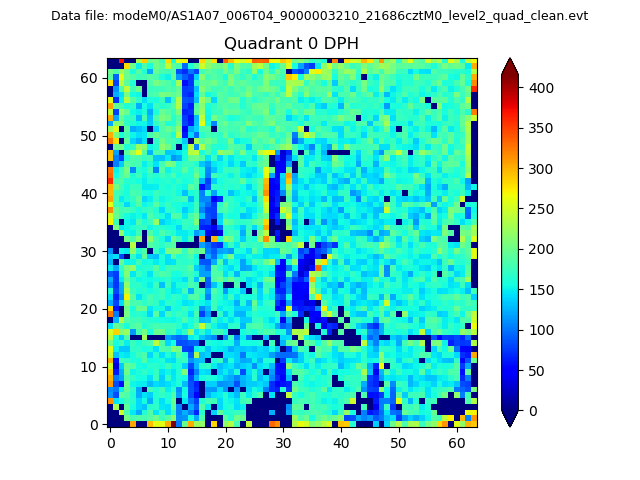 |
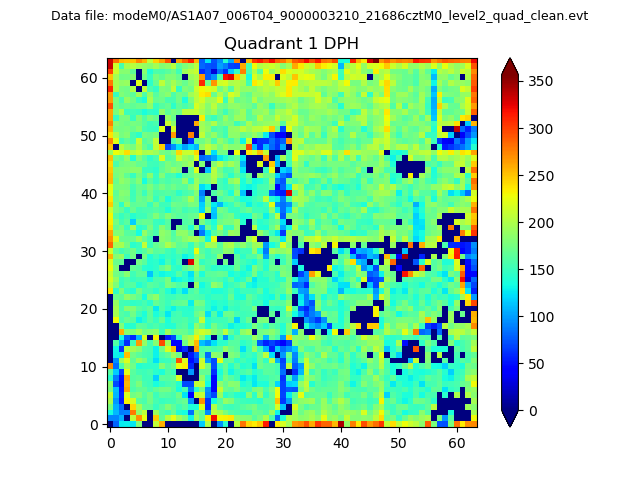 |
Quadrant B |
|---|---|---|---|
| Quadrant D | 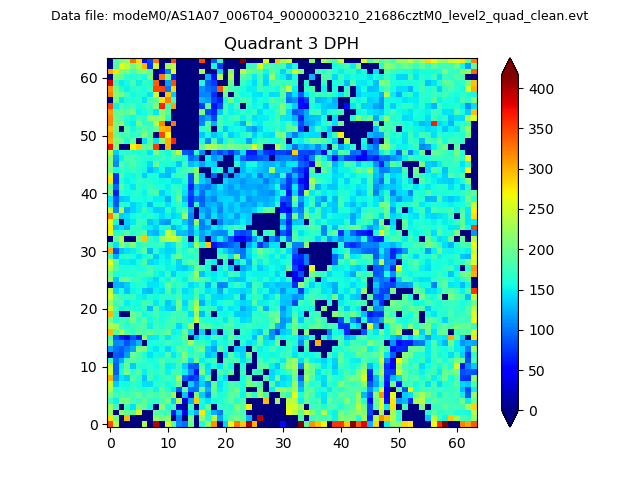 |
 |
Quadrant C |
| Plot type | Count rate plots | Images |
|---|---|---|
| Comparison with Poisson distribution Blue bars denote a histogram of data divided into 1 sec bins. Red curve is a Poisson curve with rate = median count rate of data. |
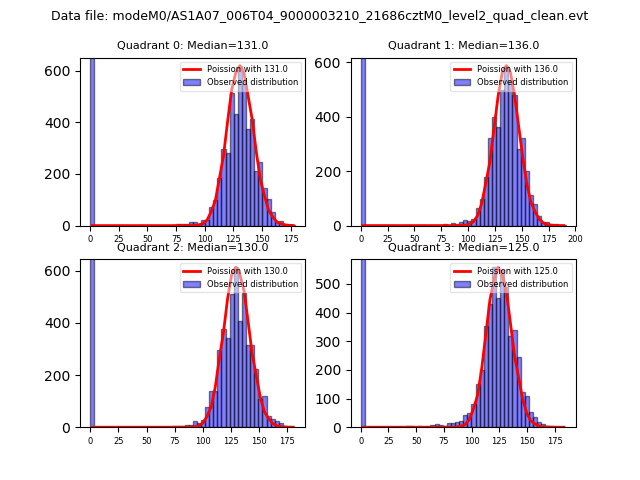 |
 |
| Quadrant-wise count rates Data is divided into 100 sec bins |
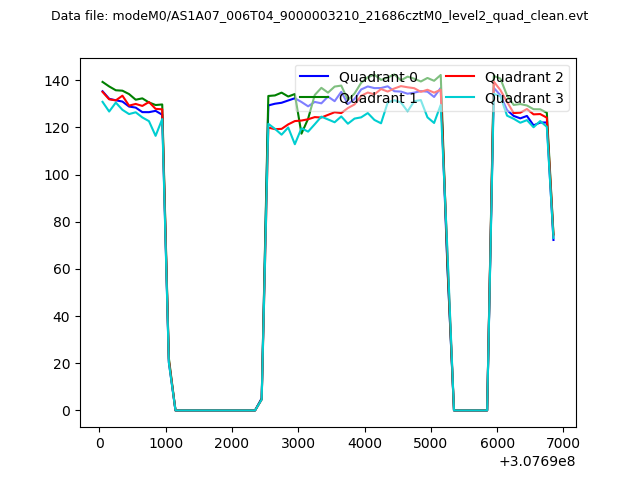 |
|
| Module-wise count rates for Quadrant A Data is divided into 100 sec bins |
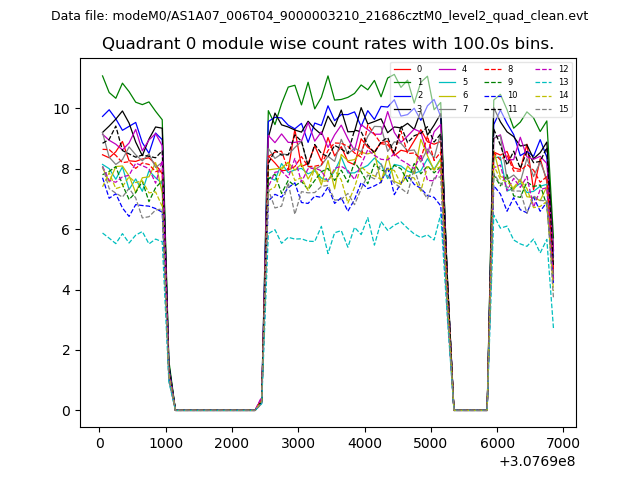 |
 |
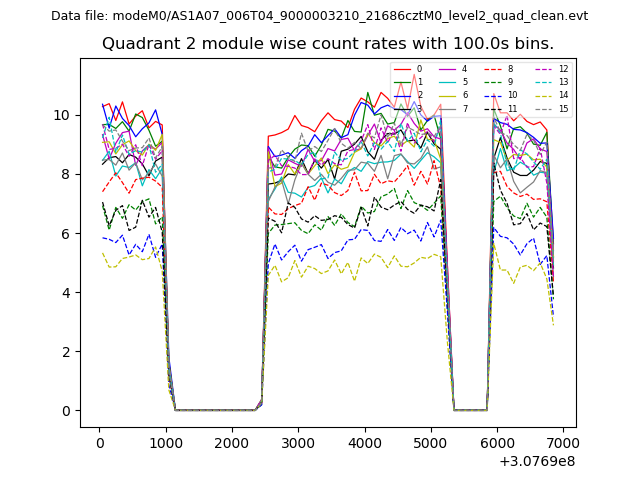
| Module-wise count rates for Quadrant B Data is divided into 100 sec bins |
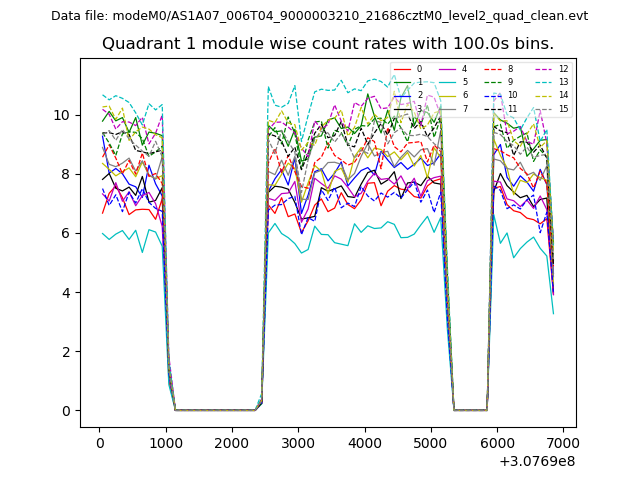 |
 |
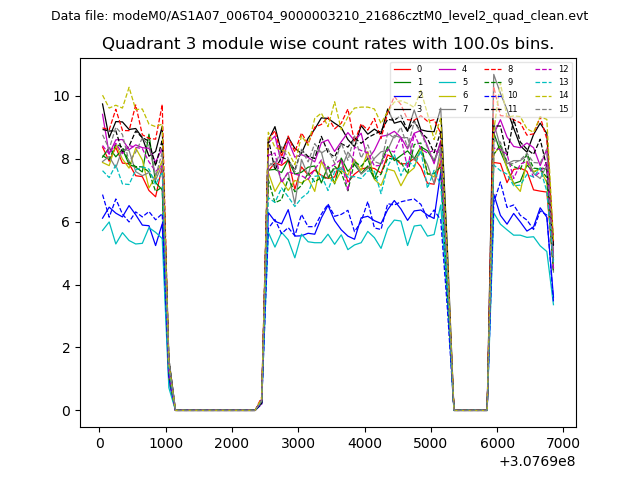
| Module-wise count rates for Quadrant C Data is divided into 100 sec bins |
 |
 |
| Module-wise count rates for Quadrant D Data is divided into 100 sec bins |
 |
 |
| Parameter | Plot |
|---|---|
| CZT HV Monitor | 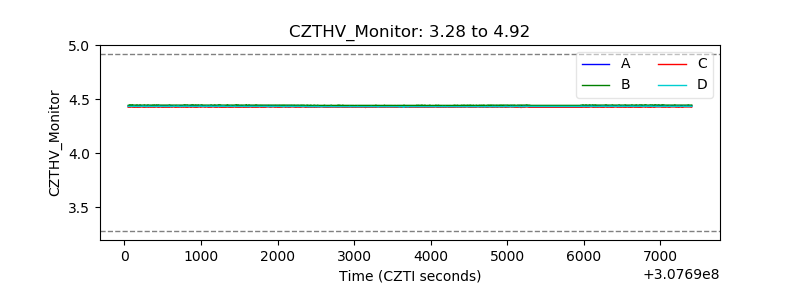 |
| D_VDD | 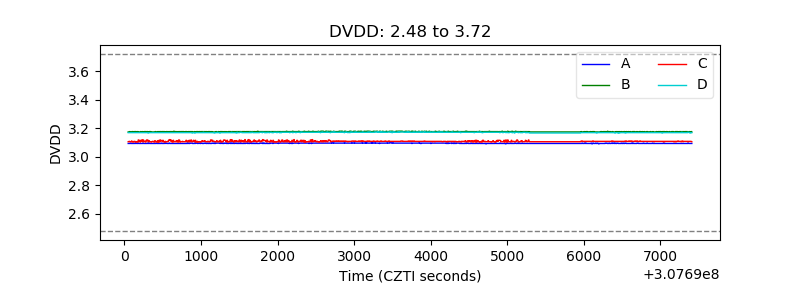 |
| Temperature 1 | 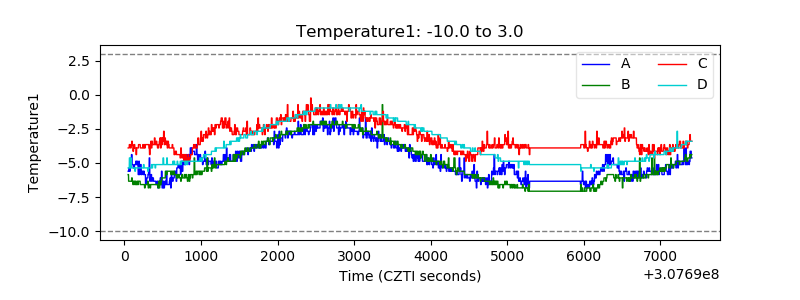 |
| Veto HV Monitor | 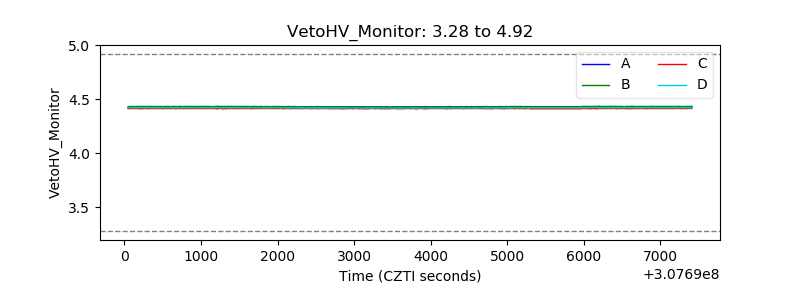 |
| Veto LLD | 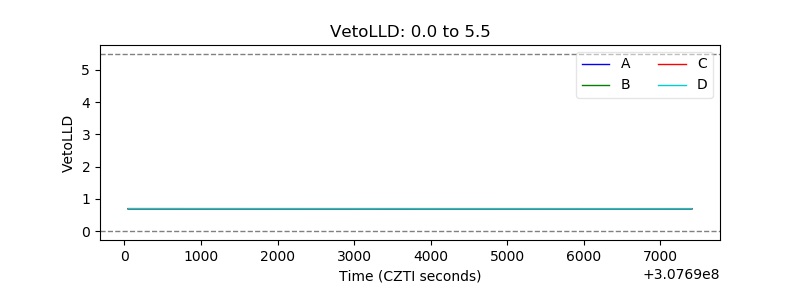 |
| Alpha Counter | 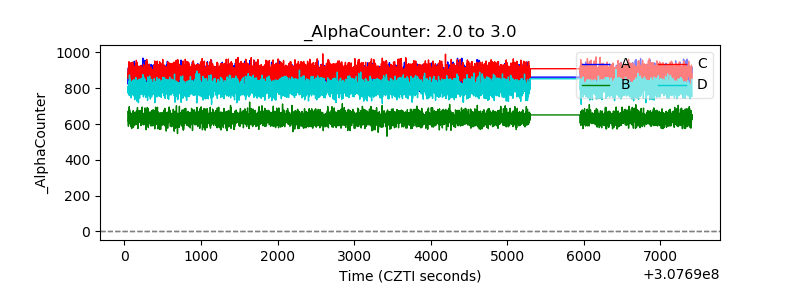 |
| _CPM_Rate |  |
| CZT Counter | 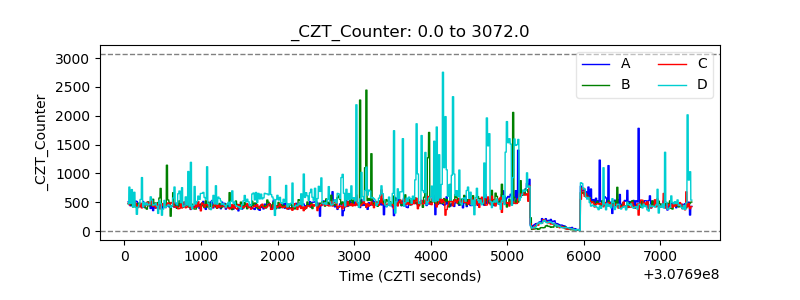 |
| +2.5 Volts monitor |  |
| +5 Volts monitor |  |
| _ROLL_ROT | 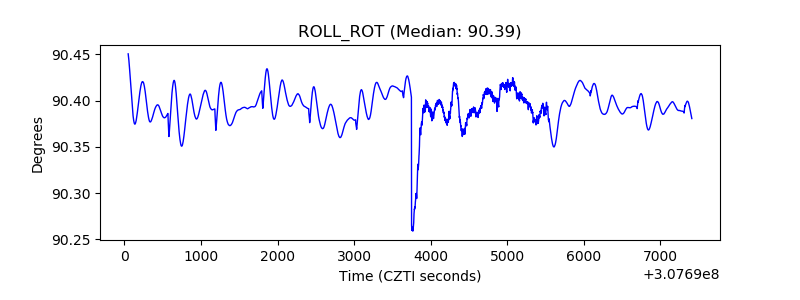 |
| _Roll_DEC | 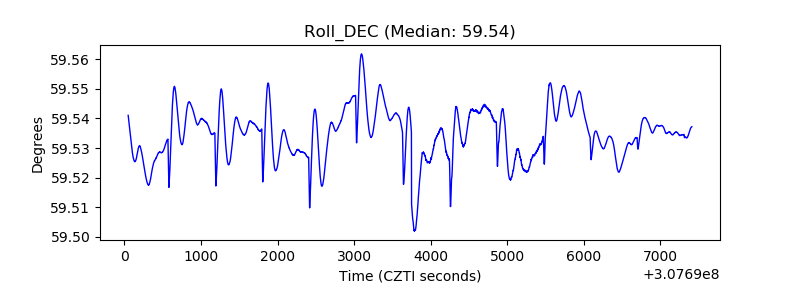 |
| _Roll_RA | 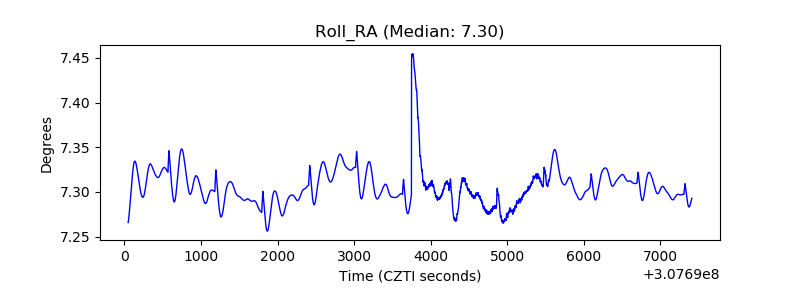 |
| Veto Counter | 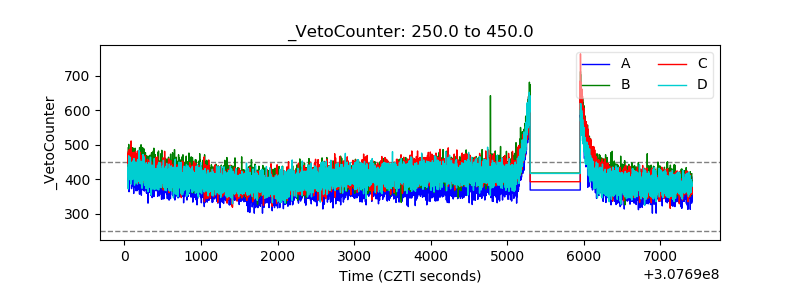 |