| Param | Original file | Final file |
|---|---|---|
| Filename | modeM0/AS1A07_006T04_9000003210_21687cztM0_level2.evt | modeM0/AS1A07_006T04_9000003210_21687cztM0_level2_quad_clean.evt |
| Size (bytes) | 891,743,040 | 154,782,720 |
| Size | 850.4 MB | 147.6 MB |
| Events in quadrant A | 6,082,768 | 991,040 |
| Events in quadrant B | 5,756,676 | 1,024,952 |
| Events in quadrant C | 6,142,388 | 978,291 |
| Events in quadrant D | 8,242,091 | 892,813 |
| Mode SS | |||
|---|---|---|---|
| Quadrant | BADHDUFLAG | Total packets | Discarded packets |
| A | 0 | 234 | 0 |
| B | 0 | 234 | 0 |
| C | 0 | 234 | 0 |
| D | 0 | 234 | 0 |
| Mode M0 | |||
|---|---|---|---|
| Quadrant | BADHDUFLAG | Total packets | Discarded packets |
| A | 0 | 25568 | 2 |
| B | 0 | 24498 | 8 |
| C | 0 | 25848 | 2 |
| D | 0 | 32252 | 2 |
| Mode M9 | |||
|---|---|---|---|
| Quadrant | BADHDUFLAG | Total packets | Discarded packets |
| A | 0 | 12 | 0 |
| B | 0 | 12 | 0 |
| C | 0 | 12 | 0 |
| D | 0 | 12 | 0 |
| Quadrant | Total seconds | Saturated seconds | Saturation percentage |
|---|---|---|---|
| A | 11567 | 329 | 2.844298% |
| B | 11566 | 369 | 3.190386% |
| C | 11566 | 481 | 4.158741% |
| D | 11566 | 1122 | 9.700847% |
Noise dominated data is calculated using 1-second bins in cleaned event files. If a bin has >2000 counts, and if more than 50% of those come from <1% of pixels, then it is considered to be noise-dominated and hence unusable.
| Quadrant | # 1 sec bins | Bins with >0 counts | Bins with >2000 counts | High rate bins dominated by noise | Noise dominated (total time) | Noise dominated (detector-on time) | Marked lightcurve |
|---|---|---|---|---|---|---|---|
| A | 16359 | 11570 | 12 | 12 | 0.07% | 0.10% |  |
| B | 16358 | 11569 | 19 | 19 | 0.12% | 0.16% |  |
| C | 16358 | 11569 | 90 | 90 | 0.55% | 0.78% |  |
| D | 16358 | 11568 | 719 | 719 | 4.40% | 6.22% |  |
Top three noisy pixels from each quadrant. If the there are fewer than three noisy pixels in the level2.evt file, extra rows are filled as -1
| Pixel properties | Quadrant properties | ||||||
|---|---|---|---|---|---|---|---|
| Quadrant | DetID | PixID | Counts | Sigma | Mean | Median | Sigma |
| A | 15 | 236 | 364856 | 1312.62 | 1389 | 1359 | 276.9 |
| A | 4 | 2 | 363271 | 1306.89 | 1389 | 1359 | 276.9 |
| A | 13 | 254 | 20069 | 67.56 | 1389 | 1359 | 276.9 |
| B | 3 | 64 | 160887 | 602.77 | 1397 | 1360 | 264.7 |
| B | 0 | 229 | 58805 | 217.06 | 1397 | 1360 | 264.7 |
| B | 0 | 190 | 33742 | 122.35 | 1397 | 1360 | 264.7 |
| C | 8 | 208 | 693817 | 2264.91 | 1332 | 1337 | 305.7 |
| C | 14 | 238 | 213307 | 693.29 | 1332 | 1337 | 305.7 |
| C | 10 | 23 | 17419 | 52.6 | 1332 | 1337 | 305.7 |
| D | 1 | 20 | 1423400 | 4583.16 | 1291 | 1247 | 310.3 |
| D | 7 | 238 | 741095 | 2384.3 | 1291 | 1247 | 310.3 |
| D | 1 | 52 | 426563 | 1370.66 | 1291 | 1247 | 310.3 |
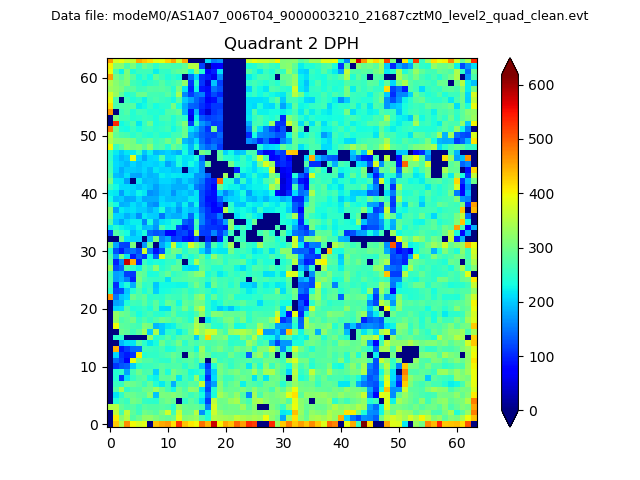
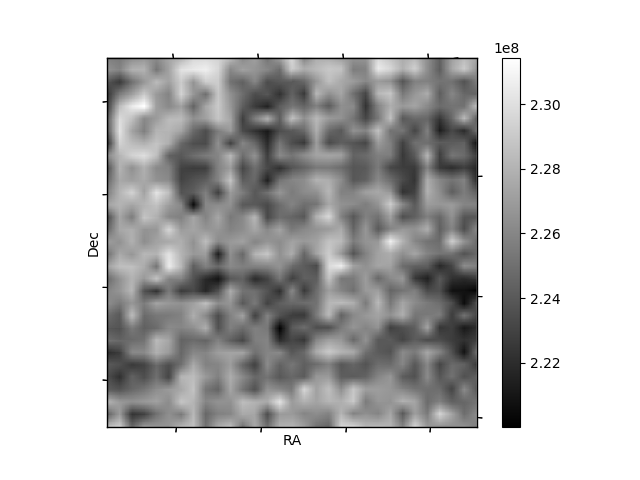
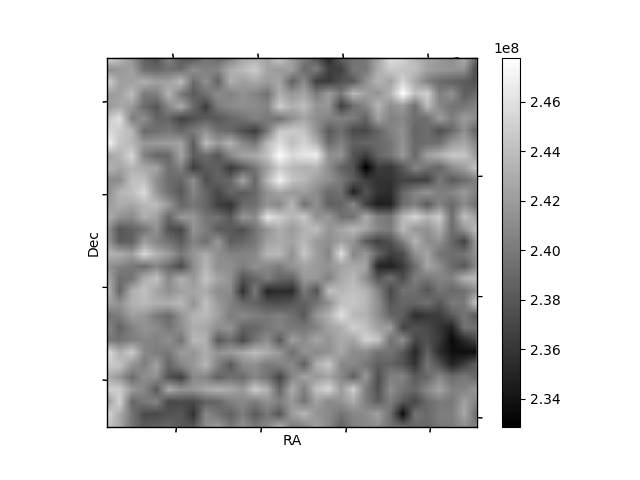
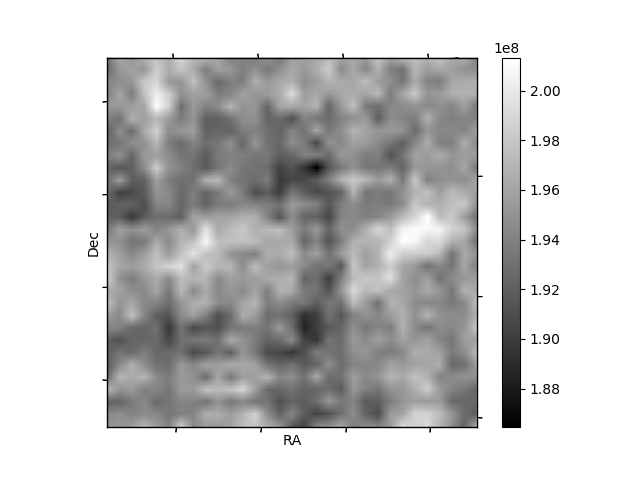
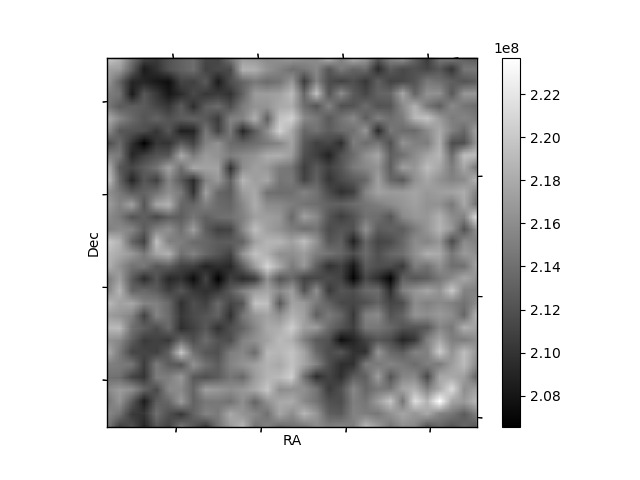
Histogram calculated using DETX and DETY for each event in the final _common_clean file
| Quadrant A | 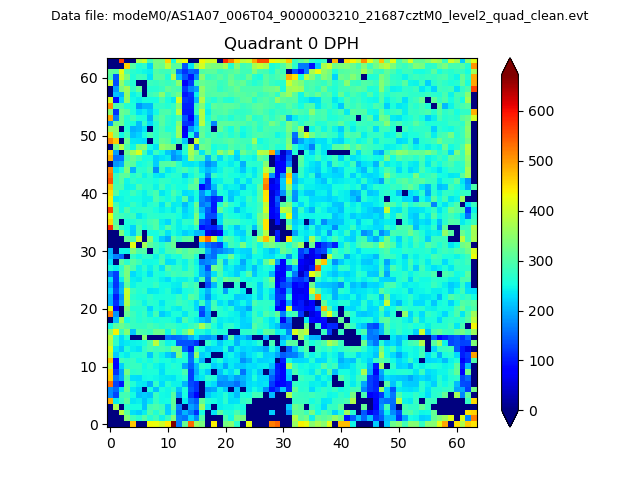 |
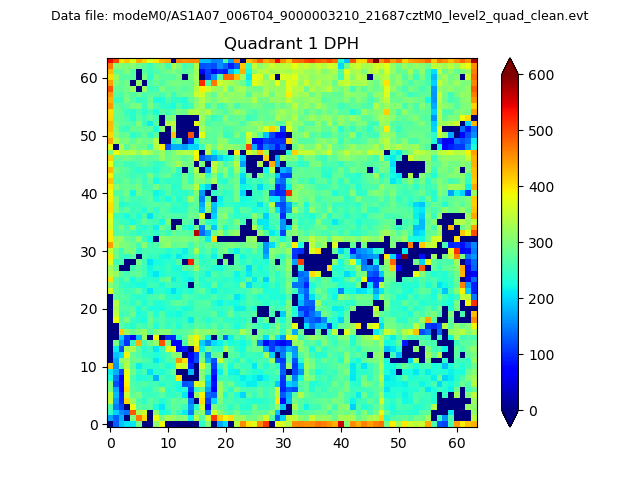 |
Quadrant B |
|---|---|---|---|
| Quadrant D | 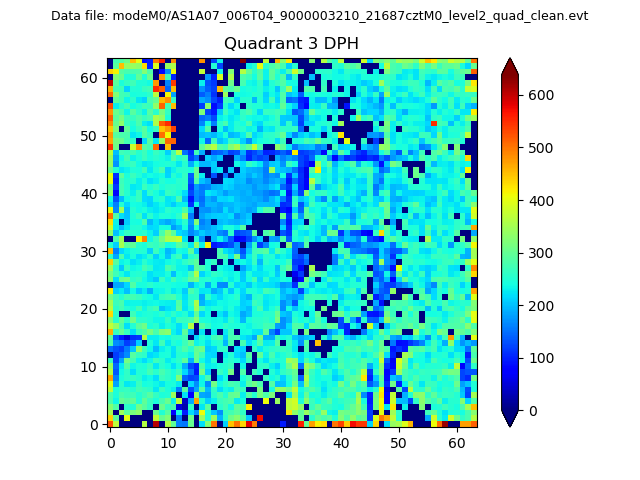 |
 |
Quadrant C |
| Plot type | Count rate plots | Images |
|---|---|---|
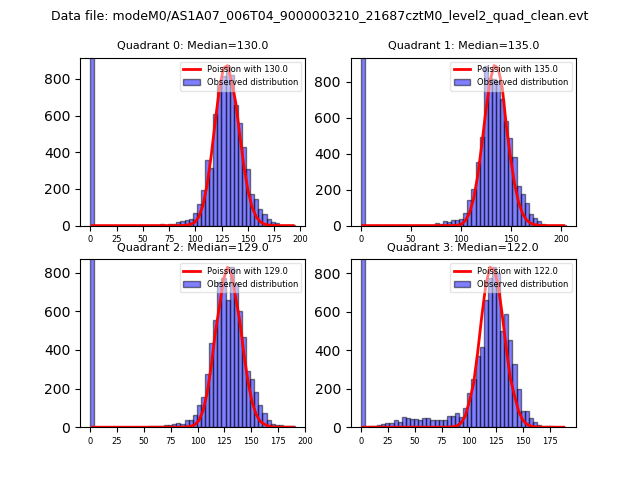
| Comparison with Poisson distribution Blue bars denote a histogram of data divided into 1 sec bins. Red curve is a Poisson curve with rate = median count rate of data. |
 |
 |
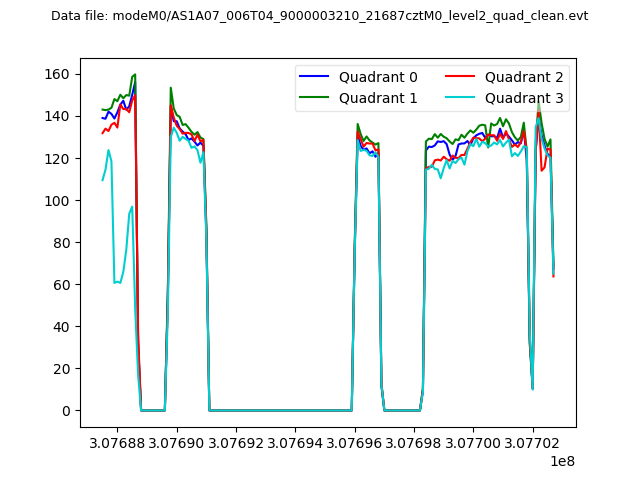
| Quadrant-wise count rates Data is divided into 100 sec bins |
 |
|
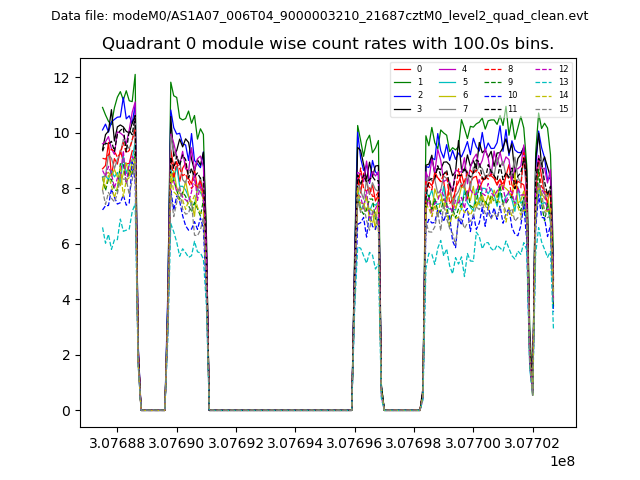
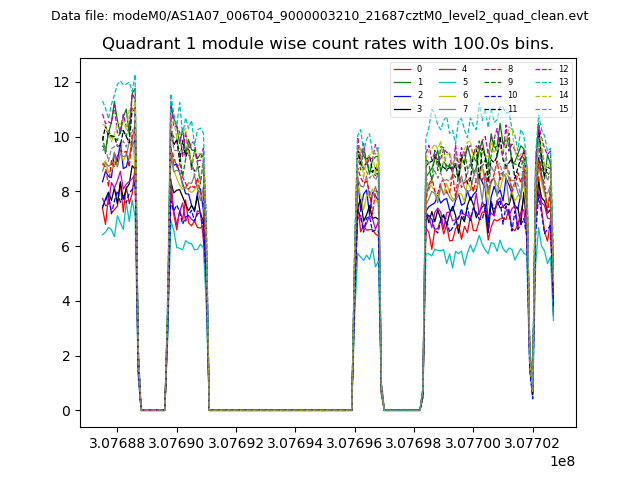
| Module-wise count rates for Quadrant A Data is divided into 100 sec bins |
 |
 |
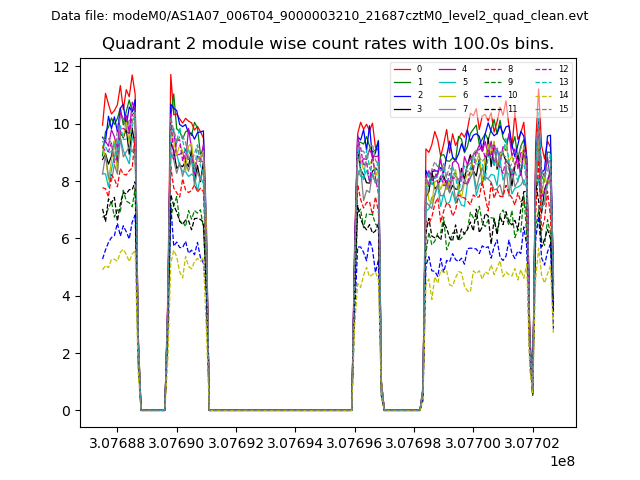
| Module-wise count rates for Quadrant B Data is divided into 100 sec bins |
 |
 |
| Module-wise count rates for Quadrant C Data is divided into 100 sec bins |
 |
 |
| Module-wise count rates for Quadrant D Data is divided into 100 sec bins |
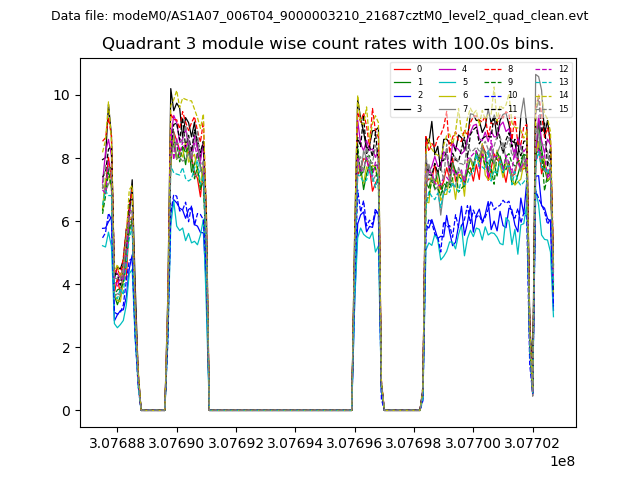 |
 |
| Parameter | Plot |
|---|---|
| CZT HV Monitor | 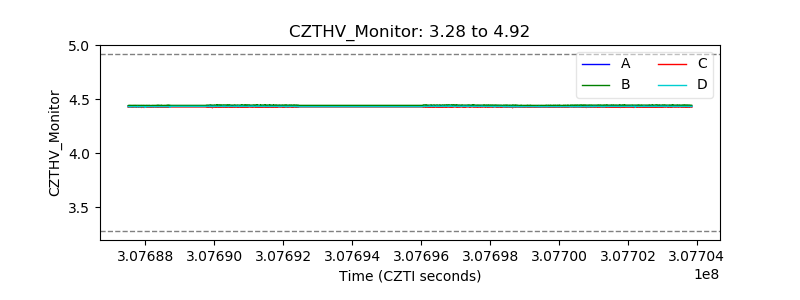 |
| D_VDD | 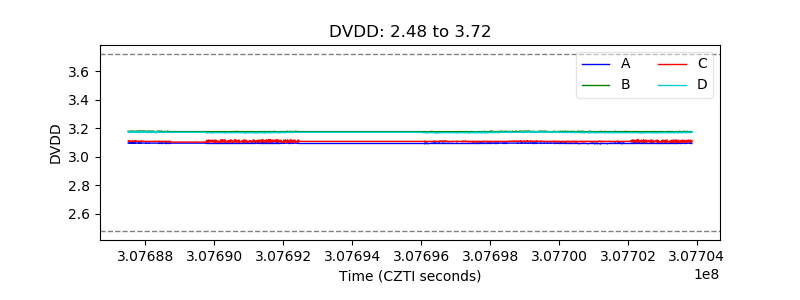 |
| Temperature 1 | 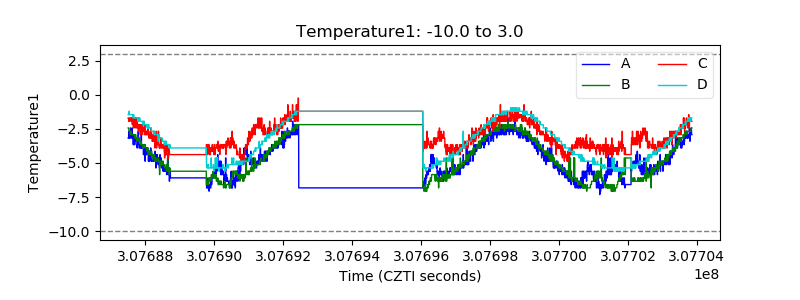 |
| Veto HV Monitor | 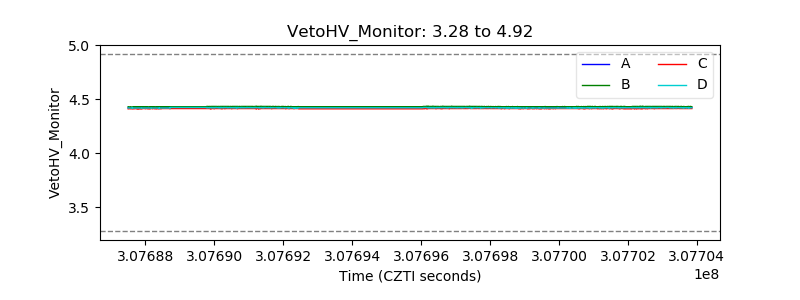 |
| Veto LLD | 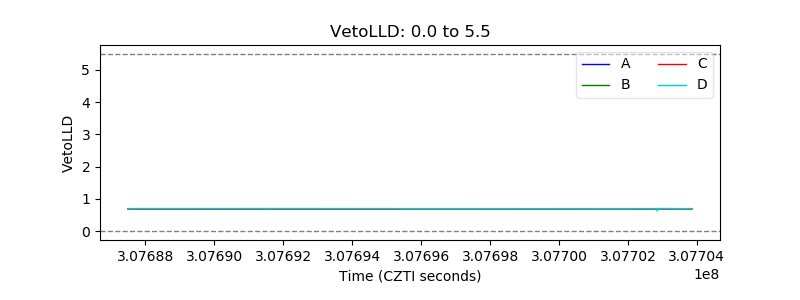 |
| Alpha Counter | 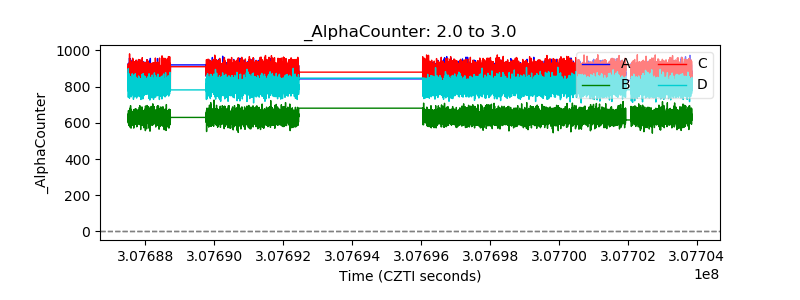 |
| _CPM_Rate | 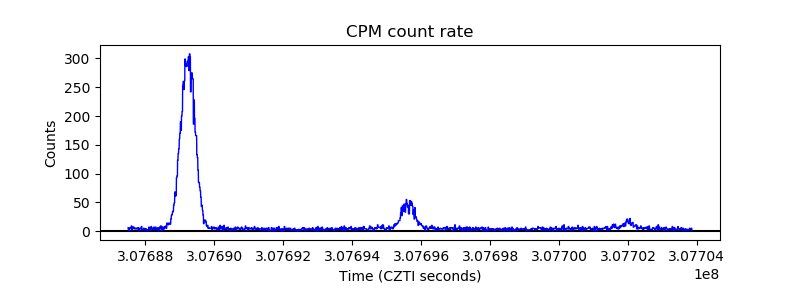 |
| CZT Counter | 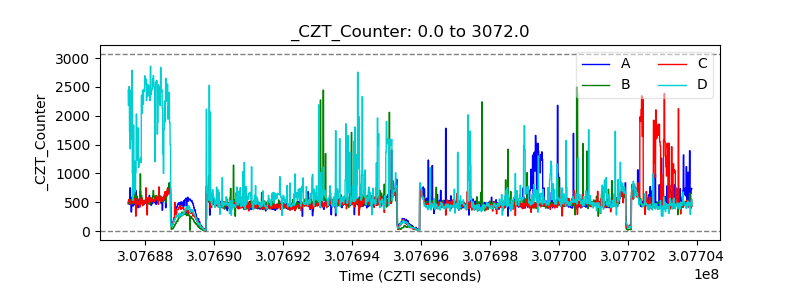 |
| +2.5 Volts monitor |  |
| +5 Volts monitor | 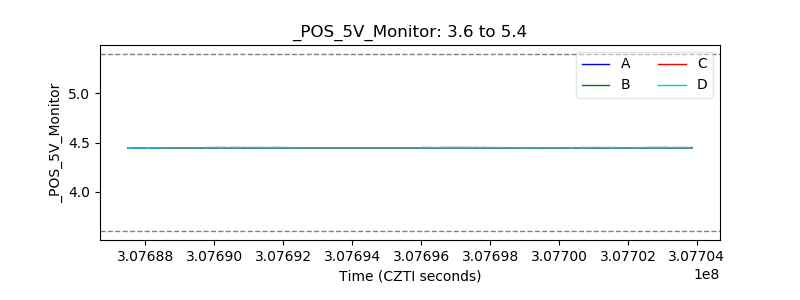 |
| _ROLL_ROT | 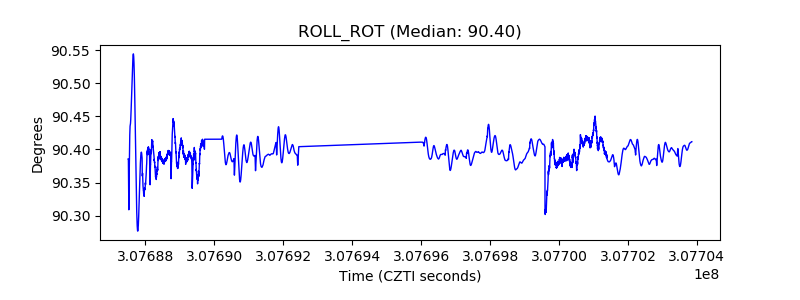 |
| _Roll_DEC | 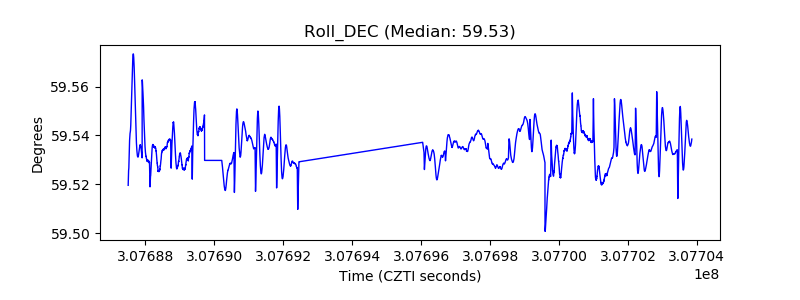 |
| _Roll_RA | 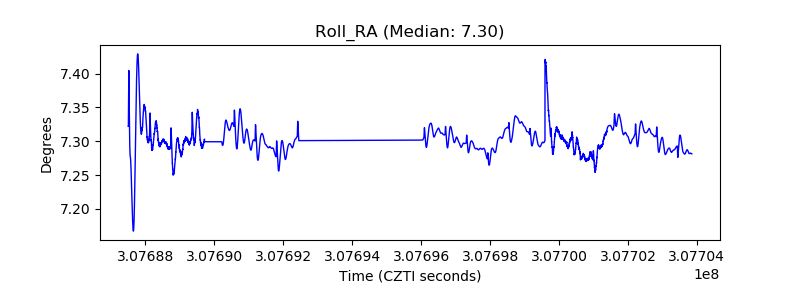 |
| Veto Counter | 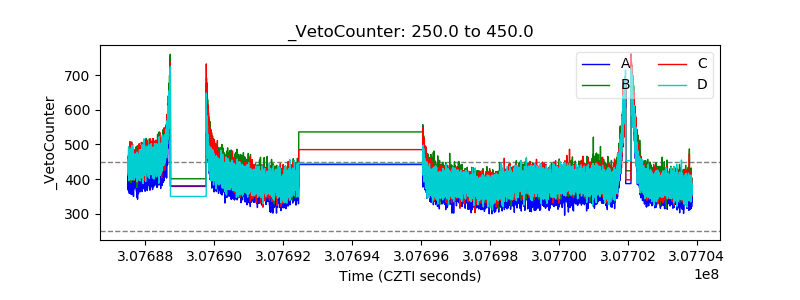 |