| Param | Original file | Final file |
|---|---|---|
| Filename | modeM0/AS1A07_006T04_9000003210_21688cztM0_level2.evt | modeM0/AS1A07_006T04_9000003210_21688cztM0_level2_quad_clean.evt |
| Size (bytes) | 554,544,000 | 98,729,280 |
| Size | 528.9 MB | 94.2 MB |
| Events in quadrant A | 3,962,999 | 613,061 |
| Events in quadrant B | 3,817,817 | 635,048 |
| Events in quadrant C | 4,427,714 | 601,097 |
| Events in quadrant D | 4,051,957 | 593,661 |
| Mode SS | |||
|---|---|---|---|
| Quadrant | BADHDUFLAG | Total packets | Discarded packets |
| A | 0 | 160 | 0 |
| B | 0 | 160 | 0 |
| C | 0 | 160 | 0 |
| D | 0 | 160 | 0 |
| Mode M0 | |||
|---|---|---|---|
| Quadrant | BADHDUFLAG | Total packets | Discarded packets |
| A | 0 | 17082 | 2 |
| B | 0 | 16398 | 2 |
| C | 0 | 18364 | 2 |
| D | 0 | 17303 | 2 |
| Mode M9 | |||
|---|---|---|---|
| Quadrant | BADHDUFLAG | Total packets | Discarded packets |
| A | 0 | 3 | 0 |
| B | 0 | 4 | 0 |
| C | 0 | 4 | 0 |
| D | 0 | 4 | 0 |
| Quadrant | Total seconds | Saturated seconds | Saturation percentage |
|---|---|---|---|
| A | 7863 | 332 | 4.222307% |
| B | 7863 | 353 | 4.489381% |
| C | 7863 | 481 | 6.117258% |
| D | 7863 | 270 | 3.433804% |
Noise dominated data is calculated using 1-second bins in cleaned event files. If a bin has >2000 counts, and if more than 50% of those come from <1% of pixels, then it is considered to be noise-dominated and hence unusable.
| Quadrant | # 1 sec bins | Bins with >0 counts | Bins with >2000 counts | High rate bins dominated by noise | Noise dominated (total time) | Noise dominated (detector-on time) | Marked lightcurve |
|---|---|---|---|---|---|---|---|
| A | 8018 | 7864 | 15 | 15 | 0.19% | 0.19% |  |
| B | 8018 | 7864 | 7 | 7 | 0.09% | 0.09% | 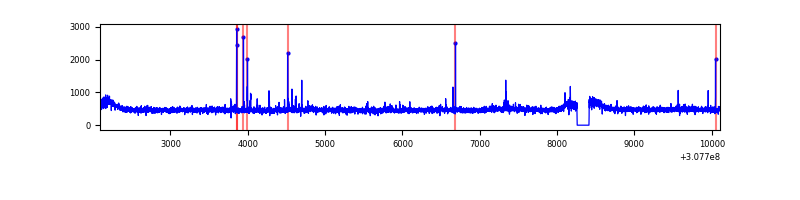 |
| C | 8018 | 7864 | 91 | 91 | 1.13% | 1.16% | 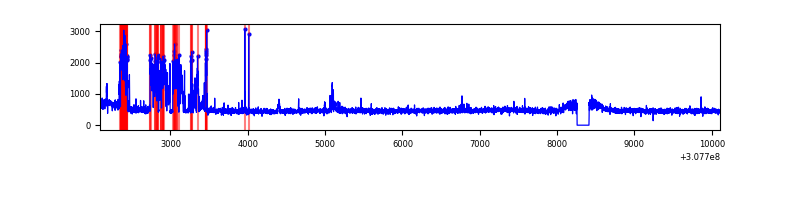 |
| D | 8018 | 7864 | 18 | 18 | 0.22% | 0.23% | 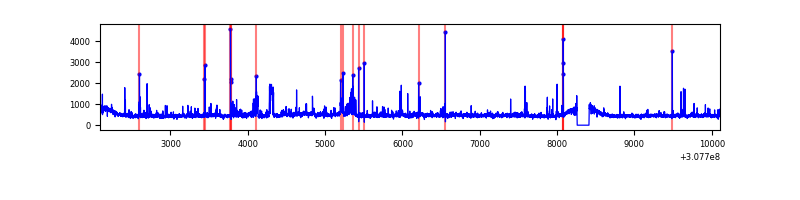 |
Top three noisy pixels from each quadrant. If the there are fewer than three noisy pixels in the level2.evt file, extra rows are filled as -1
| Pixel properties | Quadrant properties | ||||||
|---|---|---|---|---|---|---|---|
| Quadrant | DetID | PixID | Counts | Sigma | Mean | Median | Sigma |
| A | 4 | 2 | 313953 | 1655.02 | 945 | 922 | 189.1 |
| A | 13 | 254 | 12989 | 63.8 | 945 | 922 | 189.1 |
| A | 3 | 137 | 8365 | 39.35 | 945 | 922 | 189.1 |
| B | 3 | 64 | 57201 | 311.3 | 948 | 923 | 180.8 |
| B | 12 | 111 | 22578 | 119.78 | 948 | 923 | 180.8 |
| B | 11 | 111 | 19703 | 103.88 | 948 | 923 | 180.8 |
| C | 8 | 208 | 727690 | 3469.75 | 901 | 905 | 209.5 |
| C | 14 | 238 | 143698 | 681.71 | 901 | 905 | 209.5 |
| C | 10 | 23 | 18127 | 82.22 | 901 | 905 | 209.5 |
| D | 1 | 52 | 282253 | 1270.14 | 918 | 888 | 221.5 |
| D | 2 | 136 | 72133 | 321.61 | 918 | 888 | 221.5 |
| D | 1 | 20 | 68084 | 303.34 | 918 | 888 | 221.5 |
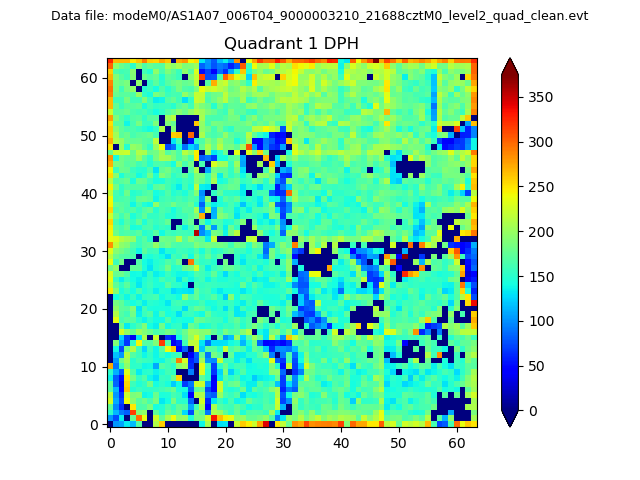
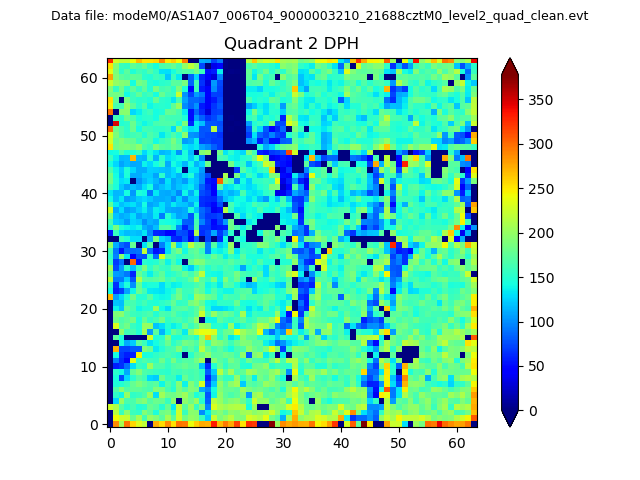
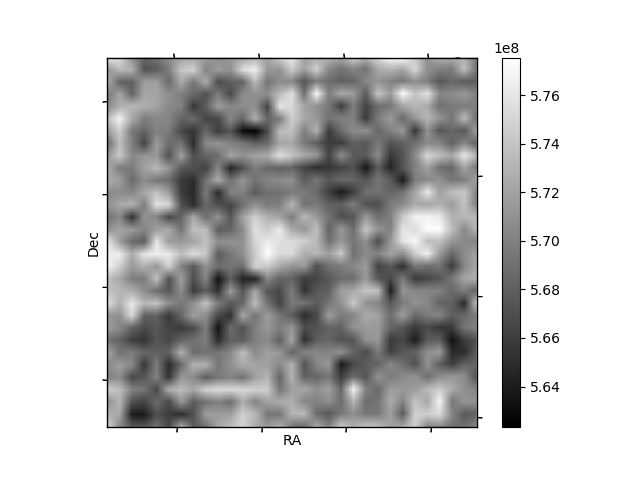
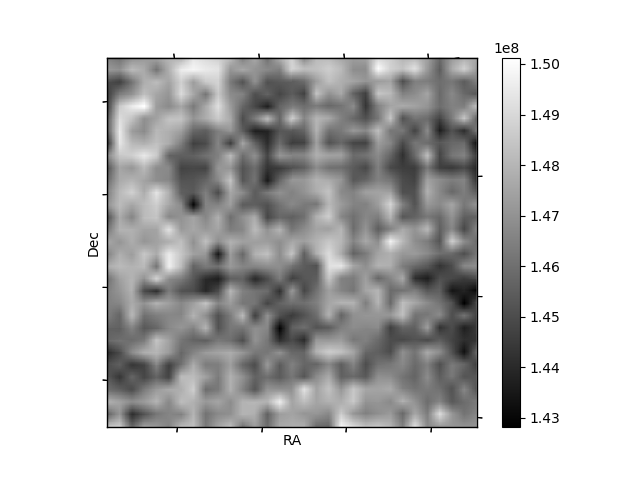
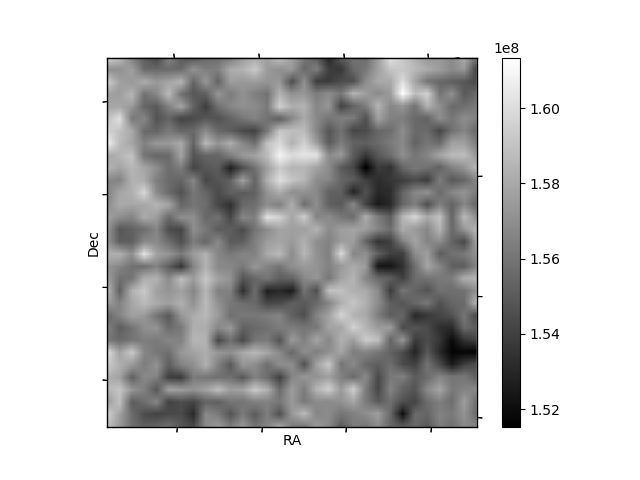
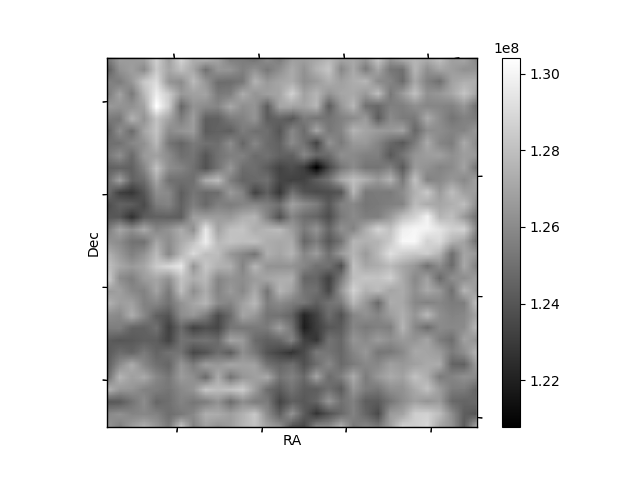
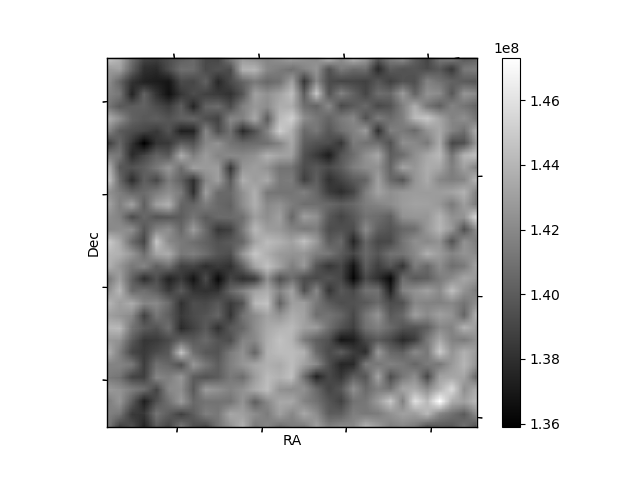
Histogram calculated using DETX and DETY for each event in the final _common_clean file
| Quadrant A | 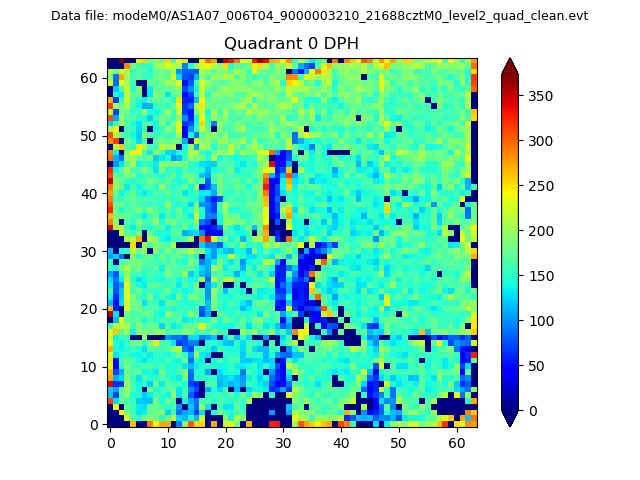 |
 |
Quadrant B |
|---|---|---|---|
| Quadrant D | 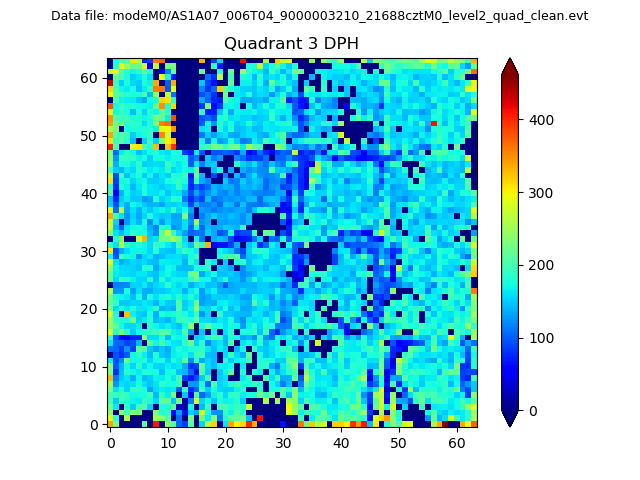 |
 |
Quadrant C |
| Plot type | Count rate plots | Images |
|---|---|---|
| Comparison with Poisson distribution Blue bars denote a histogram of data divided into 1 sec bins. Red curve is a Poisson curve with rate = median count rate of data. |
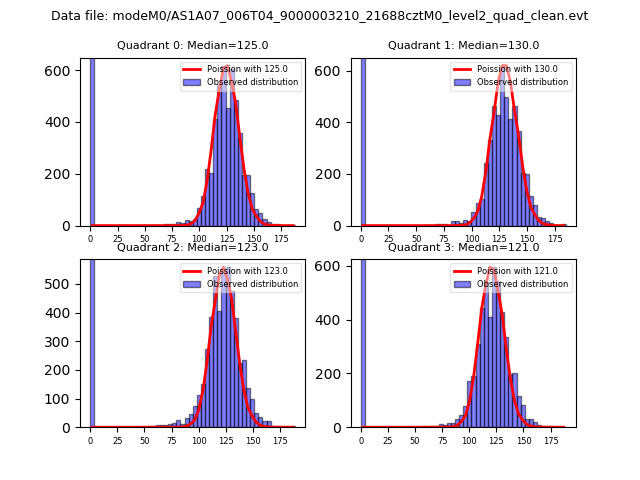 |
 |
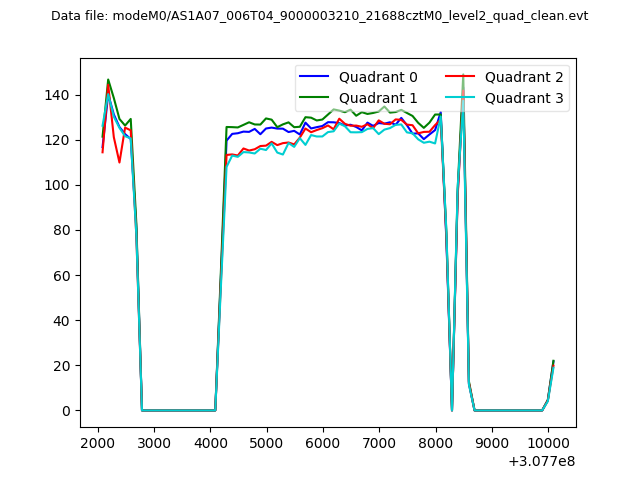
| Quadrant-wise count rates Data is divided into 100 sec bins |
 |
|
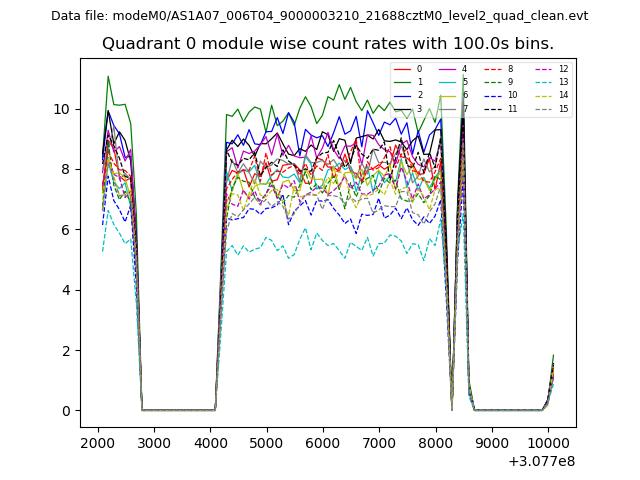
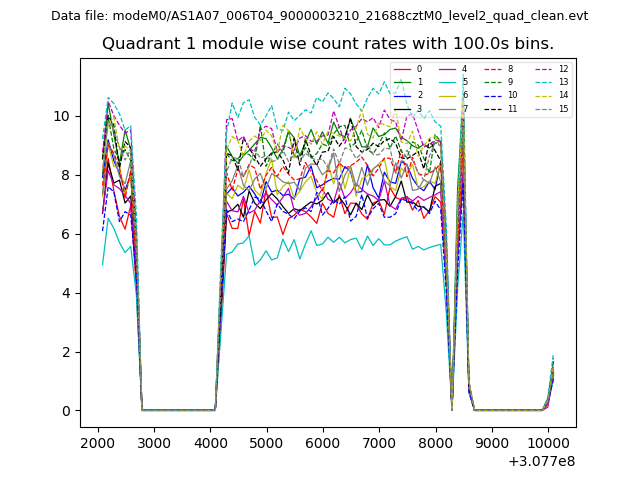
| Module-wise count rates for Quadrant A Data is divided into 100 sec bins |
 |
 |
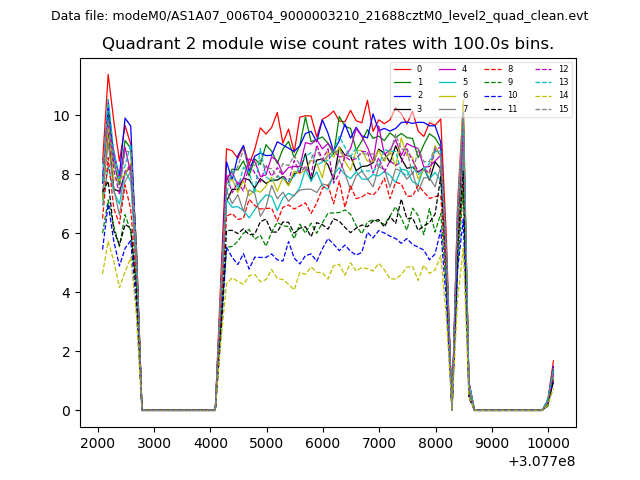
| Module-wise count rates for Quadrant B Data is divided into 100 sec bins |
 |
 |
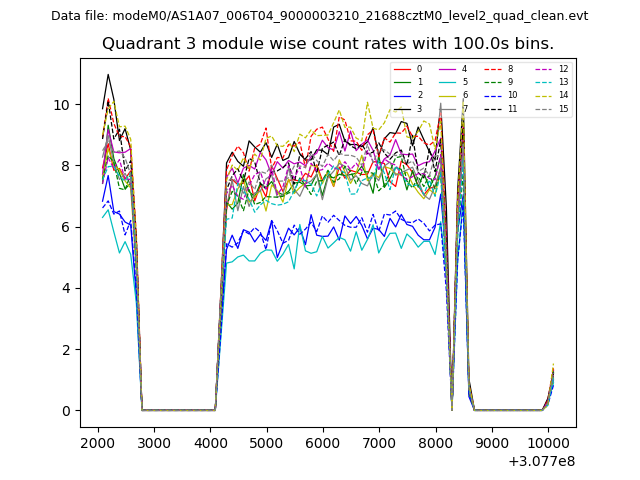
| Module-wise count rates for Quadrant C Data is divided into 100 sec bins |
 |
 |
| Module-wise count rates for Quadrant D Data is divided into 100 sec bins |
 |
 |
| Parameter | Plot |
|---|---|
| CZT HV Monitor | 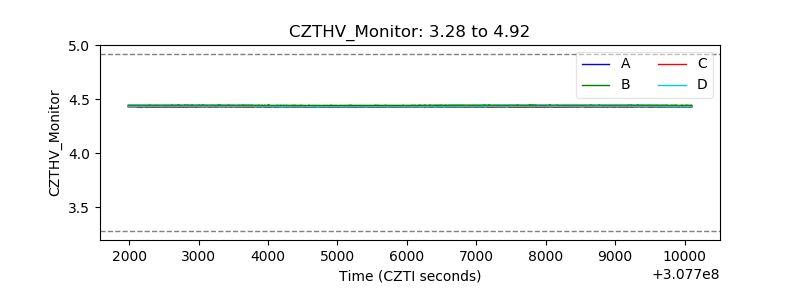 |
| D_VDD | 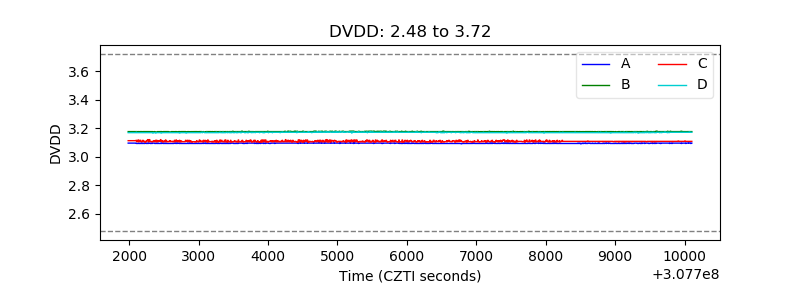 |
| Temperature 1 | 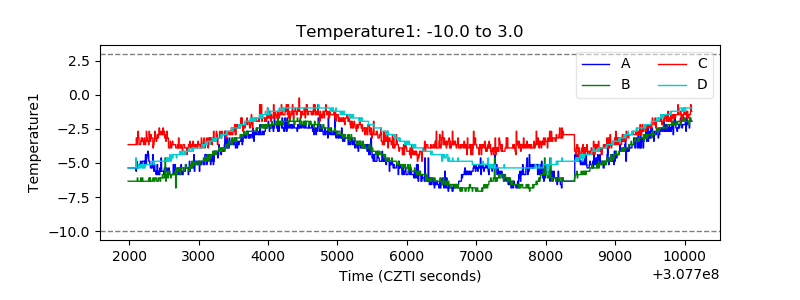 |
| Veto HV Monitor | 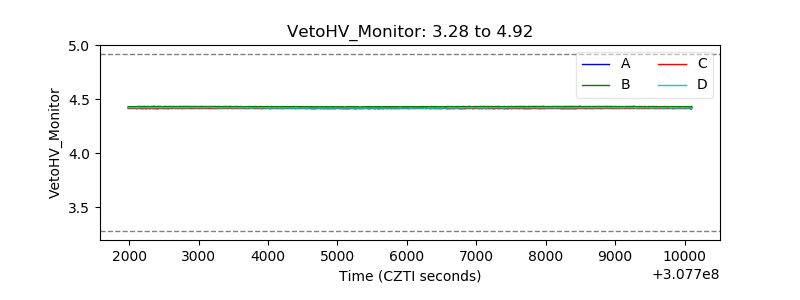 |
| Veto LLD | 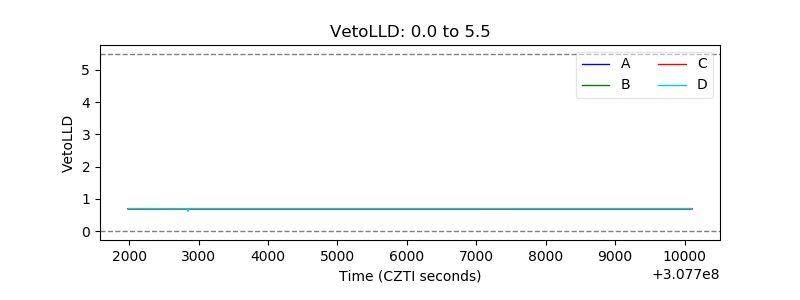 |
| Alpha Counter | 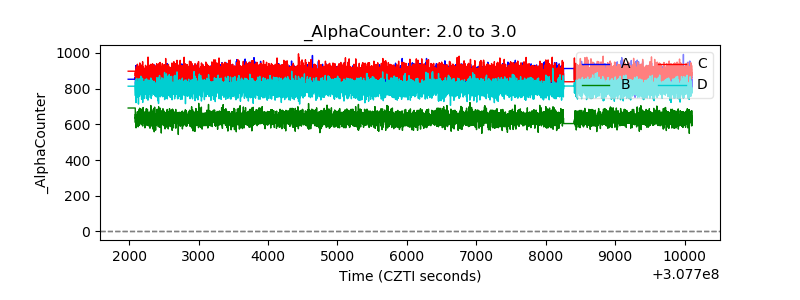 |
| _CPM_Rate | 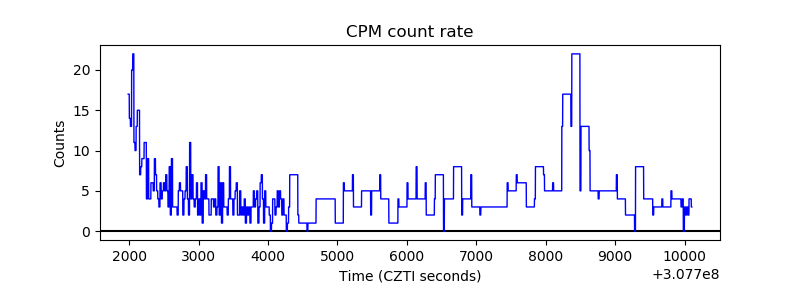 |
| CZT Counter | 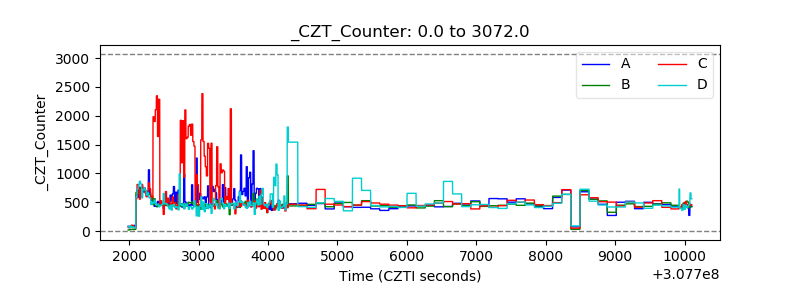 |
| +2.5 Volts monitor |  |
| +5 Volts monitor |  |
| _ROLL_ROT | 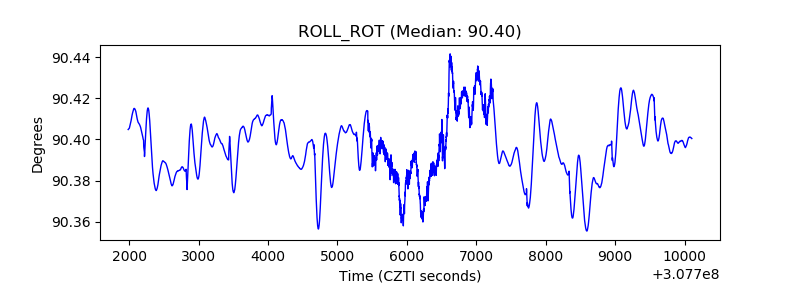 |
| _Roll_DEC | 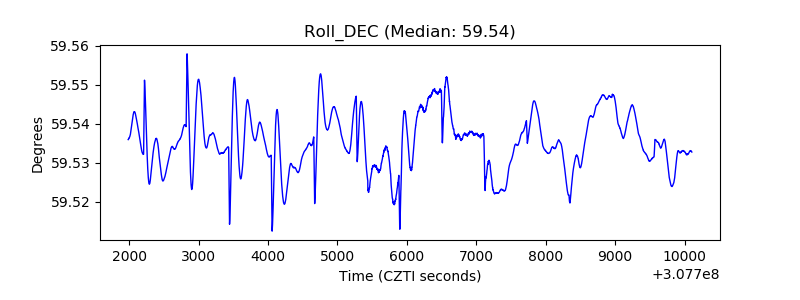 |
| _Roll_RA | 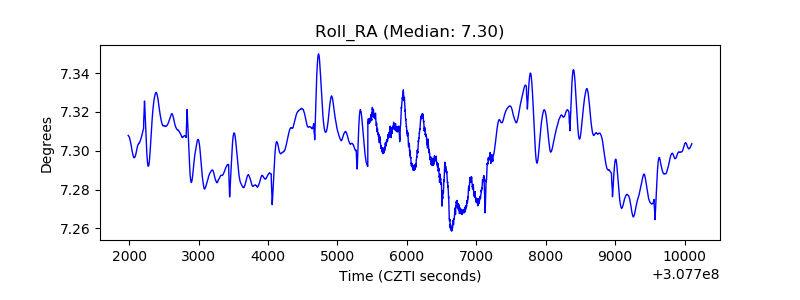 |
| Veto Counter | 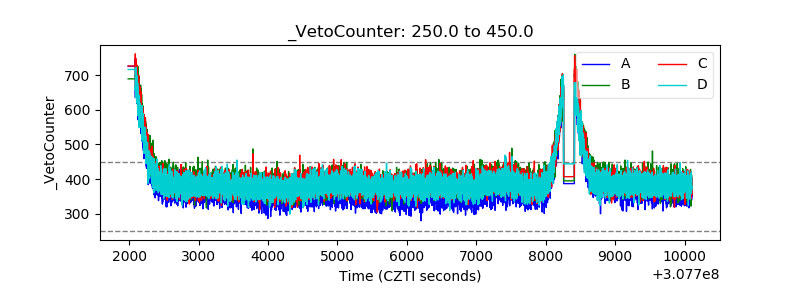 |