| Param | Original file | Final file |
|---|---|---|
| Filename | modeM0/AS1A07_006T04_9000003210_21691cztM0_level2.evt | modeM0/AS1A07_006T04_9000003210_21691cztM0_level2_quad_clean.evt |
| Size (bytes) | 1,409,215,680 | 281,574,720 |
| Size | 1.3 GB | 268.5 MB |
| Events in quadrant A | 8,801,009 | 1,829,693 |
| Events in quadrant B | 9,442,602 | 1,880,508 |
| Events in quadrant C | 9,716,634 | 1,791,748 |
| Events in quadrant D | 13,433,584 | 1,716,738 |
| Mode SS | |||
|---|---|---|---|
| Quadrant | BADHDUFLAG | Total packets | Discarded packets |
| A | 0 | 386 | 0 |
| B | 0 | 386 | 0 |
| C | 0 | 386 | 0 |
| D | 0 | 386 | 0 |
| Mode M0 | |||
|---|---|---|---|
| Quadrant | BADHDUFLAG | Total packets | Discarded packets |
| A | 0 | 38895 | 4 |
| B | 0 | 40150 | 5 |
| C | 0 | 41269 | 4 |
| D | 0 | 52796 | 4 |
| Mode M9 | |||
|---|---|---|---|
| Quadrant | BADHDUFLAG | Total packets | Discarded packets |
| A | 0 | 20 | 0 |
| B | 0 | 20 | 0 |
| C | 0 | 20 | 0 |
| D | 0 | 20 | 0 |
| Quadrant | Total seconds | Saturated seconds | Saturation percentage |
|---|---|---|---|
| A | 19013 | 359 | 1.888182% |
| B | 19013 | 430 | 2.261610% |
| C | 19013 | 542 | 2.850681% |
| D | 19013 | 1090 | 5.732920% |
Noise dominated data is calculated using 1-second bins in cleaned event files. If a bin has >2000 counts, and if more than 50% of those come from <1% of pixels, then it is considered to be noise-dominated and hence unusable.
| Quadrant | # 1 sec bins | Bins with >0 counts | Bins with >2000 counts | High rate bins dominated by noise | Noise dominated (total time) | Noise dominated (detector-on time) | Marked lightcurve |
|---|---|---|---|---|---|---|---|
| A | 20938 | 19017 | 0 | 0 | 0.00% | 0.00% | 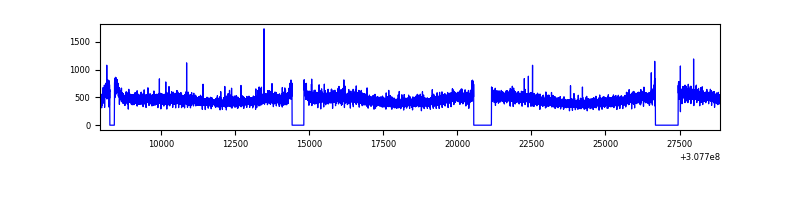 |
| B | 20938 | 19017 | 26 | 26 | 0.12% | 0.14% | 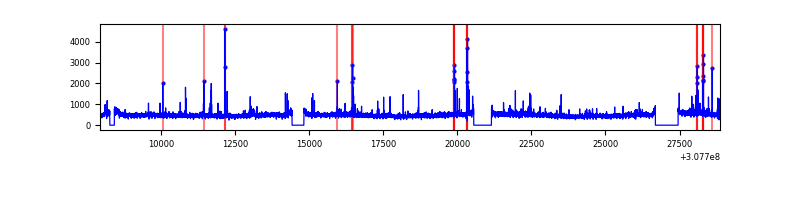 |
| C | 20938 | 19017 | 99 | 99 | 0.47% | 0.52% | 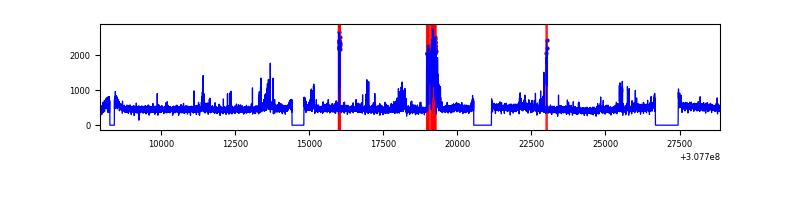 |
| D | 20938 | 19017 | 623 | 623 | 2.98% | 3.28% | 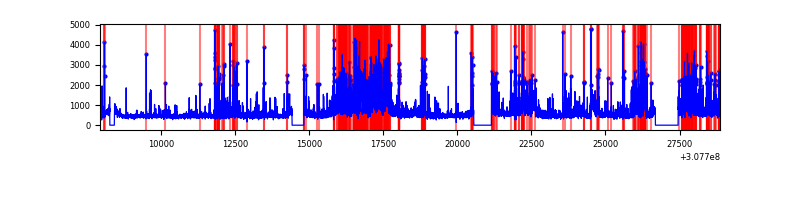 |
Top three noisy pixels from each quadrant. If the there are fewer than three noisy pixels in the level2.evt file, extra rows are filled as -1
| Pixel properties | Quadrant properties | ||||||
|---|---|---|---|---|---|---|---|
| Quadrant | DetID | PixID | Counts | Sigma | Mean | Median | Sigma |
| A | 15 | 236 | 51541 | 108.83 | 2258 | 2205 | 453.3 |
| A | 13 | 254 | 33940 | 70.01 | 2258 | 2205 | 453.3 |
| A | 6 | 16 | 24306 | 48.75 | 2258 | 2205 | 453.3 |
| B | 3 | 64 | 203563 | 474.34 | 2263 | 2205 | 424.5 |
| B | 0 | 229 | 132933 | 307.96 | 2263 | 2205 | 424.5 |
| B | 0 | 189 | 70379 | 160.6 | 2263 | 2205 | 424.5 |
| C | 8 | 208 | 891607 | 1758.75 | 2170 | 2179 | 505.7 |
| C | 14 | 238 | 342589 | 673.12 | 2170 | 2179 | 505.7 |
| C | 10 | 22 | 20189 | 35.61 | 2170 | 2179 | 505.7 |
| D | 1 | 52 | 2090548 | 3983.53 | 2171 | 2107 | 524.3 |
| D | 7 | 238 | 1569411 | 2989.5 | 2171 | 2107 | 524.3 |
| D | 12 | 235 | 692201 | 1316.3 | 2171 | 2107 | 524.3 |
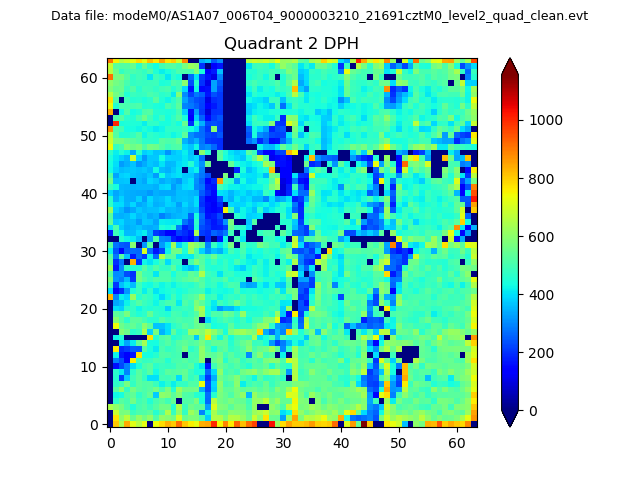
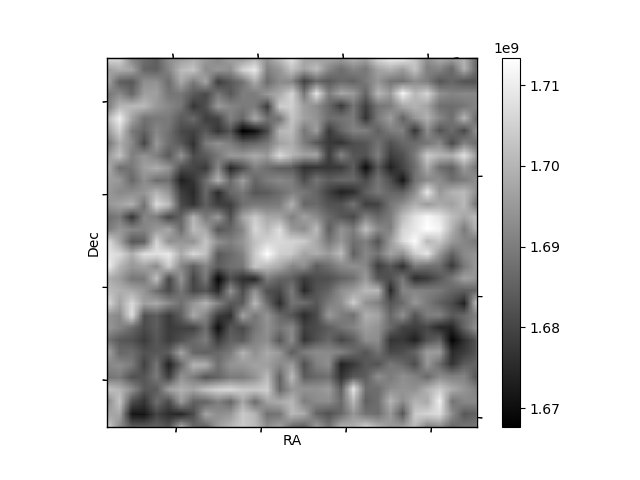
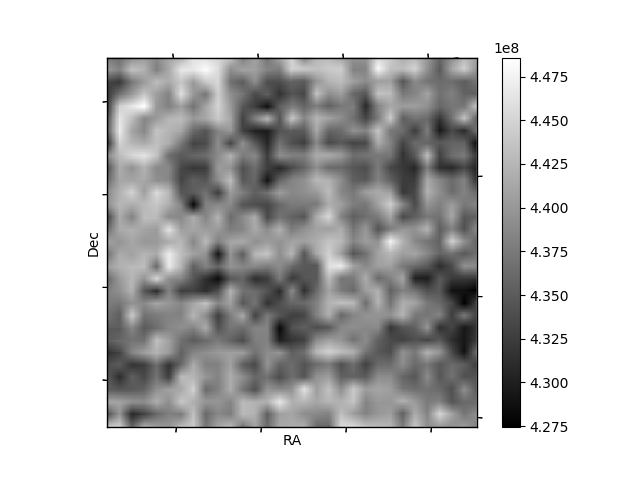
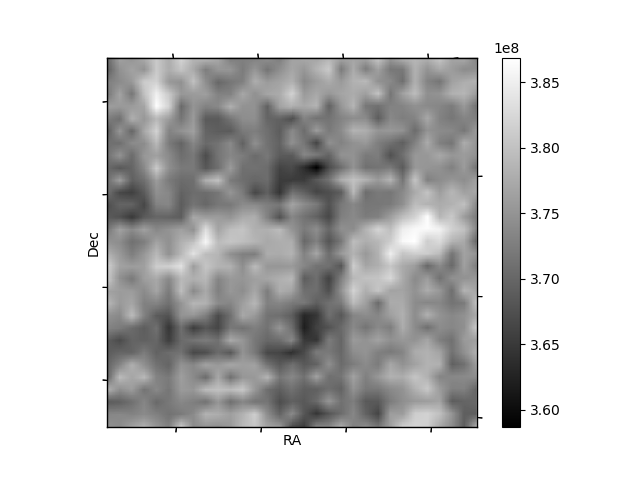
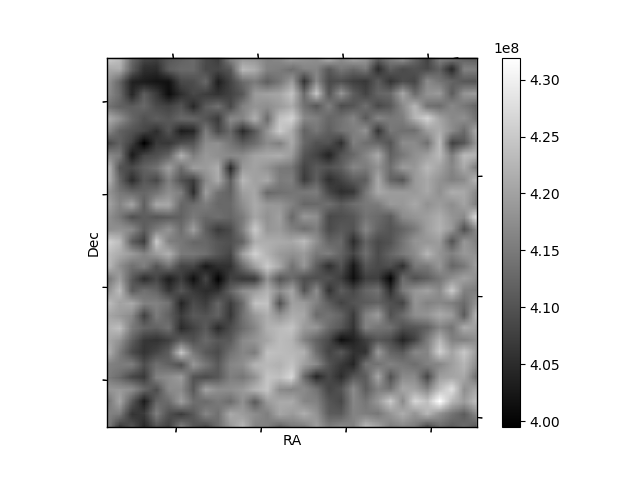
Histogram calculated using DETX and DETY for each event in the final _common_clean file
| Quadrant A | 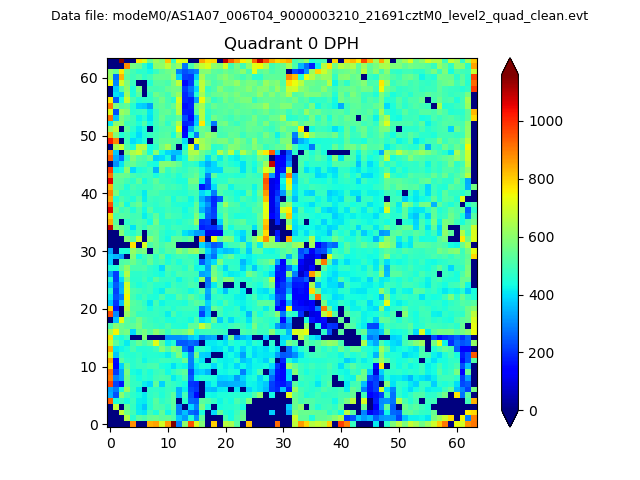 |
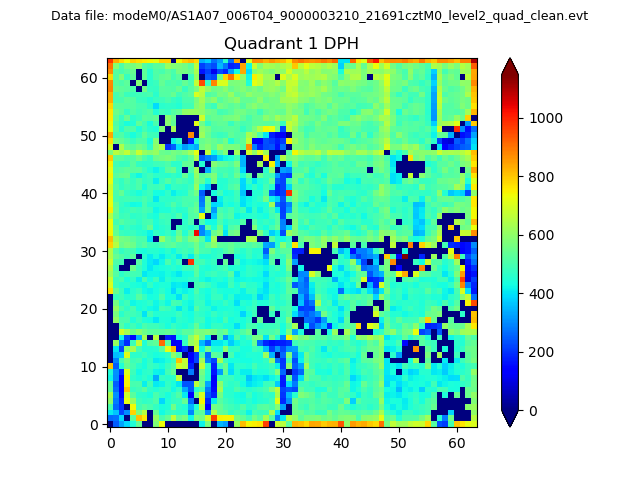 |
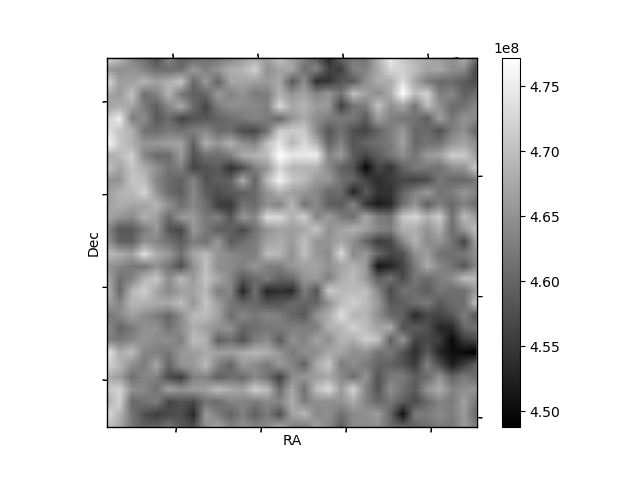
Quadrant B |
|---|---|---|---|
| Quadrant D | 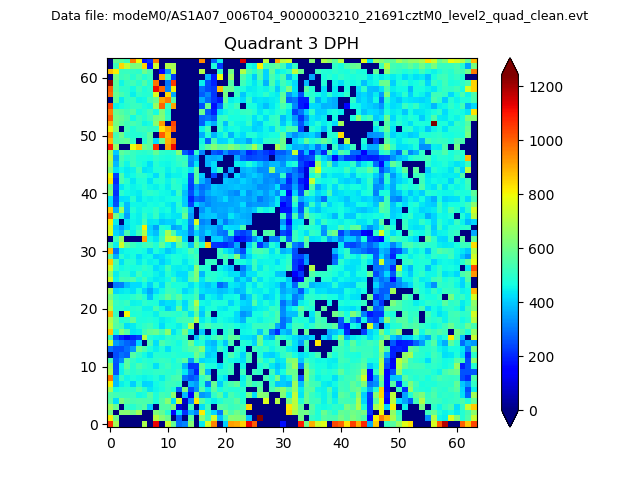 |
 |
Quadrant C |
| Plot type | Count rate plots | Images |
|---|---|---|
| Comparison with Poisson distribution Blue bars denote a histogram of data divided into 1 sec bins. Red curve is a Poisson curve with rate = median count rate of data. |
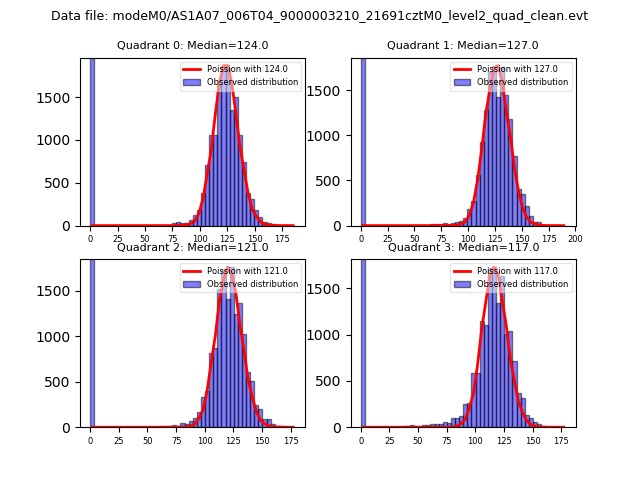 |
 |
| Quadrant-wise count rates Data is divided into 100 sec bins |
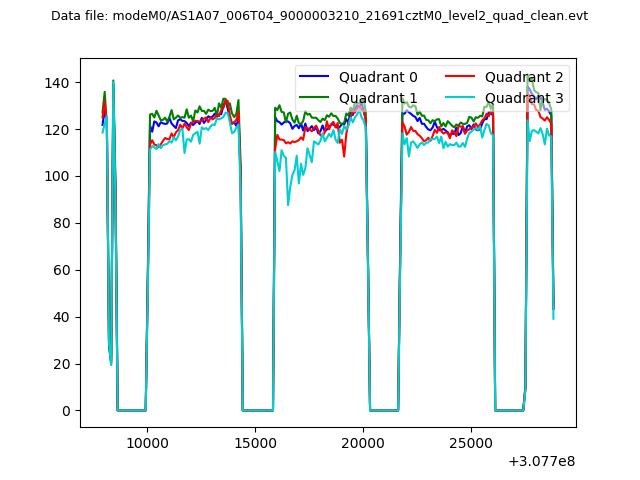 |
|
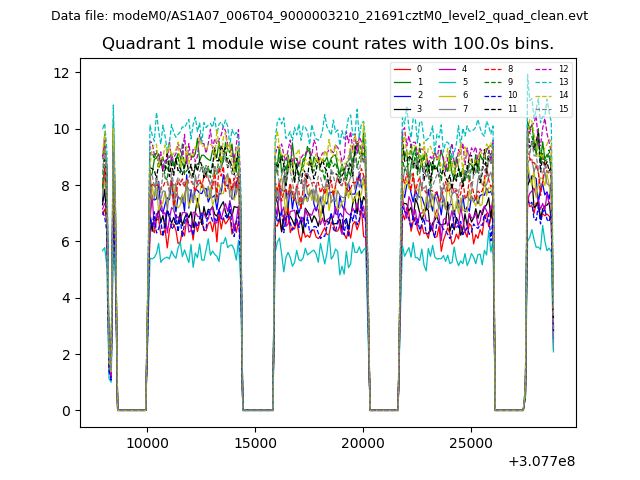
| Module-wise count rates for Quadrant A Data is divided into 100 sec bins |
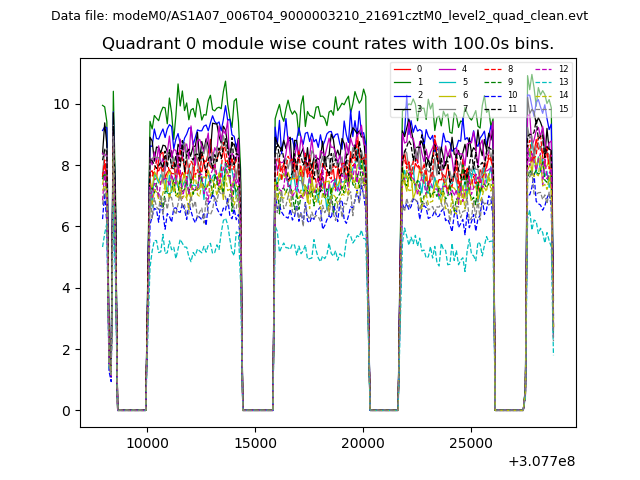 |
 |
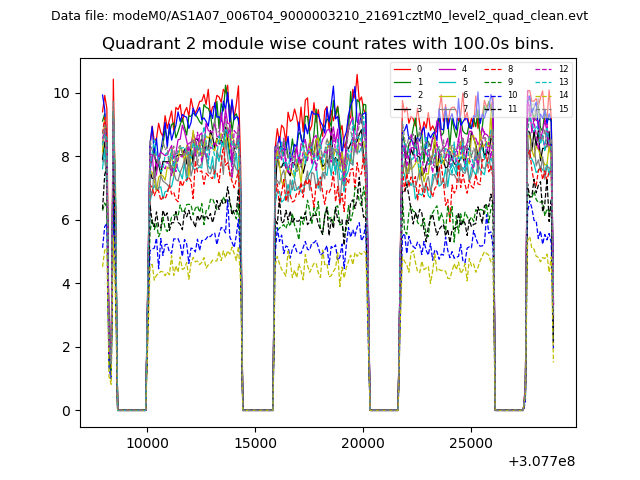
| Module-wise count rates for Quadrant B Data is divided into 100 sec bins |
 |
 |
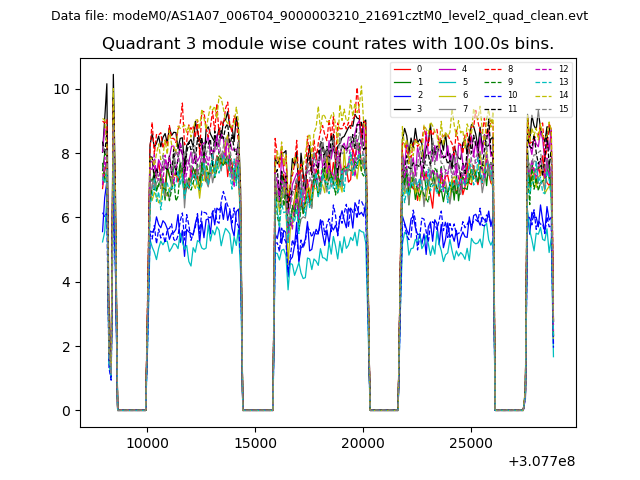
| Module-wise count rates for Quadrant C Data is divided into 100 sec bins |
 |
 |
| Module-wise count rates for Quadrant D Data is divided into 100 sec bins |
 |
 |
| Parameter | Plot |
|---|---|
| CZT HV Monitor | 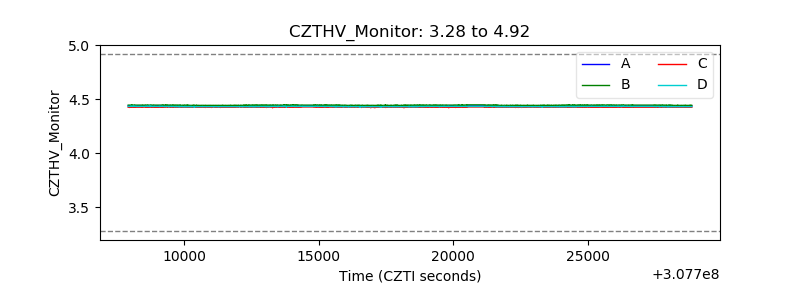 |
| D_VDD | 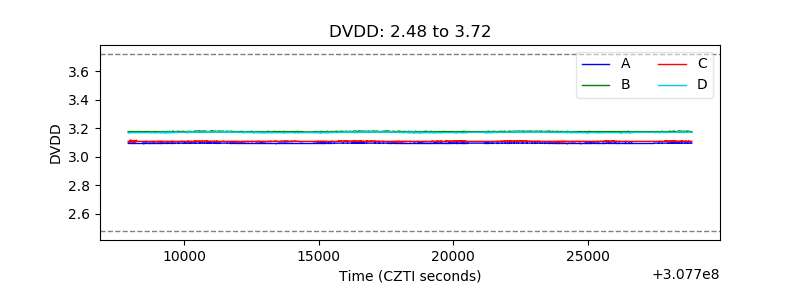 |
| Temperature 1 | 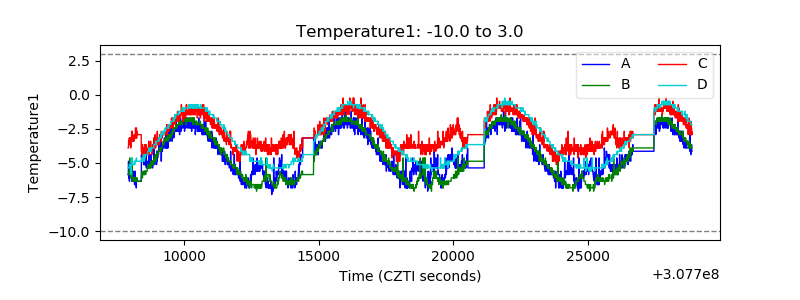 |
| Veto HV Monitor | 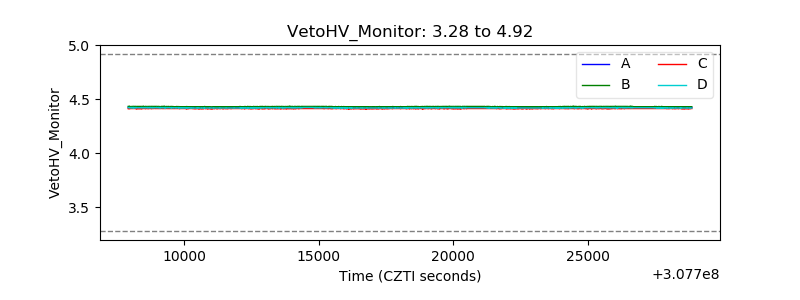 |
| Veto LLD | 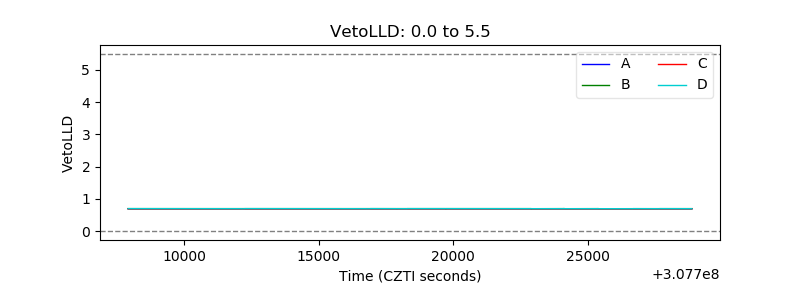 |
| Alpha Counter | 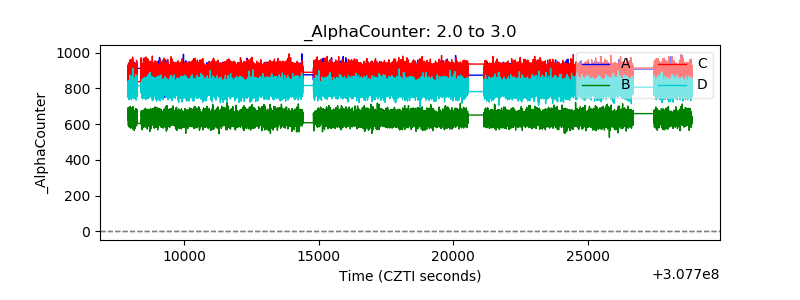 |
| _CPM_Rate | 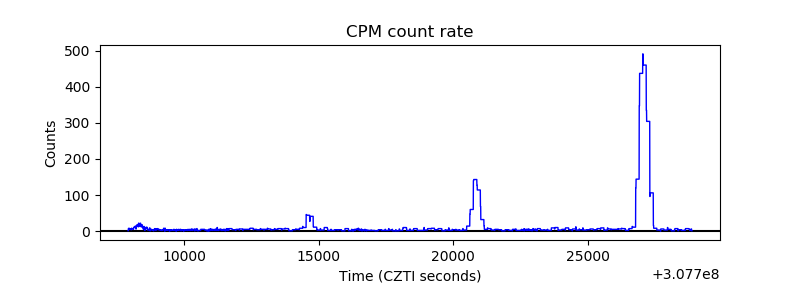 |
| CZT Counter | 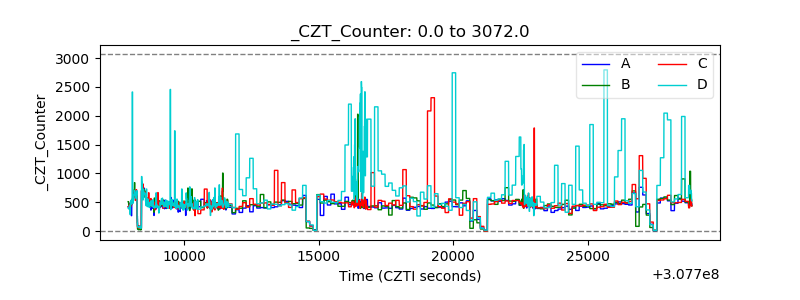 |
| +2.5 Volts monitor |  |
| +5 Volts monitor | 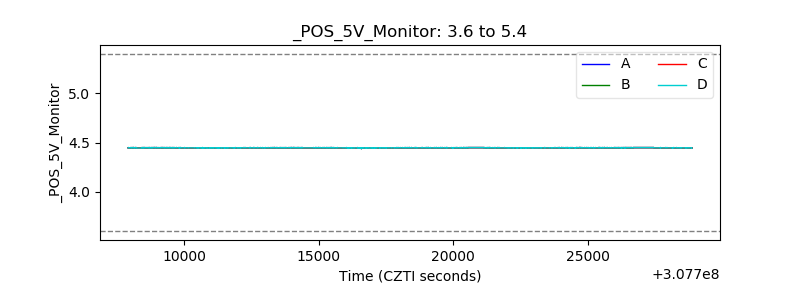 |
| _ROLL_ROT | 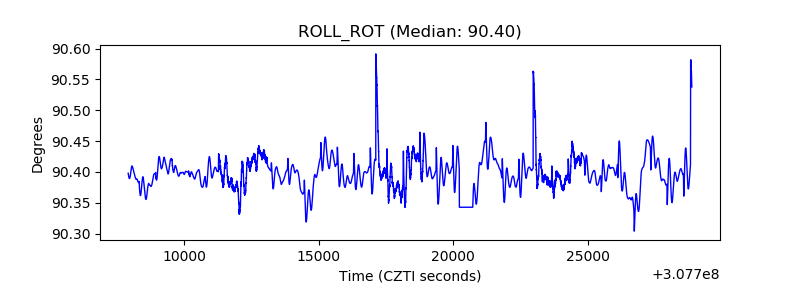 |
| _Roll_DEC | 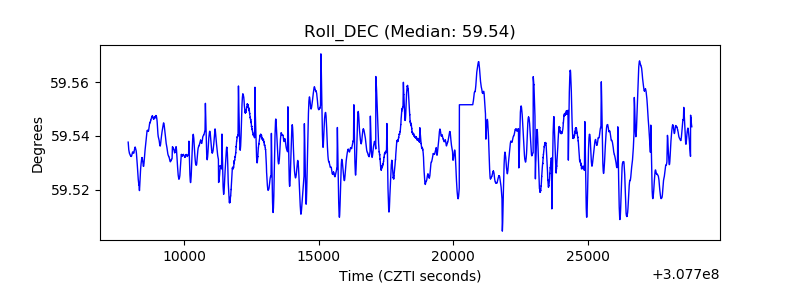 |
| _Roll_RA | 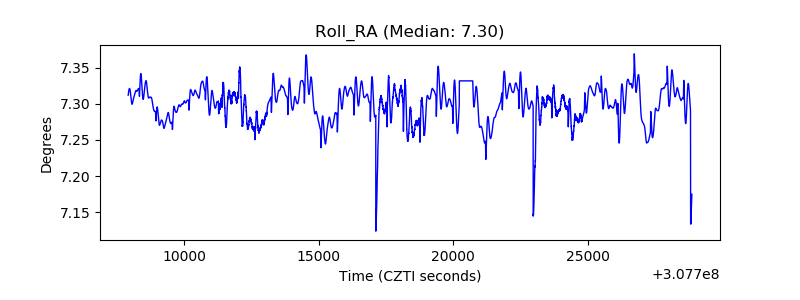 |
| Veto Counter | 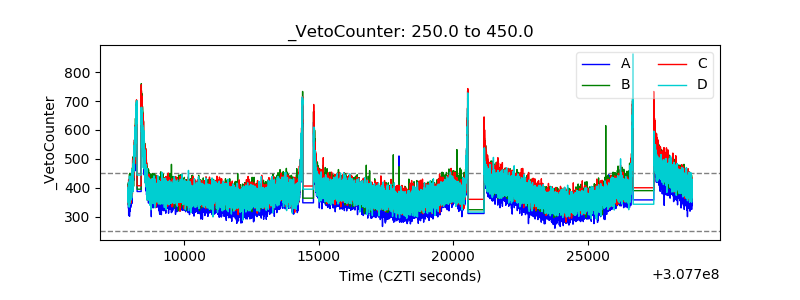 |