| Param | Original file | Final file |
|---|---|---|
| Filename | modeM0/AS1A07_006T04_9000003210_21695cztM0_level2.evt | modeM0/AS1A07_006T04_9000003210_21695cztM0_level2_quad_clean.evt |
| Size (bytes) | 564,860,160 | 103,181,760 |
| Size | 538.7 MB | 98.4 MB |
| Events in quadrant A | 3,058,151 | 695,408 |
| Events in quadrant B | 4,009,649 | 633,863 |
| Events in quadrant C | 4,307,670 | 690,774 |
| Events in quadrant D | 5,294,091 | 654,322 |
| Mode SS | |||
|---|---|---|---|
| Quadrant | BADHDUFLAG | Total packets | Discarded packets |
| A | 0 | 130 | 0 |
| B | 0 | 130 | 0 |
| C | 0 | 130 | 0 |
| D | 0 | 130 | 0 |
| Mode M0 | |||
|---|---|---|---|
| Quadrant | BADHDUFLAG | Total packets | Discarded packets |
| A | 0 | 13323 | 1 |
| B | 0 | 16174 | 1 |
| C | 0 | 17316 | 1 |
| D | 0 | 20171 | 1 |
| Mode M9 | |||
|---|---|---|---|
| Quadrant | BADHDUFLAG | Total packets | Discarded packets |
| A | 0 | 11 | 0 |
| B | 0 | 11 | 0 |
| C | 0 | 11 | 0 |
| D | 0 | 11 | 0 |
| Quadrant | Total seconds | Saturated seconds | Saturation percentage |
|---|---|---|---|
| A | 6454 | 27 | 0.418345% |
| B | 6455 | 630 | 9.759876% |
| C | 6455 | 274 | 4.244771% |
| D | 6455 | 339 | 5.251743% |
Noise dominated data is calculated using 1-second bins in cleaned event files. If a bin has >2000 counts, and if more than 50% of those come from <1% of pixels, then it is considered to be noise-dominated and hence unusable.
| Quadrant | # 1 sec bins | Bins with >0 counts | Bins with >2000 counts | High rate bins dominated by noise | Noise dominated (total time) | Noise dominated (detector-on time) | Marked lightcurve |
|---|---|---|---|---|---|---|---|
| A | 7539 | 6455 | 0 | 0 | 0.00% | 0.00% | 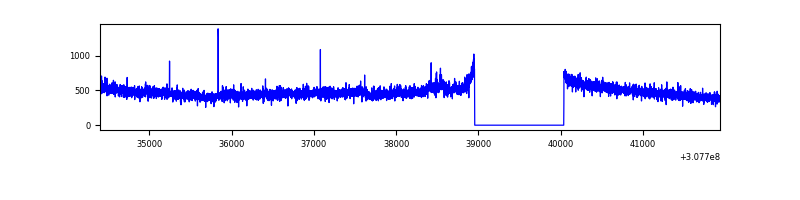 |
| B | 7540 | 6456 | 330 | 330 | 4.38% | 5.11% | 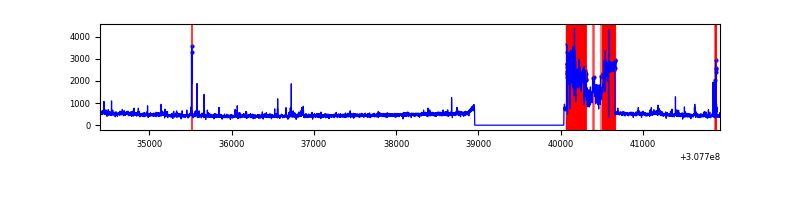 |
| C | 7540 | 6456 | 57 | 57 | 0.76% | 0.88% |  |
| D | 7540 | 6456 | 283 | 283 | 3.75% | 4.38% | 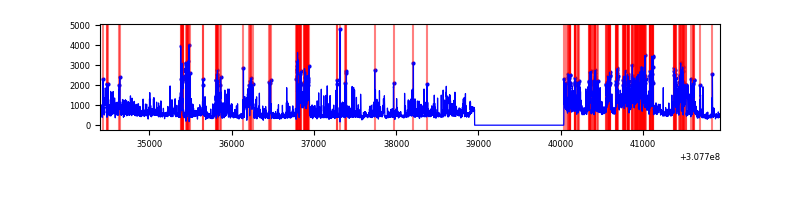 |
Top three noisy pixels from each quadrant. If the there are fewer than three noisy pixels in the level2.evt file, extra rows are filled as -1
| Pixel properties | Quadrant properties | ||||||
|---|---|---|---|---|---|---|---|
| Quadrant | DetID | PixID | Counts | Sigma | Mean | Median | Sigma |
| A | 15 | 236 | 141607 | 927.96 | 755 | 737 | 151.8 |
| A | 13 | 254 | 11531 | 71.1 | 755 | 737 | 151.8 |
| A | 0 | 226 | 6385 | 37.21 | 755 | 737 | 151.8 |
| B | 3 | 64 | 1216254 | 9375.11 | 692 | 674 | 129.7 |
| B | 0 | 229 | 32398 | 244.67 | 692 | 674 | 129.7 |
| B | 0 | 197 | 25507 | 191.52 | 692 | 674 | 129.7 |
| C | 8 | 208 | 1214426 | 6953.26 | 742 | 745 | 174.5 |
| C | 14 | 238 | 116520 | 663.28 | 742 | 745 | 174.5 |
| C | 10 | 22 | 75314 | 427.21 | 742 | 745 | 174.5 |
| D | 7 | 238 | 1110775 | 6225.85 | 737 | 716 | 178.3 |
| D | 1 | 52 | 973525 | 5456.07 | 737 | 716 | 178.3 |
| D | 12 | 235 | 143199 | 799.13 | 737 | 716 | 178.3 |
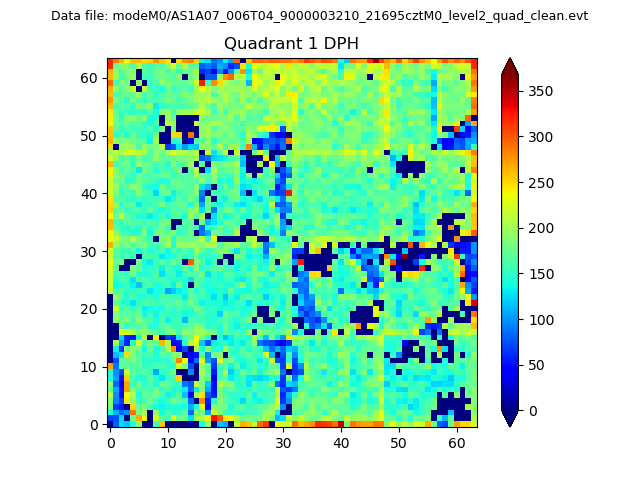
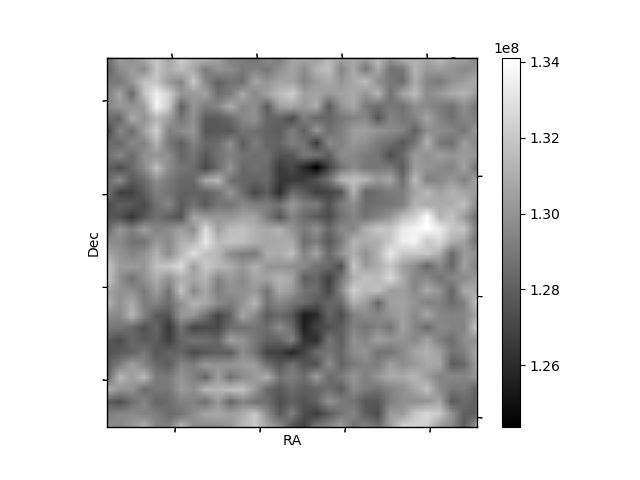
Histogram calculated using DETX and DETY for each event in the final _common_clean file
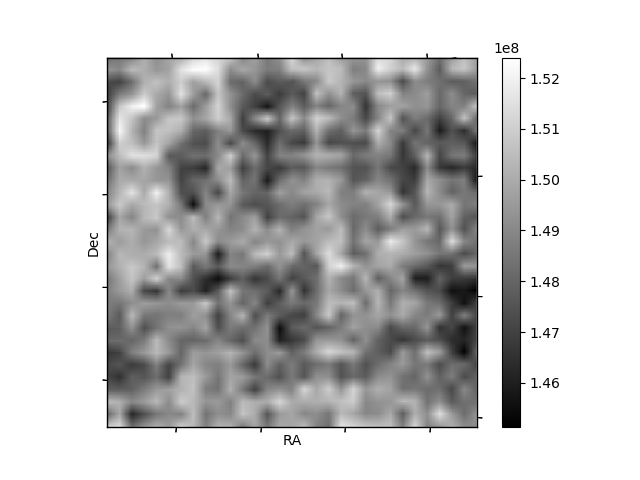
| Quadrant A |  |
 |
Quadrant B |
|---|---|---|---|
| Quadrant D |  |
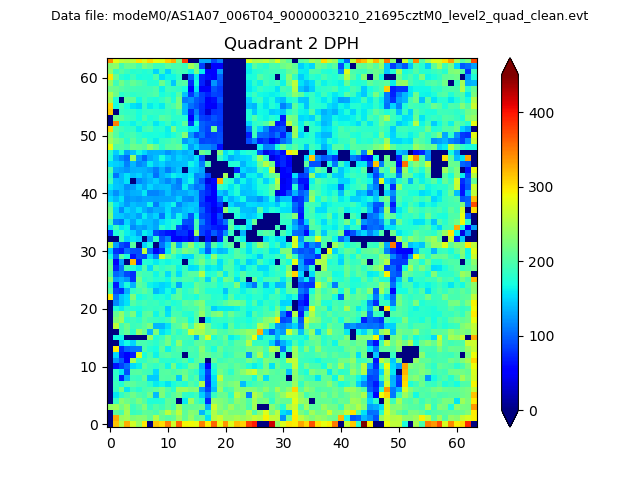 |
Quadrant C |
| Plot type | Count rate plots | Images |
|---|---|---|
| Comparison with Poisson distribution Blue bars denote a histogram of data divided into 1 sec bins. Red curve is a Poisson curve with rate = median count rate of data. |
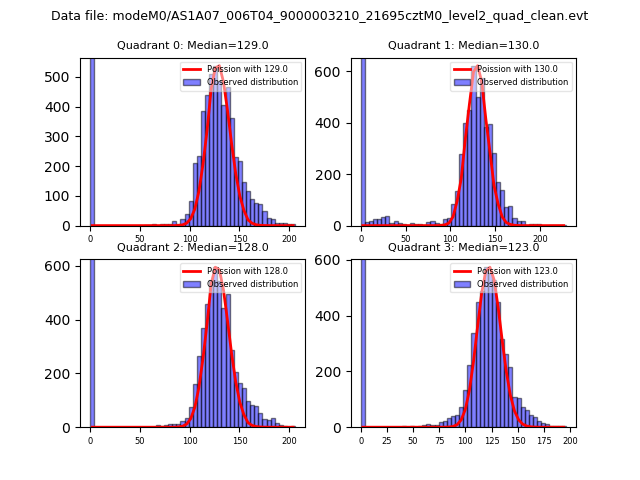 |
 |
| Quadrant-wise count rates Data is divided into 100 sec bins |
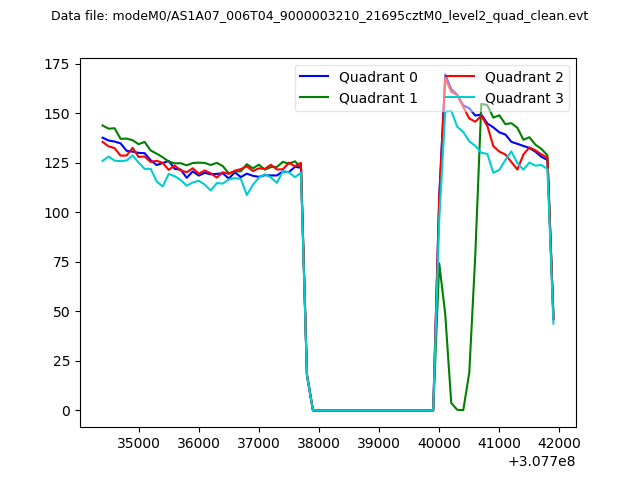 |
|
| Module-wise count rates for Quadrant A Data is divided into 100 sec bins |
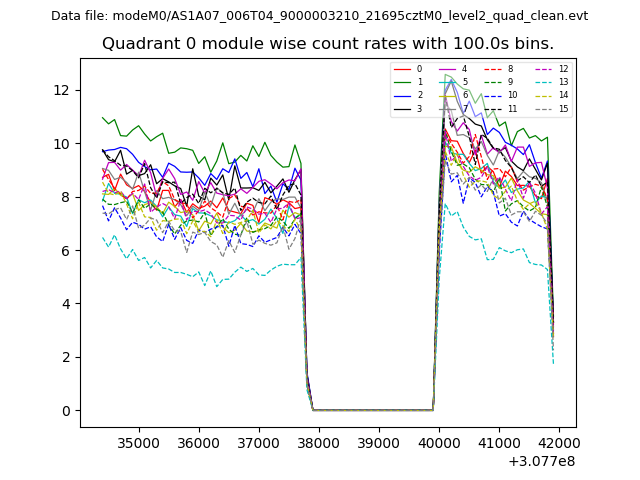 |
 |
| Module-wise count rates for Quadrant B Data is divided into 100 sec bins |
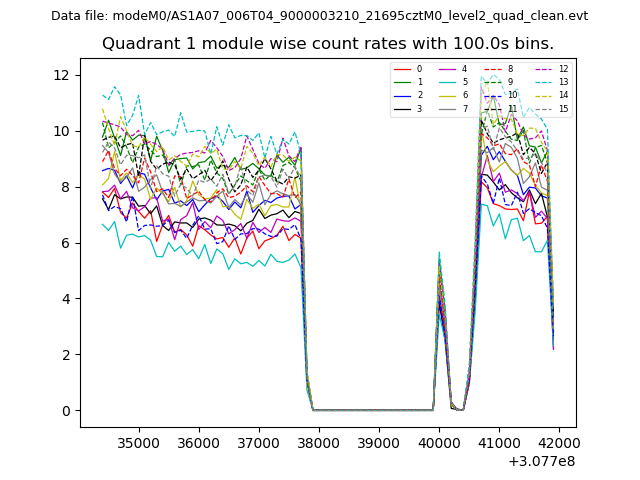 |
 |
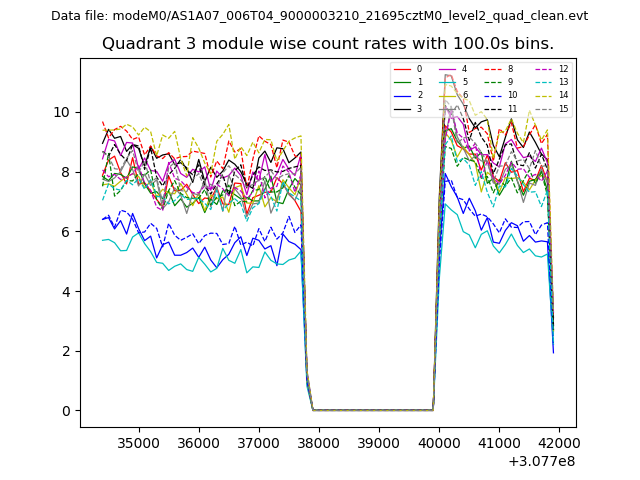
| Module-wise count rates for Quadrant C Data is divided into 100 sec bins |
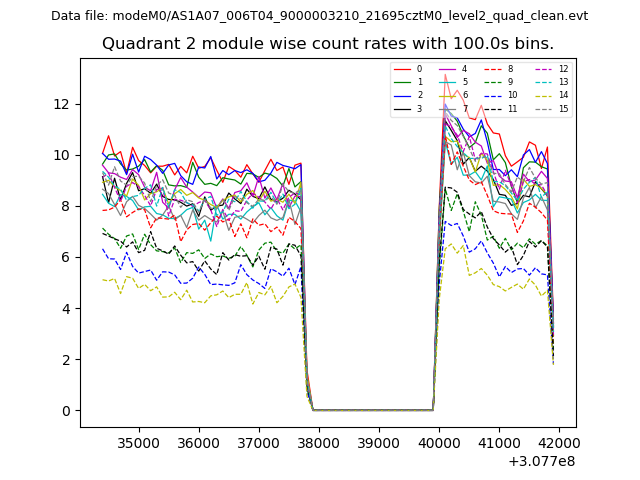 |
 |
| Module-wise count rates for Quadrant D Data is divided into 100 sec bins |
 |
 |
| Parameter | Plot |
|---|---|
| CZT HV Monitor | 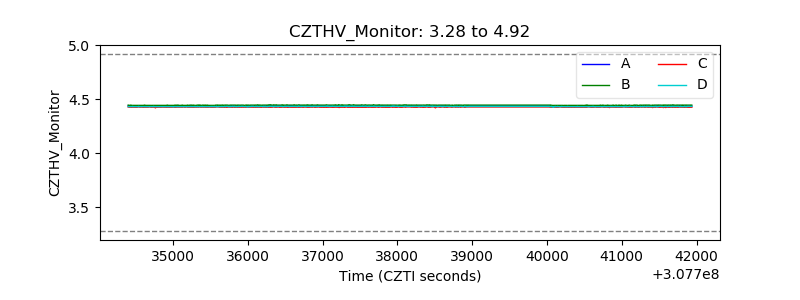 |
| D_VDD | 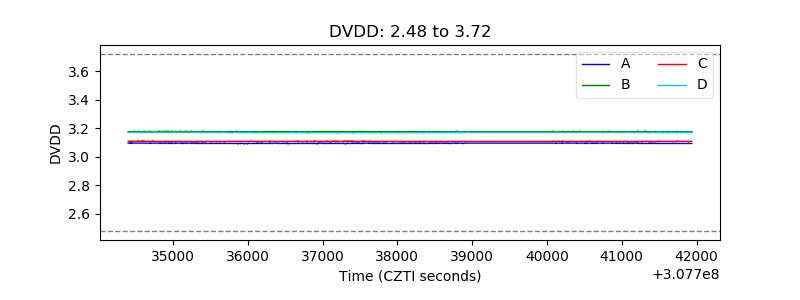 |
| Temperature 1 | 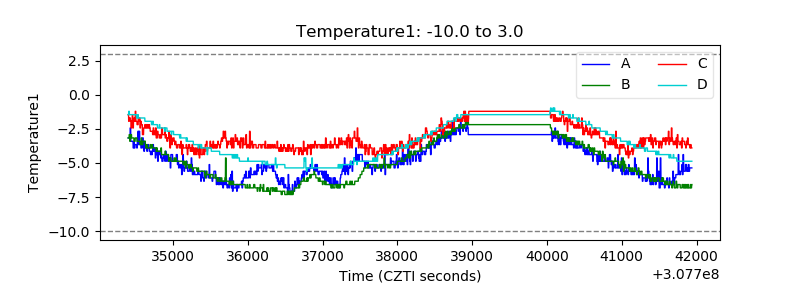 |
| Veto HV Monitor | 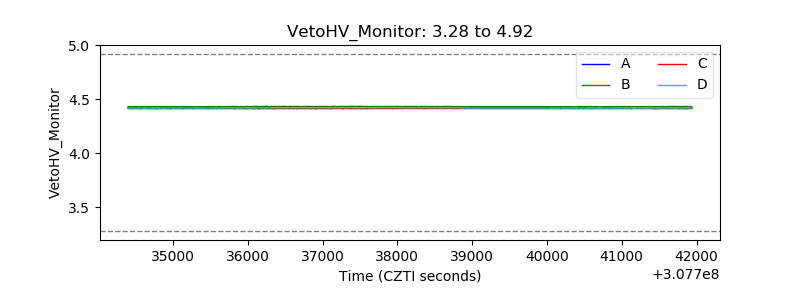 |
| Veto LLD | 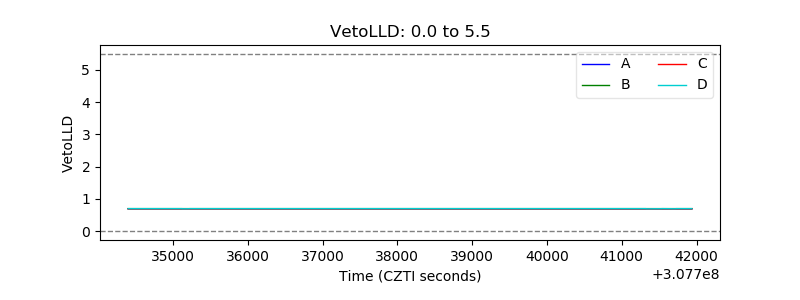 |
| Alpha Counter | 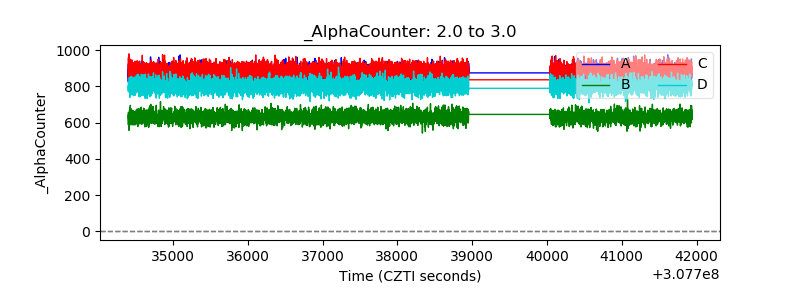 |
| _CPM_Rate | 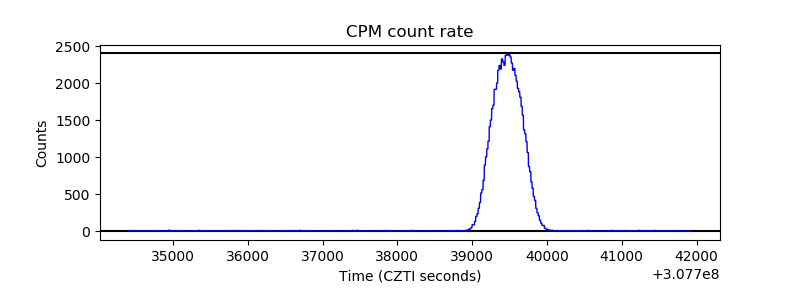 |
| CZT Counter |  |
| +2.5 Volts monitor |  |
| +5 Volts monitor |  |
| _ROLL_ROT | 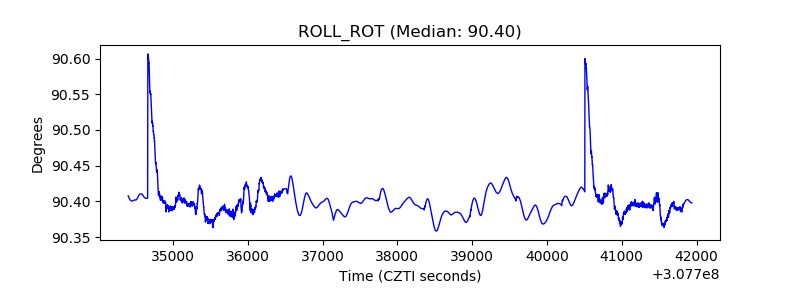 |
| _Roll_DEC | 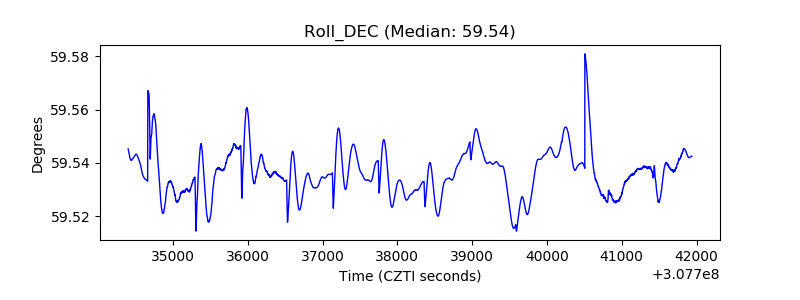 |
| _Roll_RA | 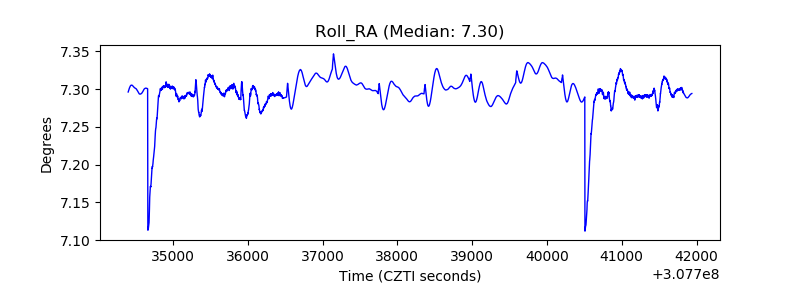 |
| Veto Counter | 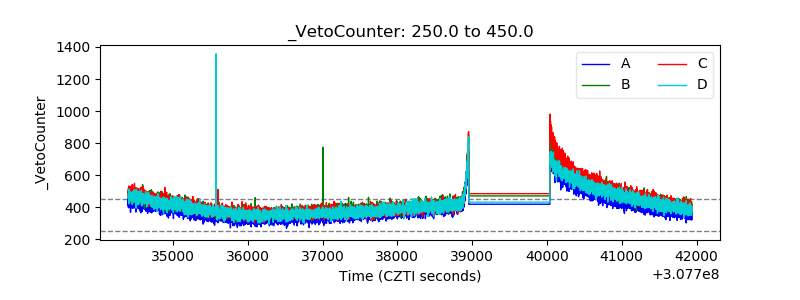 |