| Param | Original file | Final file |
|---|---|---|
| Filename | modeM0/AS1A07_039T02_9000003212cztM0_level2.fits | modeM0/AS1A07_039T02_9000003212cztM0_level2_quad_clean.evt |
| Size (bytes) | 477,201,600 | 607,939,200 |
| Size | 455.1 MB | 579.8 MB |
| Events in quadrant A | 2,919,746 | 3,916,799 |
| Events in quadrant B | 2,843,174 | 4,015,182 |
| Events in quadrant C | 2,813,232 | 3,616,812 |
| Events in quadrant D | 2,521,996 | 3,512,241 |
| Mode M0 | |||
|---|---|---|---|
| Quadrant | BADHDUFLAG | Total packets | Discarded packets |
| A | 0 | 105956 | 0 |
| B | 0 | 106742 | 0 |
| C | 0 | 177817 | 0 |
| D | 0 | 120483 | 0 |
| Mode SS | |||
|---|---|---|---|
| Quadrant | BADHDUFLAG | Total packets | Discarded packets |
| A | 0 | 992 | 0 |
| B | 0 | 992 | 0 |
| C | 0 | 992 | 0 |
| D | 0 | 992 | 0 |
| Mode M9 | |||
|---|---|---|---|
| Quadrant | BADHDUFLAG | Total packets | Discarded packets |
| A | 0 | 82 | 0 |
| B | 0 | 82 | 0 |
| C | 0 | 82 | 0 |
| D | 0 | 82 | 0 |
| Quadrant | Total seconds | Saturated seconds | Saturation percentage |
|---|---|---|---|
| A | 48840 | 1374 | 2.813268% |
| B | 48841 | 1100 | 2.252206% |
| C | 48841 | 5223 | 10.693884% |
| D | 48841 | 1488 | 3.046621% |
Noise dominated data is calculated using 1-second bins in cleaned event files. If a bin has >2000 counts, and if more than 50% of those come from <1% of pixels, then it is considered to be noise-dominated and hence unusable.
| Quadrant | # 1 sec bins | Bins with >0 counts | Bins with >2000 counts | High rate bins dominated by noise | Noise dominated (total time) | Noise dominated (detector-on time) | Marked lightcurve |
|---|---|---|---|---|---|---|---|
| A | 56921 | 48839 | 0 | 0 | 0.00% | 0.00% |  |
| B | 56921 | 48836 | 0 | 0 | 0.00% | 0.00% |  |
| C | 56921 | 48841 | 0 | 0 | 0.00% | 0.00% |  |
| D | 56921 | 48836 | 0 | 0 | 0.00% | 0.00% |  |
Top three noisy pixels from each quadrant. If the there are fewer than three noisy pixels in the level2.evt file, extra rows are filled as -1
| Pixel properties | Quadrant properties | ||||||
|---|---|---|---|---|---|---|---|
| Quadrant | DetID | PixID | Counts | Sigma | Mean | Median | Sigma |
| A | 0 | 29 | 2799 | 10.93 | 760 | 715 | 190.6 |
| A | 7 | 110 | 2336 | 8.5 | 760 | 715 | 190.6 |
| A | 9 | 19 | 2187 | 7.72 | 760 | 715 | 190.6 |
| B | 2 | 9 | 2281 | 10.76 | 751 | 719 | 145.2 |
| B | 5 | 128 | 1934 | 8.37 | 751 | 719 | 145.2 |
| B | 2 | 8 | 1911 | 8.21 | 751 | 719 | 145.2 |
| C | 1 | 80 | 2137 | 7.61 | 743 | 699 | 188.9 |
| C | 1 | 81 | 2137 | 7.61 | 743 | 699 | 188.9 |
| C | 12 | 241 | 1953 | 6.64 | 743 | 699 | 188.9 |
| D | 15 | 46 | 1838 | 6.17 | 720 | 659 | 190.9 |
| D | 7 | 3 | 1820 | 6.08 | 720 | 659 | 190.9 |
| D | 3 | 14 | 1805 | 6.0 | 720 | 659 | 190.9 |
Histogram calculated using DETX and DETY for each event in the final _common_clean file
| Quadrant A | 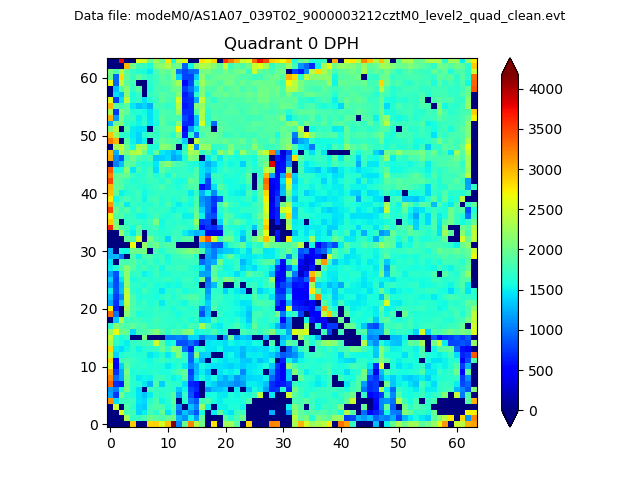 |
 |
Quadrant B |
|---|---|---|---|
| Quadrant D | 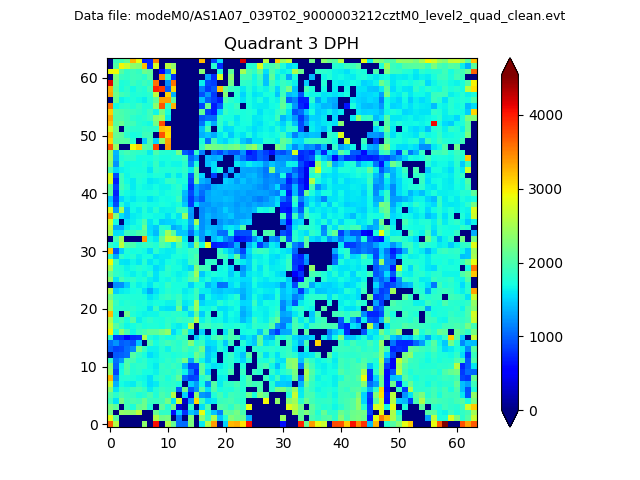 |
 |
Quadrant C |
| Plot type | Count rate plots | Images |
|---|---|---|
| Comparison with Poisson distribution Blue bars denote a histogram of data divided into 1 sec bins. Red curve is a Poisson curve with rate = median count rate of data. |
 |
 |
| Quadrant-wise count rates Data is divided into 100 sec bins |
 |
|
| Module-wise count rates for Quadrant A Data is divided into 100 sec bins |
 |
 |
| Module-wise count rates for Quadrant B Data is divided into 100 sec bins |
 |
 |
| Module-wise count rates for Quadrant C Data is divided into 100 sec bins |
 |
 |
| Module-wise count rates for Quadrant D Data is divided into 100 sec bins |
 |
 |
| Parameter | Plot |
|---|---|
| CZT HV Monitor |  |
| D_VDD |  |
| Temperature 1 |  |
| Veto HV Monitor |  |
| Veto LLD | 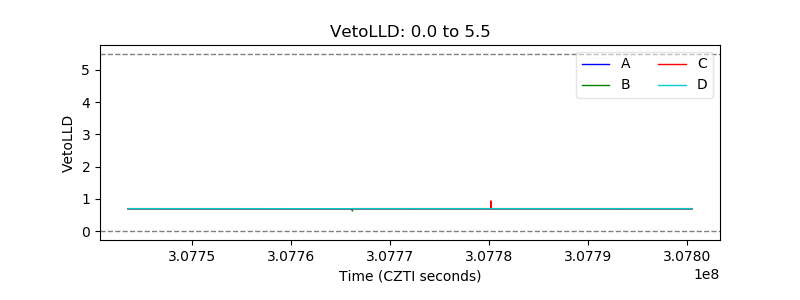 |
| Alpha Counter |  |
| _CPM_Rate |  |
| CZT Counter | 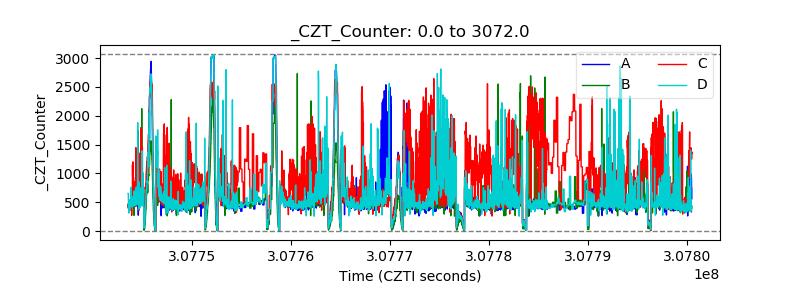 |
| +2.5 Volts monitor |  |
| +5 Volts monitor |  |
| _ROLL_ROT |  |
| _Roll_DEC | 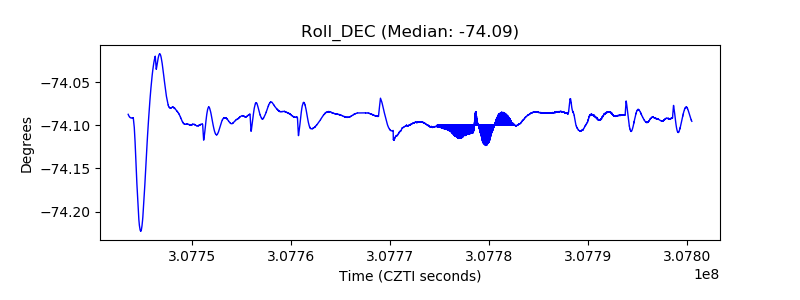 |
| _Roll_RA |  |
| Veto Counter |  |