| Param | Original file | Final file |
|---|---|---|
| Filename | modeM0/AS1A07_039T02_9000003212_21695cztM0_level2.evt | modeM0/AS1A07_039T02_9000003212_21695cztM0_level2_quad_clean.evt |
| Size (bytes) | 255,124,800 | 62,064,000 |
| Size | 243.3 MB | 59.2 MB |
| Events in quadrant A | 1,467,621 | 419,792 |
| Events in quadrant B | 1,633,126 | 435,548 |
| Events in quadrant C | 2,512,981 | 413,178 |
| Events in quadrant D | 1,912,554 | 402,032 |
| Mode M0 | |||
|---|---|---|---|
| Quadrant | BADHDUFLAG | Total packets | Discarded packets |
| A | 0 | 6128 | 3 |
| B | 0 | 6650 | 1 |
| C | 0 | 9414 | 1 |
| D | 0 | 7597 | 1 |
| Mode SS | |||
|---|---|---|---|
| Quadrant | BADHDUFLAG | Total packets | Discarded packets |
| A | 0 | 58 | 0 |
| B | 0 | 58 | 0 |
| C | 0 | 58 | 0 |
| D | 0 | 58 | 0 |
| Mode M9 | |||
|---|---|---|---|
| Quadrant | BADHDUFLAG | Total packets | Discarded packets |
| A | 0 | 13 | 0 |
| B | 0 | 13 | 0 |
| C | 0 | 13 | 0 |
| D | 0 | 13 | 0 |
| Quadrant | Total seconds | Saturated seconds | Saturation percentage |
|---|---|---|---|
| A | 2936 | 4 | 0.136240% |
| B | 2937 | 38 | 1.293837% |
| C | 2937 | 103 | 3.506980% |
| D | 2937 | 38 | 1.293837% |
Noise dominated data is calculated using 1-second bins in cleaned event files. If a bin has >2000 counts, and if more than 50% of those come from <1% of pixels, then it is considered to be noise-dominated and hence unusable.
| Quadrant | # 1 sec bins | Bins with >0 counts | Bins with >2000 counts | High rate bins dominated by noise | Noise dominated (total time) | Noise dominated (detector-on time) | Marked lightcurve |
|---|---|---|---|---|---|---|---|
| A | 4152 | 2938 | 0 | 0 | 0.00% | 0.00% |  |
| B | 4152 | 2938 | 13 | 13 | 0.31% | 0.44% | 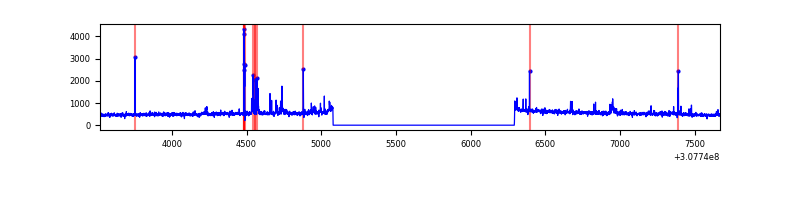 |
| C | 4152 | 2938 | 9 | 9 | 0.22% | 0.31% | 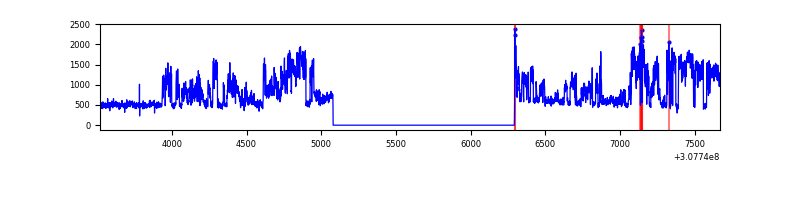 |
| D | 4152 | 2938 | 31 | 31 | 0.75% | 1.06% |  |
Top three noisy pixels from each quadrant. If the there are fewer than three noisy pixels in the level2.evt file, extra rows are filled as -1
| Pixel properties | Quadrant properties | ||||||
|---|---|---|---|---|---|---|---|
| Quadrant | DetID | PixID | Counts | Sigma | Mean | Median | Sigma |
| A | 13 | 254 | 5435 | 65.26 | 380 | 373 | 77.6 |
| A | 0 | 226 | 3297 | 37.7 | 380 | 373 | 77.6 |
| A | 3 | 137 | 3144 | 35.73 | 380 | 373 | 77.6 |
| B | 0 | 229 | 59615 | 816.2 | 383 | 373 | 72.6 |
| B | 3 | 64 | 42810 | 584.67 | 383 | 373 | 72.6 |
| B | 0 | 230 | 11963 | 159.68 | 383 | 373 | 72.6 |
| C | 8 | 208 | 997589 | 11518.09 | 368 | 370 | 86.6 |
| C | 14 | 238 | 59466 | 682.57 | 368 | 370 | 86.6 |
| C | 3 | 233 | 10925 | 121.91 | 368 | 370 | 86.6 |
| D | 1 | 20 | 222932 | 2487.35 | 369 | 358 | 89.5 |
| D | 12 | 235 | 67627 | 751.76 | 369 | 358 | 89.5 |
| D | 2 | 136 | 56587 | 628.38 | 369 | 358 | 89.5 |
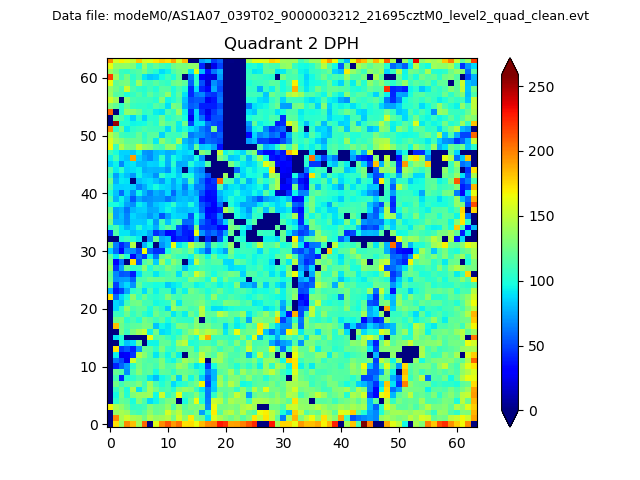
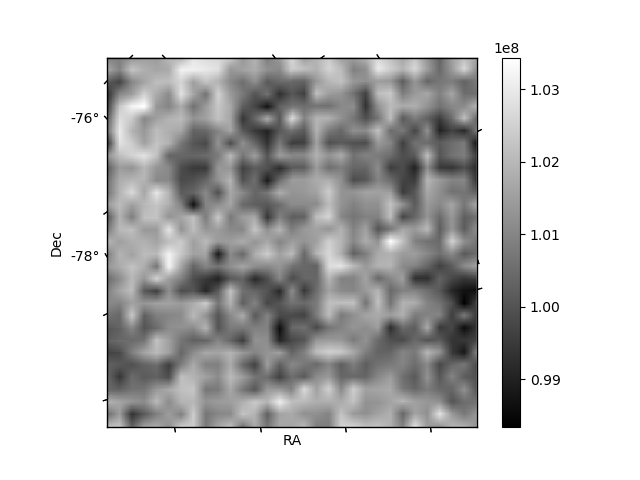
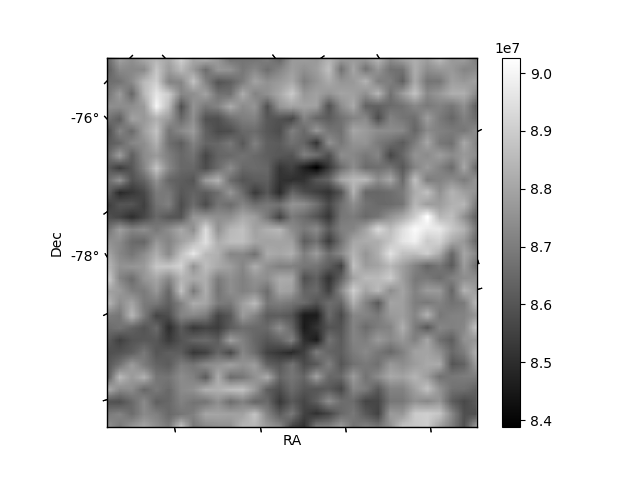
Histogram calculated using DETX and DETY for each event in the final _common_clean file
| Quadrant A | 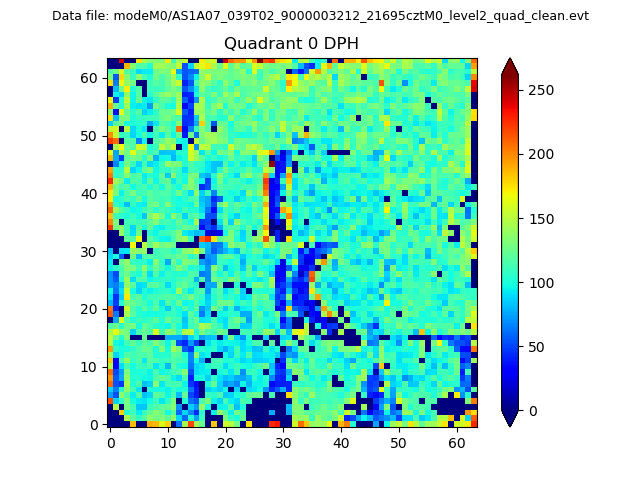 |
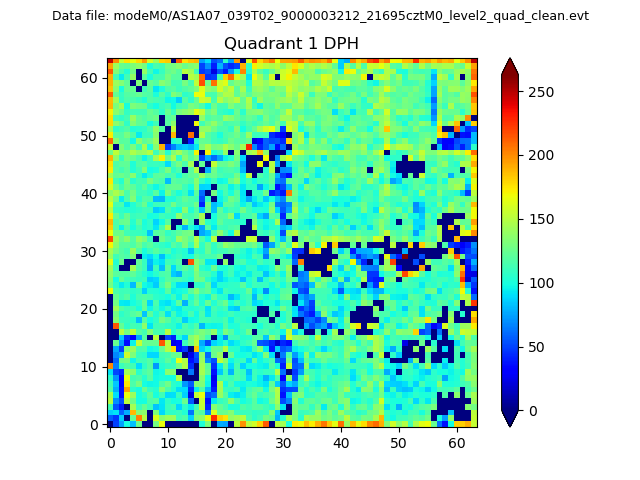 |
Quadrant B |
|---|---|---|---|
| Quadrant D | 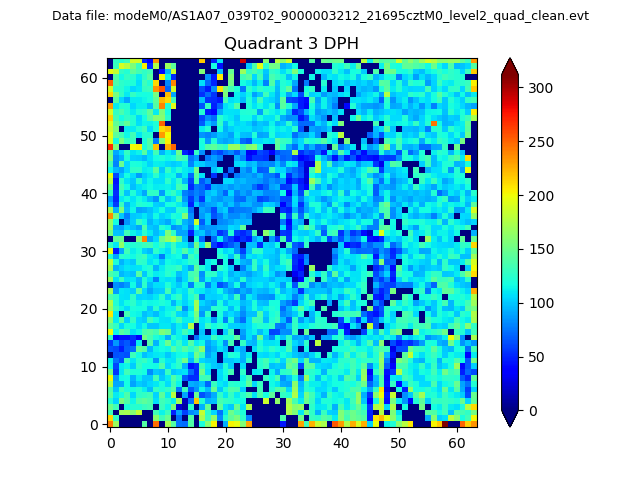 |
 |
Quadrant C |
| Plot type | Count rate plots | Images |
|---|---|---|
| Comparison with Poisson distribution Blue bars denote a histogram of data divided into 1 sec bins. Red curve is a Poisson curve with rate = median count rate of data. |
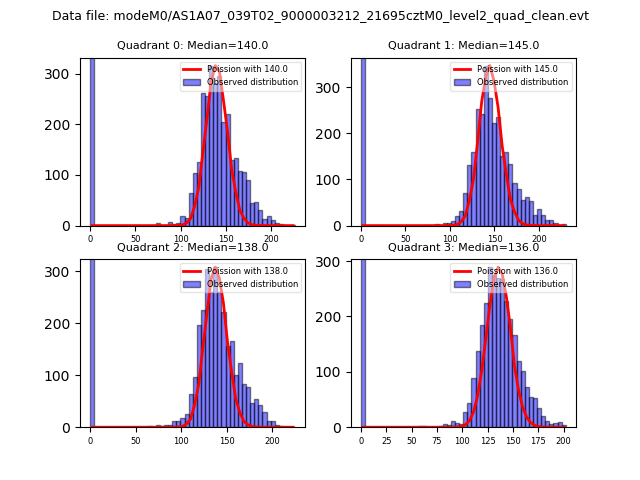 |
 |
| Quadrant-wise count rates Data is divided into 100 sec bins |
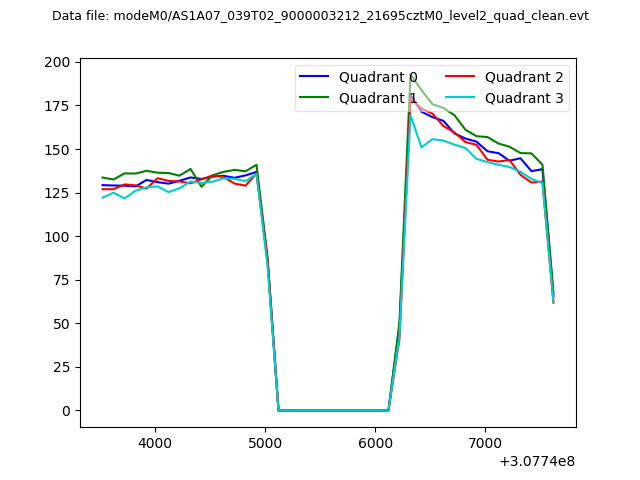 |
|
| Module-wise count rates for Quadrant A Data is divided into 100 sec bins |
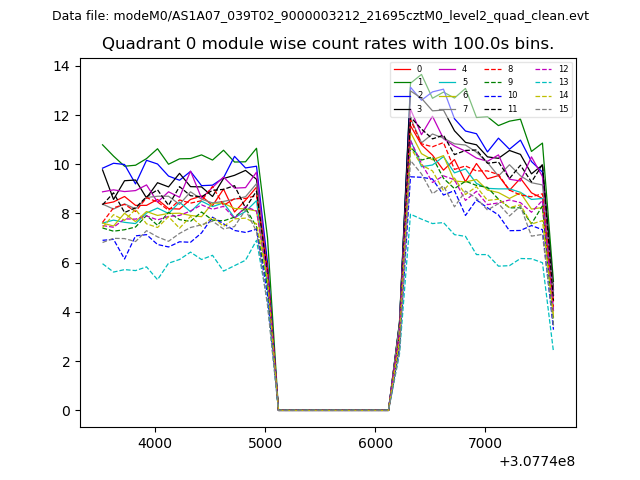 |
 |
| Module-wise count rates for Quadrant B Data is divided into 100 sec bins |
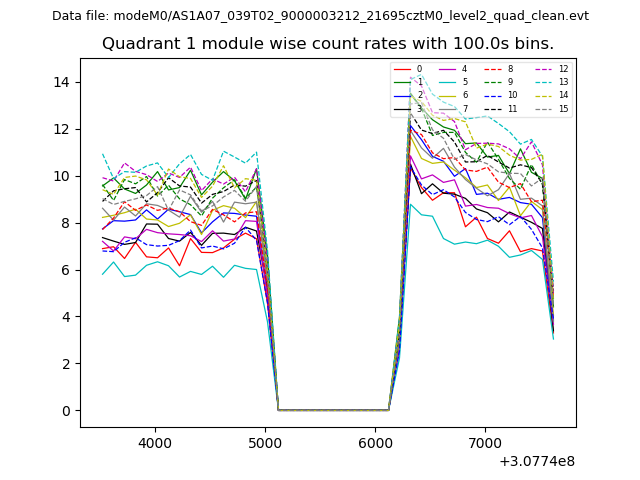 |
 |
| Module-wise count rates for Quadrant C Data is divided into 100 sec bins |
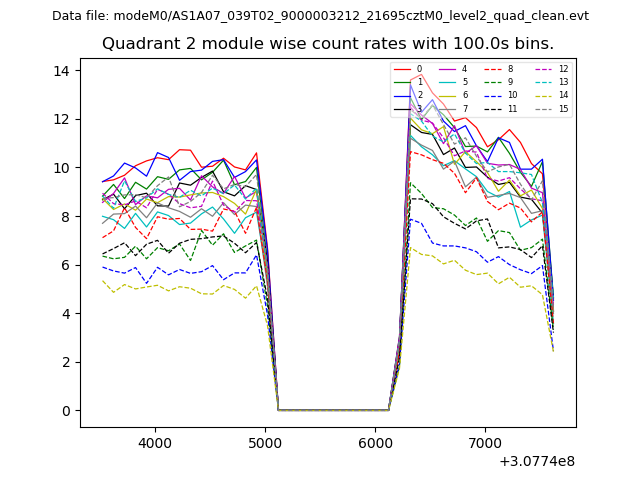 |
 |
| Module-wise count rates for Quadrant D Data is divided into 100 sec bins |
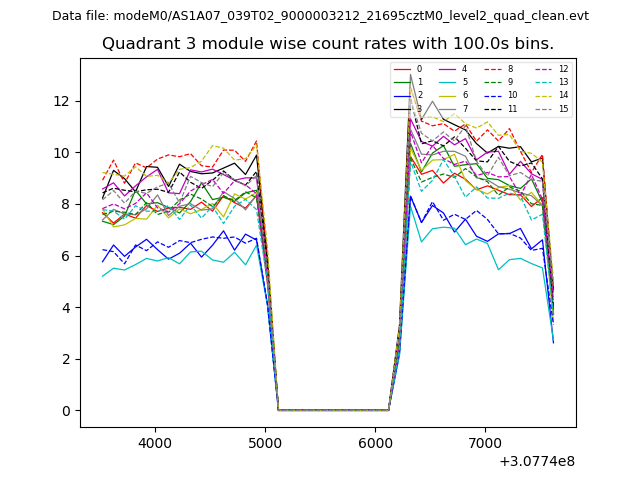 |
 |
| Parameter | Plot |
|---|---|
| CZT HV Monitor | 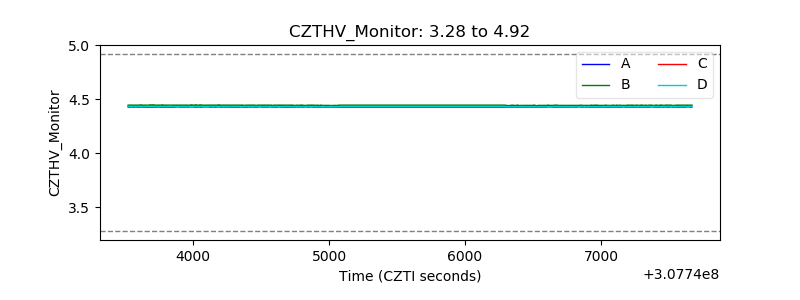 |
| D_VDD |  |
| Temperature 1 | 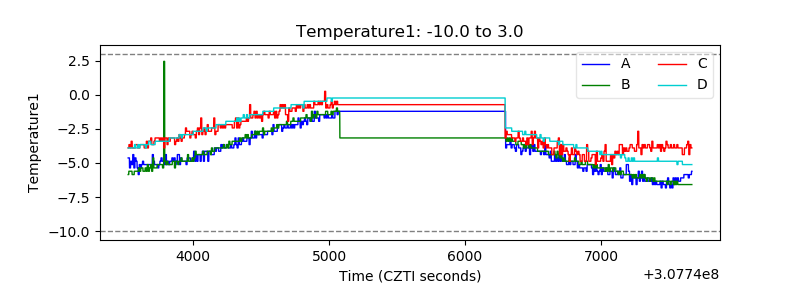 |
| Veto HV Monitor | 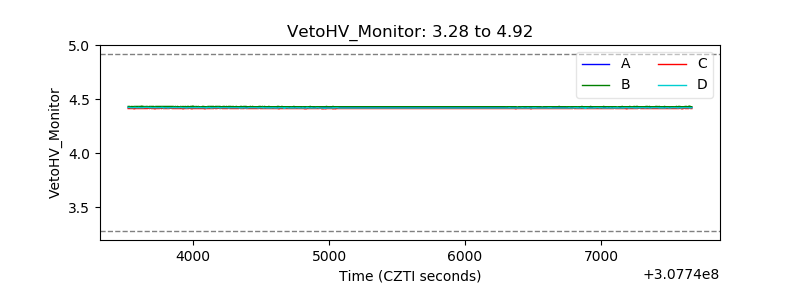 |
| Veto LLD | 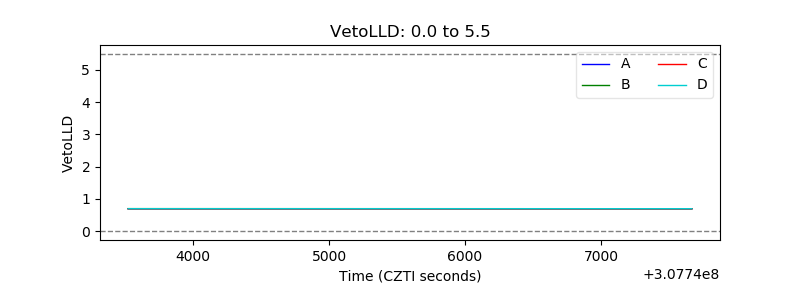 |
| Alpha Counter | 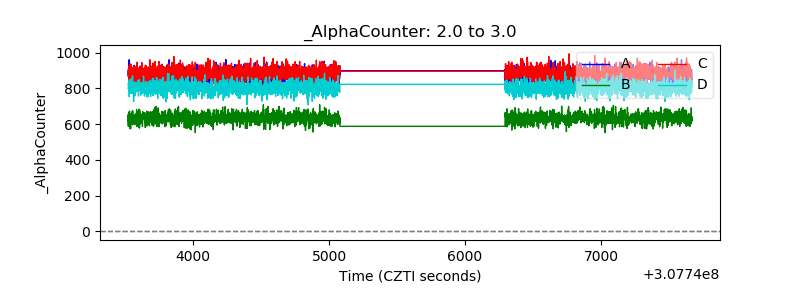 |
| _CPM_Rate | 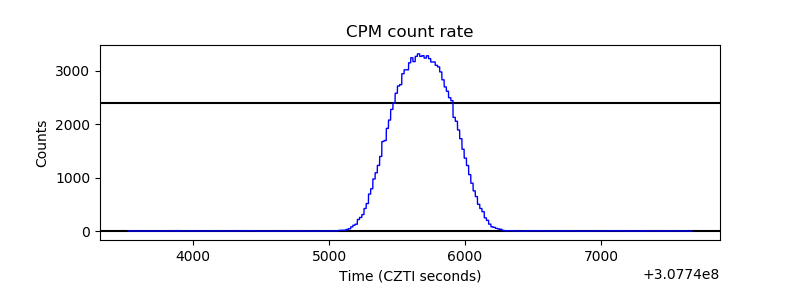 |
| CZT Counter | 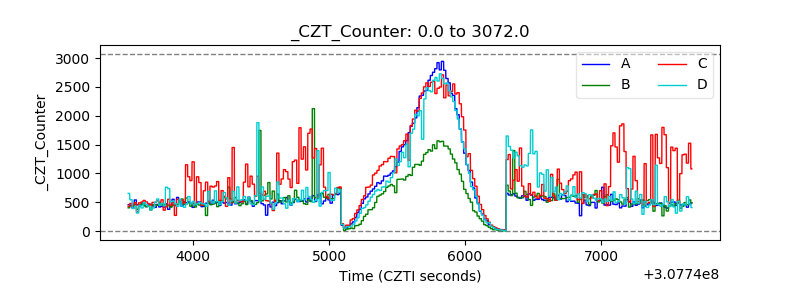 |
| +2.5 Volts monitor |  |
| +5 Volts monitor |  |
| _ROLL_ROT | 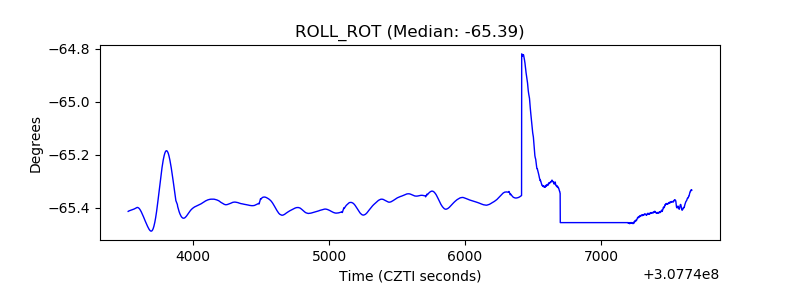 |
| _Roll_DEC | 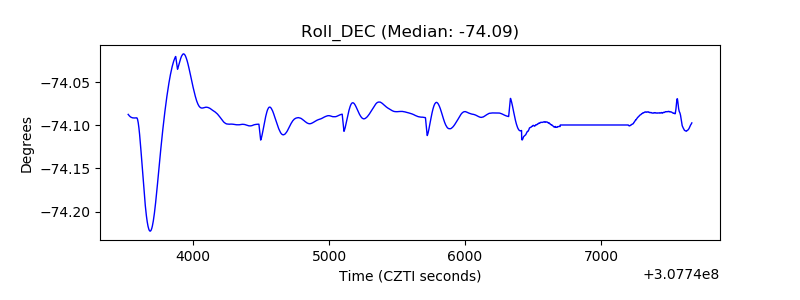 |
| _Roll_RA | 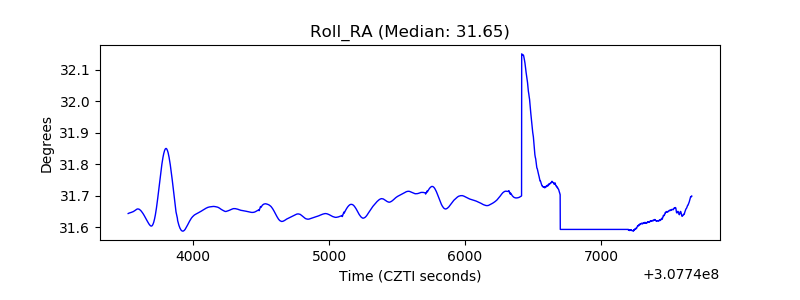 |
| Veto Counter | 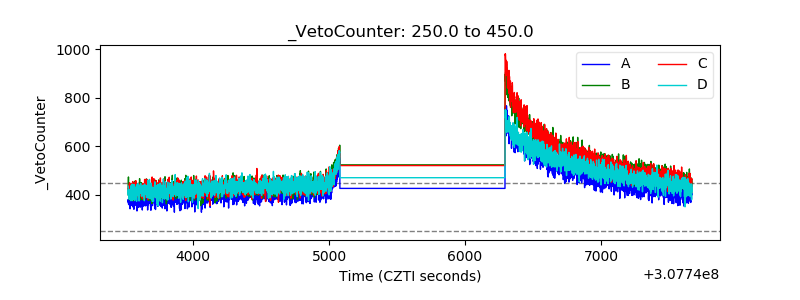 |